Cities with the Highest Percentage of Immigrants from Middle Africa in Washington
RELATED REPORTS & OPTIONS
Middle Africa
Washington
Compare Cities
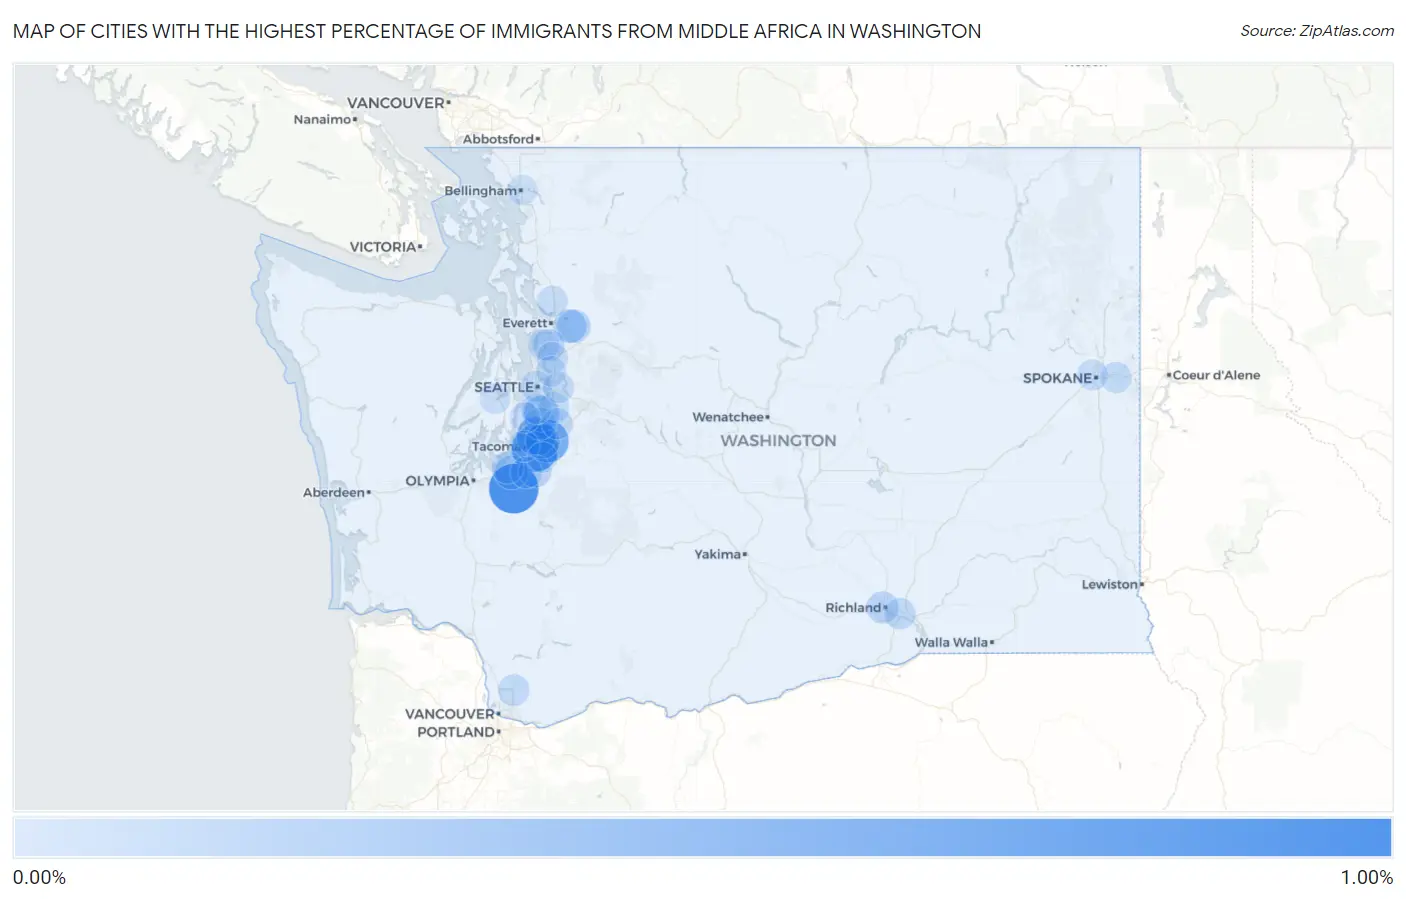
Map of Cities with the Highest Percentage of Immigrants from Middle Africa in Washington
0.00%
1.00%
Cities with the Highest Percentage of Immigrants from Middle Africa in Washington
| City | Middle Africa | vs State | vs National | |
| 1. | Roy | 0.98% | 0.027%(+0.951)#-1 | 0.059%(+0.920)#0 |
| 2. | Fife | 0.81% | 0.027%(+0.781)#0 | 0.059%(+0.750)#1 |
| 3. | Algona | 0.61% | 0.027%(+0.586)#1 | 0.059%(+0.554)#2 |
| 4. | Federal Way | 0.45% | 0.027%(+0.419)#21 | 0.059%(+0.387)#205 |
| 5. | Seatac | 0.29% | 0.027%(+0.261)#22 | 0.059%(+0.229)#206 |
| 6. | Lakeland South | 0.22% | 0.027%(+0.195)#23 | 0.059%(+0.164)#207 |
| 7. | Fort Lewis | 0.17% | 0.027%(+0.144)#24 | 0.059%(+0.113)#208 |
| 8. | Snohomish | 0.17% | 0.027%(+0.141)#25 | 0.059%(+0.109)#209 |
| 9. | Everett | 0.16% | 0.027%(+0.128)#33 | 0.059%(+0.097)#428 |
| 10. | Frederickson | 0.12% | 0.027%(+0.090)#34 | 0.059%(+0.059)#429 |
| 11. | North Fort Lewis | 0.100% | 0.027%(+0.073)#35 | 0.059%(+0.041)#430 |
| 12. | Richland | 0.095% | 0.027%(+0.068)#36 | 0.059%(+0.037)#431 |
| 13. | Martha Lake | 0.090% | 0.027%(+0.063)#37 | 0.059%(+0.032)#432 |
| 14. | Des Moines | 0.089% | 0.027%(+0.062)#38 | 0.059%(+0.030)#433 |
| 15. | Spanaway | 0.076% | 0.027%(+0.050)#39 | 0.059%(+0.018)#434 |
| 16. | Battle Ground | 0.067% | 0.027%(+0.040)#40 | 0.059%(+0.008)#435 |
| 17. | Pasco | 0.066% | 0.027%(+0.039)#41 | 0.059%(+0.007)#436 |
| 18. | Tacoma | 0.058% | 0.027%(+0.032)#42 | 0.059%(-0.000)#437 |
| 19. | North Lynnwood | 0.054% | 0.027%(+0.027)#43 | 0.059%(-0.005)#438 |
| 20. | Seattle | 0.051% | 0.027%(+0.024)#44 | 0.059%(-0.008)#439 |
| 21. | Renton | 0.050% | 0.027%(+0.023)#45 | 0.059%(-0.008)#440 |
| 22. | Spokane Valley | 0.043% | 0.027%(+0.017)#46 | 0.059%(-0.015)#441 |
| 23. | Kent | 0.043% | 0.027%(+0.016)#47 | 0.059%(-0.016)#442 |
| 24. | Bellevue | 0.041% | 0.027%(+0.014)#48 | 0.059%(-0.017)#443 |
| 25. | Bothell | 0.040% | 0.027%(+0.013)#49 | 0.059%(-0.019)#444 |
| 26. | Spokane | 0.037% | 0.027%(+0.010)#50 | 0.059%(-0.021)#445 |
| 27. | Marysville | 0.037% | 0.027%(+0.010)#51 | 0.059%(-0.022)#446 |
| 28. | Bremerton | 0.023% | 0.027%(-0.004)#52 | 0.059%(-0.036)#447 |
| 29. | Puyallup | 0.016% | 0.027%(-0.010)#53 | 0.059%(-0.042)#448 |
| 30. | Burien | 0.014% | 0.027%(-0.013)#54 | 0.059%(-0.045)#449 |
| 31. | Kirkland | 0.0098% | 0.027%(-0.017)#55 | 0.059%(-0.049)#450 |
| 32. | Vashon | 0.0091% | 0.027%(-0.018)#56 | 0.059%(-0.049)#451 |
| 33. | Bellingham | 0.0066% | 0.027%(-0.020)#57 | 0.059%(-0.052)#452 |
Common Questions
What are the Top 10 Cities with the Highest Percentage of Immigrants from Middle Africa in Washington?
Top 10 Cities with the Highest Percentage of Immigrants from Middle Africa in Washington are:
#1
0.98%
#2
0.81%
#3
0.61%
#4
0.45%
#5
0.29%
#6
0.22%
#7
0.17%
#8
0.17%
#9
0.16%
#10
0.12%
What city has the Highest Percentage of Immigrants from Middle Africa in Washington?
Roy has the Highest Percentage of Immigrants from Middle Africa in Washington with 0.98%.
What is the Percentage of Immigrants from Middle Africa in the State of Washington?
Percentage of Immigrants from Middle Africa in Washington is 0.027%.
What is the Percentage of Immigrants from Middle Africa in the United States?
Percentage of Immigrants from Middle Africa in the United States is 0.059%.