Cities with the Highest Percentage of Immigrants from Morocco in Washington
RELATED REPORTS & OPTIONS
Morocco
Washington
Compare Cities
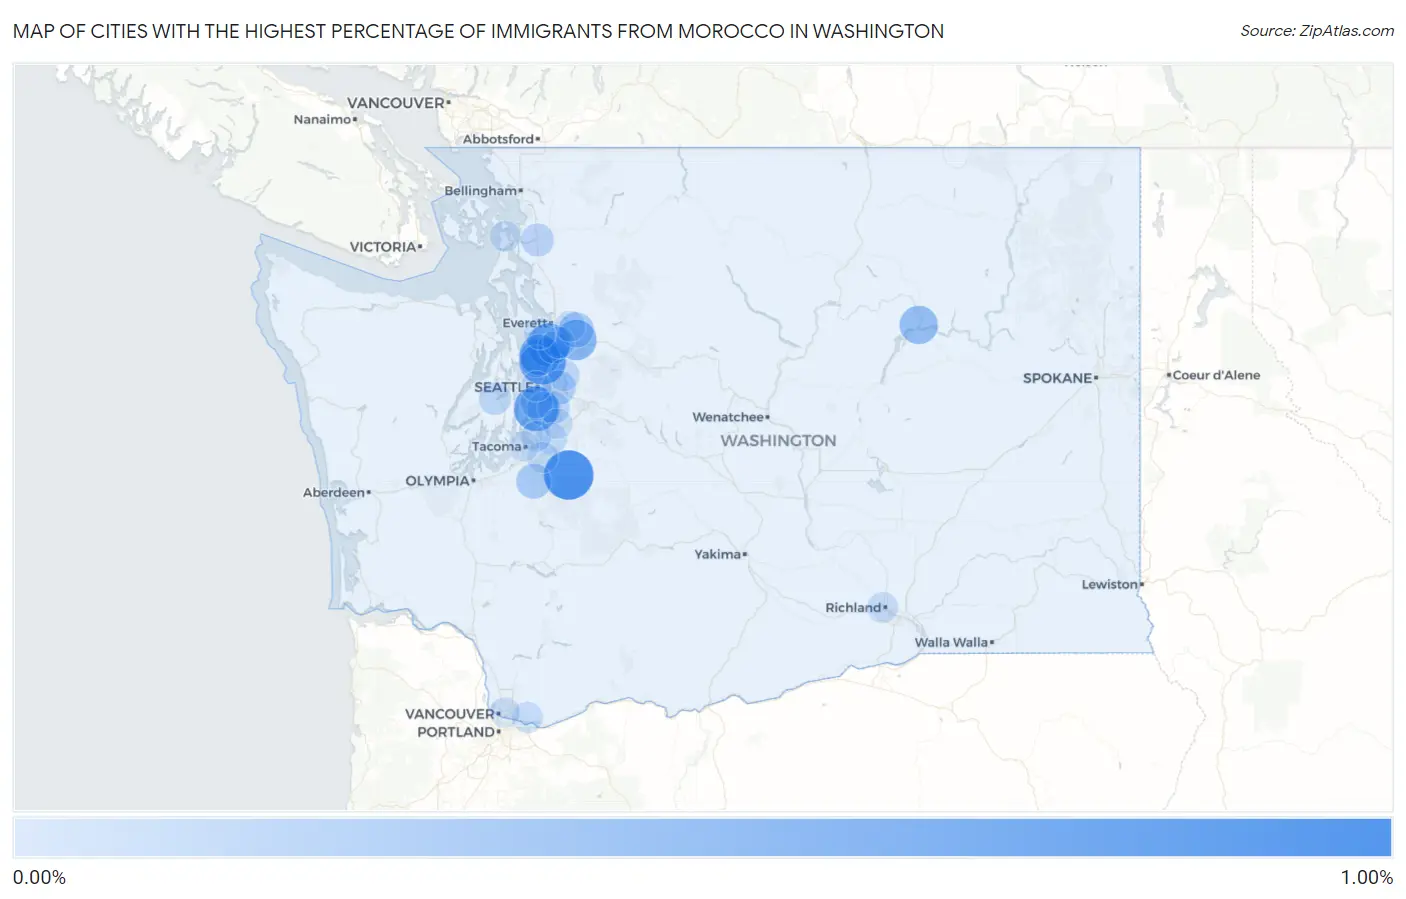
Map of Cities with the Highest Percentage of Immigrants from Morocco in Washington
0.00%
1.00%
Cities with the Highest Percentage of Immigrants from Morocco in Washington
| City | Morocco | vs State | vs National | |
| 1. | Carbonado | 0.91% | 0.023%(+0.886)#-1 | 0.027%(+0.882)#0 |
| 2. | Lake Forest Park | 0.77% | 0.023%(+0.750)#0 | 0.027%(+0.746)#1 |
| 3. | Burien | 0.68% | 0.023%(+0.657)#10 | 0.027%(+0.653)#299 |
| 4. | Martha Lake | 0.61% | 0.023%(+0.588)#11 | 0.027%(+0.584)#300 |
| 5. | Mountlake Terrace | 0.52% | 0.023%(+0.492)#12 | 0.027%(+0.489)#301 |
| 6. | Monroe North | 0.48% | 0.023%(+0.456)#13 | 0.027%(+0.452)#302 |
| 7. | Coulee Dam | 0.37% | 0.023%(+0.352)#14 | 0.027%(+0.348)#303 |
| 8. | Elk Plain | 0.22% | 0.023%(+0.202)#15 | 0.027%(+0.198)#304 |
| 9. | Three Lakes | 0.22% | 0.023%(+0.201)#16 | 0.027%(+0.197)#305 |
| 10. | Bellevue | 0.18% | 0.023%(+0.156)#17 | 0.027%(+0.152)#306 |
| 11. | Tukwila | 0.16% | 0.023%(+0.139)#18 | 0.027%(+0.136)#307 |
| 12. | Burlington | 0.13% | 0.023%(+0.105)#19 | 0.027%(+0.102)#308 |
| 13. | Renton | 0.10% | 0.023%(+0.078)#20 | 0.027%(+0.074)#309 |
| 14. | Bremerton | 0.091% | 0.023%(+0.068)#21 | 0.027%(+0.064)#310 |
| 15. | White Center | 0.090% | 0.023%(+0.068)#22 | 0.027%(+0.064)#311 |
| 16. | Shoreline | 0.090% | 0.023%(+0.068)#23 | 0.027%(+0.064)#312 |
| 17. | Fairwood Cdp King County | 0.086% | 0.023%(+0.063)#24 | 0.027%(+0.059)#313 |
| 18. | Mill Creek East | 0.071% | 0.023%(+0.048)#25 | 0.027%(+0.045)#314 |
| 19. | Redmond | 0.069% | 0.023%(+0.046)#26 | 0.027%(+0.043)#315 |
| 20. | Auburn | 0.065% | 0.023%(+0.043)#27 | 0.027%(+0.039)#316 |
| 21. | Silver Firs | 0.063% | 0.023%(+0.040)#28 | 0.027%(+0.036)#317 |
| 22. | Mukilteo | 0.051% | 0.023%(+0.029)#29 | 0.027%(+0.025)#318 |
| 23. | Puyallup | 0.042% | 0.023%(+0.019)#30 | 0.027%(+0.016)#319 |
| 24. | Camas | 0.038% | 0.023%(+0.015)#31 | 0.027%(+0.011)#320 |
| 25. | Richland | 0.030% | 0.023%(+0.007)#32 | 0.027%(+0.003)#321 |
| 26. | Everett | 0.029% | 0.023%(+0.006)#33 | 0.027%(+0.002)#322 |
| 27. | Federal Way | 0.023% | 0.023%(+0.000)#34 | 0.027%(-0.004)#323 |
| 28. | Seattle | 0.020% | 0.023%(-0.003)#35 | 0.027%(-0.006)#337 |
| 29. | Anacortes | 0.011% | 0.023%(-0.012)#36 | 0.027%(-0.015)#338 |
| 30. | Kent | 0.0067% | 0.023%(-0.016)#37 | 0.027%(-0.020)#339 |
| 31. | Vancouver | 0.0052% | 0.023%(-0.018)#38 | 0.027%(-0.021)#340 |
| 32. | Tacoma | 0.0023% | 0.023%(-0.021)#39 | 0.027%(-0.024)#341 |
Common Questions
What are the Top 10 Cities with the Highest Percentage of Immigrants from Morocco in Washington?
Top 10 Cities with the Highest Percentage of Immigrants from Morocco in Washington are:
#1
0.91%
#2
0.77%
#3
0.68%
#4
0.61%
#5
0.52%
#6
0.48%
#7
0.37%
#8
0.22%
#9
0.22%
#10
0.18%
What city has the Highest Percentage of Immigrants from Morocco in Washington?
Carbonado has the Highest Percentage of Immigrants from Morocco in Washington with 0.91%.
What is the Percentage of Immigrants from Morocco in the State of Washington?
Percentage of Immigrants from Morocco in Washington is 0.023%.
What is the Percentage of Immigrants from Morocco in the United States?
Percentage of Immigrants from Morocco in the United States is 0.027%.