Cities with the Highest Percentage of Families with Income Above $100,000 in Washington
RELATED REPORTS & OPTIONS
Family Income | $100k+
Washington
Compare Cities
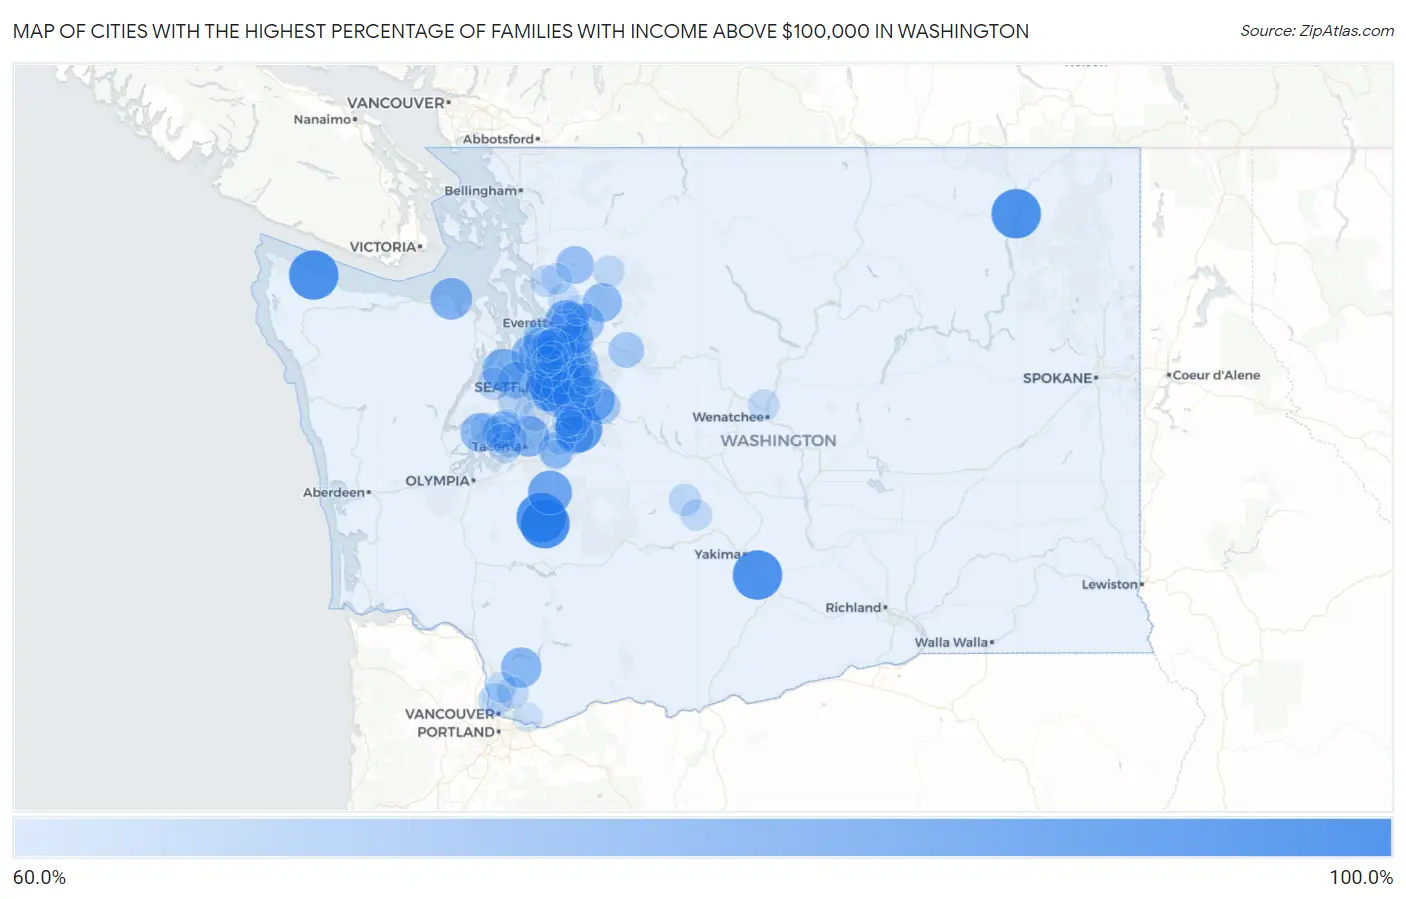
Map of Cities with the Highest Percentage of Families with Income Above $100,000 in Washington
0.0%
100.0%
Cities with the Highest Percentage of Families with Income Above $100,000 in Washington
| City | Families with Income > $100k | vs State | vs National | |
| 1. | La Grande | 100.0% | 54.2%(+45.8)#1 | 46.1%(+53.9)#71 |
| 2. | Donald | 100.0% | 54.2%(+45.8)#2 | 46.1%(+53.9)#139 |
| 3. | Alder | 100.0% | 54.2%(+45.8)#3 | 46.1%(+53.9)#142 |
| 4. | Pataha | 100.0% | 54.2%(+45.8)#4 | 46.1%(+53.9)#220 |
| 5. | Sekiu | 100.0% | 54.2%(+45.8)#5 | 46.1%(+53.9)#254 |
| 6. | Cougar | 100.0% | 54.2%(+45.8)#6 | 46.1%(+53.9)#319 |
| 7. | Barney S Junction | 100.0% | 54.2%(+45.8)#7 | 46.1%(+53.9)#339 |
| 8. | Ravensdale | 96.3% | 54.2%(+42.1)#8 | 46.1%(+50.2)#442 |
| 9. | Kapowsin | 91.3% | 54.2%(+37.1)#9 | 46.1%(+45.2)#534 |
| 10. | Clyde Hill | 90.8% | 54.2%(+36.6)#10 | 46.1%(+44.7)#548 |
| 11. | Beaux Arts Village | 90.1% | 54.2%(+35.9)#11 | 46.1%(+44.0)#581 |
| 12. | Keyport | 88.9% | 54.2%(+34.7)#12 | 46.1%(+42.8)#645 |
| 13. | Cavalero | 88.6% | 54.2%(+34.4)#13 | 46.1%(+42.5)#659 |
| 14. | Snoqualmie | 88.1% | 54.2%(+33.9)#14 | 46.1%(+42.0)#686 |
| 15. | Jamestown | 87.6% | 54.2%(+33.4)#15 | 46.1%(+41.5)#713 |
| 16. | Mirrormont | 87.3% | 54.2%(+33.1)#16 | 46.1%(+41.2)#727 |
| 17. | Sammamish | 87.0% | 54.2%(+32.8)#17 | 46.1%(+40.9)#744 |
| 18. | Medina | 86.3% | 54.2%(+32.1)#18 | 46.1%(+40.2)#793 |
| 19. | Dash Point | 86.2% | 54.2%(+32.0)#19 | 46.1%(+40.1)#801 |
| 20. | Amboy | 85.4% | 54.2%(+31.2)#20 | 46.1%(+39.3)#862 |
| 21. | Yarrow Point | 84.8% | 54.2%(+30.6)#21 | 46.1%(+38.7)#908 |
| 22. | Woodway | 84.8% | 54.2%(+30.6)#22 | 46.1%(+38.7)#909 |
| 23. | Cathcart | 84.0% | 54.2%(+29.8)#23 | 46.1%(+37.9)#971 |
| 24. | Duvall | 83.6% | 54.2%(+29.4)#24 | 46.1%(+37.5)#1,004 |
| 25. | Grapeview | 83.5% | 54.2%(+29.3)#25 | 46.1%(+37.4)#1,018 |
| 26. | Verlot | 83.4% | 54.2%(+29.2)#26 | 46.1%(+37.3)#1,029 |
| 27. | Mill Creek East | 83.3% | 54.2%(+29.1)#27 | 46.1%(+37.2)#1,032 |
| 28. | Black Diamond | 82.3% | 54.2%(+28.1)#28 | 46.1%(+36.2)#1,131 |
| 29. | Machias | 82.0% | 54.2%(+27.8)#29 | 46.1%(+35.9)#1,174 |
| 30. | Lake Roesiger | 82.0% | 54.2%(+27.8)#30 | 46.1%(+35.9)#1,175 |
| 31. | Mercer Island | 81.9% | 54.2%(+27.7)#31 | 46.1%(+35.8)#1,179 |
| 32. | High Bridge | 81.8% | 54.2%(+27.6)#32 | 46.1%(+35.7)#1,192 |
| 33. | Lake Cavanaugh | 81.7% | 54.2%(+27.5)#33 | 46.1%(+35.6)#1,211 |
| 34. | Tehaleh | 81.6% | 54.2%(+27.4)#34 | 46.1%(+35.5)#1,216 |
| 35. | Cottage Lake | 81.4% | 54.2%(+27.2)#35 | 46.1%(+35.3)#1,232 |
| 36. | Maltby | 80.8% | 54.2%(+26.6)#36 | 46.1%(+34.7)#1,303 |
| 37. | Hunts Point | 80.7% | 54.2%(+26.5)#37 | 46.1%(+34.6)#1,319 |
| 38. | Union Hill Novelty Hill | 80.5% | 54.2%(+26.3)#38 | 46.1%(+34.4)#1,327 |
| 39. | Rosedale | 80.0% | 54.2%(+25.8)#39 | 46.1%(+33.9)#1,374 |
| 40. | Bainbridge Island | 79.9% | 54.2%(+25.7)#40 | 46.1%(+33.8)#1,386 |
| 41. | Newcastle | 79.5% | 54.2%(+25.3)#41 | 46.1%(+33.4)#1,433 |
| 42. | Redmond | 78.9% | 54.2%(+24.7)#42 | 46.1%(+32.8)#1,512 |
| 43. | Lake Tapps | 78.8% | 54.2%(+24.6)#43 | 46.1%(+32.7)#1,534 |
| 44. | Esperance | 78.6% | 54.2%(+24.4)#44 | 46.1%(+32.5)#1,562 |
| 45. | Bothell West | 78.2% | 54.2%(+24.0)#45 | 46.1%(+32.1)#1,603 |
| 46. | Index | 78.1% | 54.2%(+23.9)#46 | 46.1%(+32.0)#1,629 |
| 47. | North Bend | 78.0% | 54.2%(+23.8)#47 | 46.1%(+31.9)#1,636 |
| 48. | Woodinville | 77.8% | 54.2%(+23.6)#48 | 46.1%(+31.7)#1,664 |
| 49. | Lake Forest Park | 77.2% | 54.2%(+23.0)#49 | 46.1%(+31.1)#1,747 |
| 50. | Silver Firs | 76.9% | 54.2%(+22.7)#50 | 46.1%(+30.8)#1,779 |
| 51. | Monroe North | 76.9% | 54.2%(+22.7)#51 | 46.1%(+30.8)#1,786 |
| 52. | Chain Lake | 76.7% | 54.2%(+22.5)#52 | 46.1%(+30.6)#1,810 |
| 53. | Wollochet | 76.5% | 54.2%(+22.3)#53 | 46.1%(+30.4)#1,842 |
| 54. | Clearview | 76.1% | 54.2%(+21.9)#54 | 46.1%(+30.0)#1,910 |
| 55. | Raft Island | 76.0% | 54.2%(+21.8)#55 | 46.1%(+29.9)#1,927 |
| 56. | Bellevue | 75.8% | 54.2%(+21.6)#56 | 46.1%(+29.7)#1,943 |
| 57. | Bothell East | 75.5% | 54.2%(+21.3)#57 | 46.1%(+29.4)#1,988 |
| 58. | Southworth | 75.5% | 54.2%(+21.3)#58 | 46.1%(+29.4)#1,993 |
| 59. | Picnic Point | 75.4% | 54.2%(+21.2)#59 | 46.1%(+29.3)#2,001 |
| 60. | Ames Lake | 75.2% | 54.2%(+21.0)#60 | 46.1%(+29.1)#2,042 |
| 61. | Felida | 75.1% | 54.2%(+20.9)#61 | 46.1%(+29.0)#2,049 |
| 62. | Issaquah | 74.3% | 54.2%(+20.1)#62 | 46.1%(+28.2)#2,178 |
| 63. | Bunk Foss | 74.1% | 54.2%(+19.9)#63 | 46.1%(+28.0)#2,220 |
| 64. | Chico | 73.7% | 54.2%(+19.5)#64 | 46.1%(+27.6)#2,272 |
| 65. | Kirkland | 73.4% | 54.2%(+19.2)#65 | 46.1%(+27.3)#2,300 |
| 66. | Lake Holm | 73.4% | 54.2%(+19.2)#66 | 46.1%(+27.3)#2,310 |
| 67. | Mukilteo | 73.3% | 54.2%(+19.1)#67 | 46.1%(+27.2)#2,320 |
| 68. | Cliffdell | 73.3% | 54.2%(+19.1)#68 | 46.1%(+27.2)#2,335 |
| 69. | Vaughn | 73.2% | 54.2%(+19.0)#69 | 46.1%(+27.1)#2,345 |
| 70. | Hobart | 73.0% | 54.2%(+18.8)#70 | 46.1%(+26.9)#2,369 |
| 71. | Meadowdale | 73.0% | 54.2%(+18.8)#71 | 46.1%(+26.9)#2,373 |
| 72. | Meadow Glade | 73.0% | 54.2%(+18.8)#72 | 46.1%(+26.9)#2,374 |
| 73. | Sunland Estates | 72.8% | 54.2%(+18.6)#73 | 46.1%(+26.7)#2,416 |
| 74. | Maple Valley | 72.6% | 54.2%(+18.4)#74 | 46.1%(+26.5)#2,444 |
| 75. | Larch Way | 72.6% | 54.2%(+18.4)#75 | 46.1%(+26.5)#2,453 |
| 76. | Fox Island | 72.6% | 54.2%(+18.4)#76 | 46.1%(+26.5)#2,454 |
| 77. | Sunnyslope | 72.3% | 54.2%(+18.1)#77 | 46.1%(+26.2)#2,497 |
| 78. | Sunday Lake | 72.3% | 54.2%(+18.1)#78 | 46.1%(+26.2)#2,502 |
| 79. | Swede Heaven | 72.2% | 54.2%(+18.0)#79 | 46.1%(+26.1)#2,516 |
| 80. | Riverpoint | 72.2% | 54.2%(+18.0)#80 | 46.1%(+26.1)#2,517 |
| 81. | Seattle | 72.1% | 54.2%(+17.9)#81 | 46.1%(+26.0)#2,523 |
| 82. | Fall City | 72.1% | 54.2%(+17.9)#82 | 46.1%(+26.0)#2,531 |
| 83. | Martha Lake | 72.0% | 54.2%(+17.8)#83 | 46.1%(+25.9)#2,542 |
| 84. | Nile | 72.0% | 54.2%(+17.8)#84 | 46.1%(+25.9)#2,559 |
| 85. | Canterwood | 71.9% | 54.2%(+17.7)#85 | 46.1%(+25.8)#2,569 |
| 86. | Sisco Heights | 71.8% | 54.2%(+17.6)#86 | 46.1%(+25.7)#2,584 |
| 87. | Shadow Lake | 71.8% | 54.2%(+17.6)#87 | 46.1%(+25.7)#2,585 |
| 88. | Beverly | 71.8% | 54.2%(+17.6)#88 | 46.1%(+25.7)#2,594 |
| 89. | Bothell | 71.7% | 54.2%(+17.5)#89 | 46.1%(+25.6)#2,596 |
| 90. | Bryant | 71.6% | 54.2%(+17.4)#90 | 46.1%(+25.5)#2,622 |
| 91. | Duluth | 71.6% | 54.2%(+17.4)#91 | 46.1%(+25.5)#2,624 |
| 92. | Mill Creek | 71.5% | 54.2%(+17.3)#92 | 46.1%(+25.4)#2,634 |
| 93. | Lake Marcel Stillwater | 71.5% | 54.2%(+17.3)#93 | 46.1%(+25.4)#2,646 |
| 94. | Kenmore | 71.4% | 54.2%(+17.2)#94 | 46.1%(+25.3)#2,656 |
| 95. | Carnation | 71.2% | 54.2%(+17.0)#95 | 46.1%(+25.1)#2,690 |
| 96. | Bonney Lake | 70.8% | 54.2%(+16.6)#96 | 46.1%(+24.7)#2,741 |
| 97. | Normandy Park | 70.4% | 54.2%(+16.2)#97 | 46.1%(+24.3)#2,819 |
| 98. | Lake Bosworth | 69.9% | 54.2%(+15.7)#98 | 46.1%(+23.8)#2,906 |
| 99. | Artondale | 69.8% | 54.2%(+15.6)#99 | 46.1%(+23.7)#2,915 |
| 100. | Camas | 69.7% | 54.2%(+15.5)#100 | 46.1%(+23.6)#2,932 |
Common Questions
What are the Top 10 Cities with the Highest Percentage of Families with Income Above $100,000 in Washington?
Top 10 Cities with the Highest Percentage of Families with Income Above $100,000 in Washington are:
#1
100.0%
#2
100.0%
#3
100.0%
#4
100.0%
#5
100.0%
#6
96.3%
#7
91.3%
#8
90.8%
#9
90.1%
#10
88.9%
What city has the Highest Percentage of Families with Income Above $100,000 in Washington?
La Grande has the Highest Percentage of Families with Income Above $100,000 in Washington with 100.0%.
What is the Percentage of Families with Income Above $100,000 in the State of Washington?
Percentage of Families with Income Above $100,000 in Washington is 54.2%.
What is the Percentage of Families with Income Above $100,000 in the United States?
Percentage of Families with Income Above $100,000 in the United States is 46.1%.