Cities with the Highest Percentage of Chilean Population in Washington
RELATED REPORTS & OPTIONS
Chilean
Washington
Compare Cities
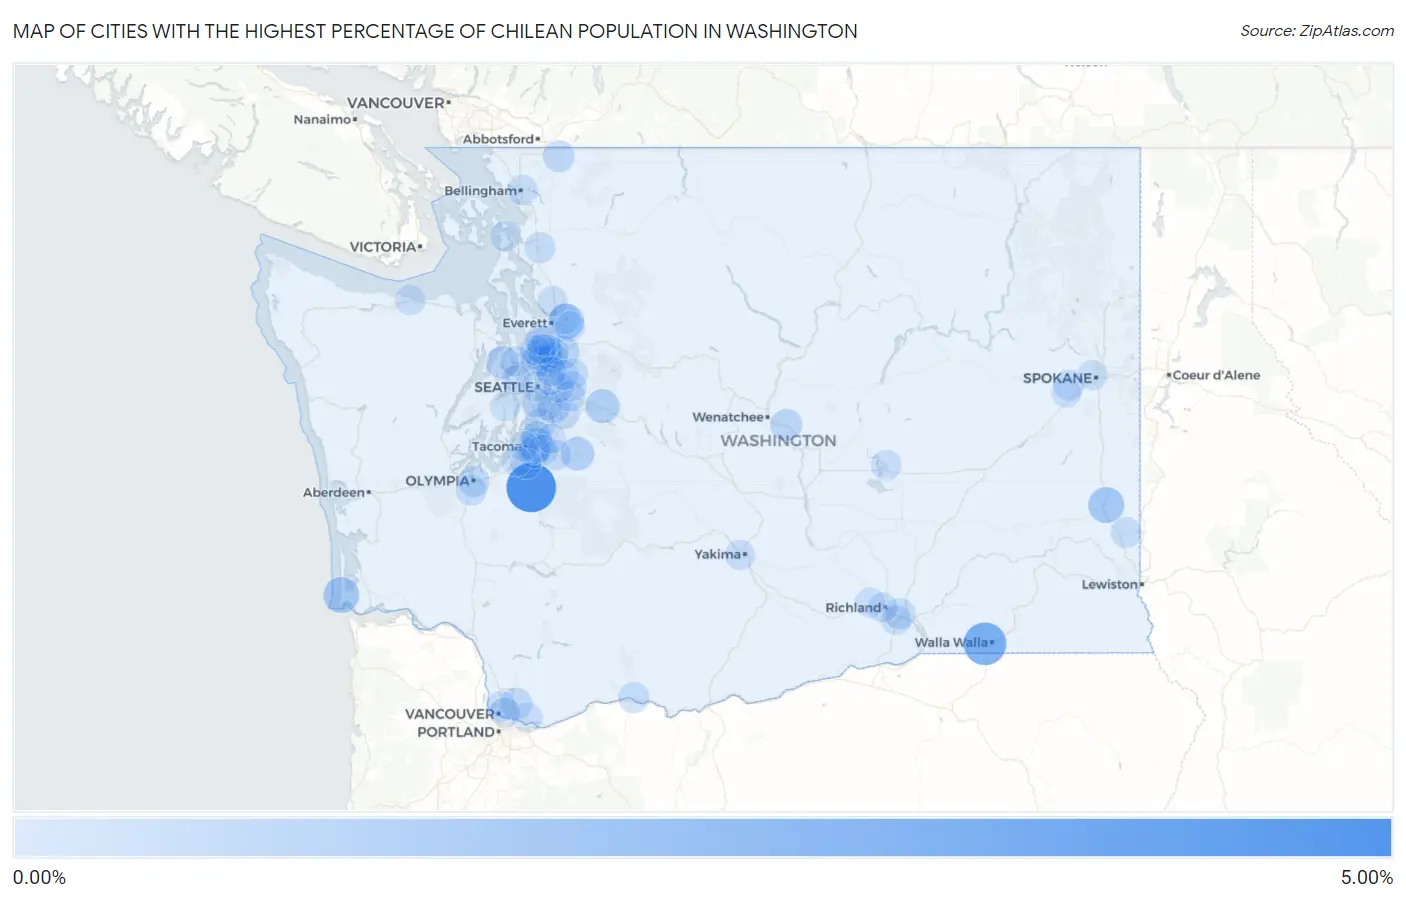
Map of Cities with the Highest Percentage of Chilean Population in Washington
0.00%
5.00%
Cities with the Highest Percentage of Chilean Population in Washington
| City | Chilean | vs State | vs National | |
| 1. | South Creek | 4.26% | 0.057%(+4.21)#1 | 0.055%(+4.21)#19 |
| 2. | Garrett | 2.72% | 0.057%(+2.67)#2 | 0.055%(+2.67)#40 |
| 3. | Colfax | 1.21% | 0.057%(+1.16)#3 | 0.055%(+1.16)#112 |
| 4. | Long Beach | 1.20% | 0.057%(+1.14)#4 | 0.055%(+1.15)#114 |
| 5. | Cavalero | 1.10% | 0.057%(+1.04)#5 | 0.055%(+1.04)#131 |
| 6. | Fife Heights | 0.89% | 0.057%(+0.833)#6 | 0.055%(+0.835)#179 |
| 7. | North Bend | 0.82% | 0.057%(+0.764)#7 | 0.055%(+0.766)#198 |
| 8. | Enumclaw | 0.74% | 0.057%(+0.687)#8 | 0.055%(+0.689)#222 |
| 9. | Alderwood Manor | 0.72% | 0.057%(+0.665)#9 | 0.055%(+0.667)#228 |
| 10. | Maltby | 0.68% | 0.057%(+0.622)#10 | 0.055%(+0.623)#246 |
| 11. | Poulsbo | 0.59% | 0.057%(+0.535)#11 | 0.055%(+0.537)#283 |
| 12. | Roche Harbor | 0.40% | 0.057%(+0.342)#12 | 0.055%(+0.343)#426 |
| 13. | Rock Island | 0.40% | 0.057%(+0.340)#13 | 0.055%(+0.342)#429 |
| 14. | Peaceful Valley | 0.37% | 0.057%(+0.311)#14 | 0.055%(+0.313)#469 |
| 15. | Orchards | 0.36% | 0.057%(+0.303)#15 | 0.055%(+0.304)#480 |
| 16. | Renton | 0.33% | 0.057%(+0.272)#16 | 0.055%(+0.273)#512 |
| 17. | Waller | 0.28% | 0.057%(+0.218)#17 | 0.055%(+0.220)#593 |
| 18. | Kenmore | 0.26% | 0.057%(+0.206)#18 | 0.055%(+0.207)#625 |
| 19. | Olympia | 0.26% | 0.057%(+0.201)#19 | 0.055%(+0.202)#639 |
| 20. | Mountlake Terrace | 0.23% | 0.057%(+0.177)#20 | 0.055%(+0.179)#684 |
| 21. | Shoreline | 0.22% | 0.057%(+0.165)#21 | 0.055%(+0.166)#713 |
| 22. | Union Hill Novelty Hill | 0.22% | 0.057%(+0.163)#22 | 0.055%(+0.165)#716 |
| 23. | Des Moines | 0.22% | 0.057%(+0.161)#23 | 0.055%(+0.162)#725 |
| 24. | White Salmon | 0.20% | 0.057%(+0.143)#24 | 0.055%(+0.144)#769 |
| 25. | Pasco | 0.19% | 0.057%(+0.133)#25 | 0.055%(+0.135)#800 |
| 26. | Mount Vernon | 0.18% | 0.057%(+0.125)#26 | 0.055%(+0.127)#827 |
| 27. | Tumwater | 0.18% | 0.057%(+0.123)#27 | 0.055%(+0.124)#835 |
| 28. | Maple Heights Lake Desire | 0.17% | 0.057%(+0.118)#28 | 0.055%(+0.119)#849 |
| 29. | Pullman | 0.16% | 0.057%(+0.103)#29 | 0.055%(+0.104)#900 |
| 30. | Fairchild Afb | 0.16% | 0.057%(+0.100)#30 | 0.055%(+0.102)#909 |
| 31. | Lake Forest Park | 0.16% | 0.057%(+0.099)#31 | 0.055%(+0.101)#911 |
| 32. | Bothell | 0.14% | 0.057%(+0.085)#32 | 0.055%(+0.087)#964 |
| 33. | Bothell East | 0.14% | 0.057%(+0.079)#33 | 0.055%(+0.081)#978 |
| 34. | Fife | 0.13% | 0.057%(+0.072)#34 | 0.055%(+0.073)#1,018 |
| 35. | Federal Way | 0.13% | 0.057%(+0.071)#35 | 0.055%(+0.072)#1,026 |
| 36. | Issaquah | 0.12% | 0.057%(+0.065)#36 | 0.055%(+0.067)#1,045 |
| 37. | Indianola | 0.11% | 0.057%(+0.056)#37 | 0.055%(+0.057)#1,096 |
| 38. | Lake Stickney | 0.11% | 0.057%(+0.052)#38 | 0.055%(+0.054)#1,109 |
| 39. | Hazel Dell | 0.11% | 0.057%(+0.049)#39 | 0.055%(+0.050)#1,132 |
| 40. | Bryn Mawr Skyway | 0.11% | 0.057%(+0.049)#40 | 0.055%(+0.050)#1,134 |
| 41. | Edgewood | 0.10% | 0.057%(+0.048)#41 | 0.055%(+0.050)#1,137 |
| 42. | Bellevue | 0.10% | 0.057%(+0.045)#42 | 0.055%(+0.047)#1,153 |
| 43. | Sammamish | 0.092% | 0.057%(+0.035)#43 | 0.055%(+0.036)#1,221 |
| 44. | Parkland | 0.091% | 0.057%(+0.035)#44 | 0.055%(+0.036)#1,224 |
| 45. | Camas | 0.091% | 0.057%(+0.034)#45 | 0.055%(+0.036)#1,230 |
| 46. | Port Angeles | 0.085% | 0.057%(+0.028)#46 | 0.055%(+0.030)#1,260 |
| 47. | Moses Lake | 0.083% | 0.057%(+0.027)#47 | 0.055%(+0.028)#1,272 |
| 48. | Seattle | 0.080% | 0.057%(+0.023)#48 | 0.055%(+0.025)#1,290 |
| 49. | Yarrow Point | 0.078% | 0.057%(+0.021)#49 | 0.055%(+0.023)#1,307 |
| 50. | Vancouver | 0.076% | 0.057%(+0.019)#50 | 0.055%(+0.021)#1,318 |
| 51. | Edmonds | 0.073% | 0.057%(+0.016)#51 | 0.055%(+0.017)#1,348 |
| 52. | Lake Stevens | 0.072% | 0.057%(+0.015)#52 | 0.055%(+0.017)#1,352 |
| 53. | Picnic Point | 0.070% | 0.057%(+0.014)#53 | 0.055%(+0.015)#1,363 |
| 54. | Yakima | 0.069% | 0.057%(+0.012)#54 | 0.055%(+0.014)#1,375 |
| 55. | Bellingham | 0.065% | 0.057%(+0.008)#55 | 0.055%(+0.009)#1,415 |
| 56. | Bonney Lake | 0.062% | 0.057%(+0.005)#56 | 0.055%(+0.007)#1,435 |
| 57. | Kirkland | 0.062% | 0.057%(+0.005)#57 | 0.055%(+0.007)#1,436 |
| 58. | Redmond | 0.054% | 0.057%(-0.003)#58 | 0.055%(-0.001)#1,517 |
| 59. | Bainbridge Island | 0.053% | 0.057%(-0.004)#59 | 0.055%(-0.002)#1,535 |
| 60. | Marysville | 0.052% | 0.057%(-0.005)#60 | 0.055%(-0.003)#1,541 |
| 61. | Kennewick | 0.043% | 0.057%(-0.014)#61 | 0.055%(-0.012)#1,623 |
| 62. | Medical Lake | 0.041% | 0.057%(-0.016)#62 | 0.055%(-0.014)#1,644 |
| 63. | Auburn | 0.036% | 0.057%(-0.021)#63 | 0.055%(-0.019)#1,678 |
| 64. | Tacoma | 0.035% | 0.057%(-0.022)#64 | 0.055%(-0.020)#1,692 |
| 65. | Everett | 0.032% | 0.057%(-0.024)#65 | 0.055%(-0.023)#1,713 |
| 66. | West Richland | 0.030% | 0.057%(-0.027)#66 | 0.055%(-0.025)#1,740 |
| 67. | Richland | 0.026% | 0.057%(-0.031)#67 | 0.055%(-0.029)#1,788 |
| 68. | Bethel | 0.024% | 0.057%(-0.033)#68 | 0.055%(-0.031)#1,816 |
| 69. | Lynnwood | 0.020% | 0.057%(-0.037)#69 | 0.055%(-0.035)#1,854 |
| 70. | Spokane | 0.020% | 0.057%(-0.037)#70 | 0.055%(-0.035)#1,857 |
| 71. | Anacortes | 0.017% | 0.057%(-0.040)#71 | 0.055%(-0.038)#1,879 |
| 72. | White Center | 0.013% | 0.057%(-0.044)#72 | 0.055%(-0.042)#1,916 |
| 73. | Lakewood | 0.0063% | 0.057%(-0.050)#73 | 0.055%(-0.049)#1,980 |
Common Questions
What are the Top 10 Cities with the Highest Percentage of Chilean Population in Washington?
Top 10 Cities with the Highest Percentage of Chilean Population in Washington are:
#1
4.26%
#2
2.72%
#3
1.21%
#4
1.20%
#5
1.10%
#6
0.89%
#7
0.82%
#8
0.74%
#9
0.72%
#10
0.68%
What city has the Highest Percentage of Chilean Population in Washington?
South Creek has the Highest Percentage of Chilean Population in Washington with 4.26%.
What is the Percentage of Chilean Population in the State of Washington?
Percentage of Chilean Population in Washington is 0.057%.
What is the Percentage of Chilean Population in the United States?
Percentage of Chilean Population in the United States is 0.055%.