Tracyton, WA Map & Demographics
Tracyton Map
Tracyton Overview
$44,677
PER CAPITA INCOME
$101,000
AVG FAMILY INCOME
$87,955
AVG HOUSEHOLD INCOME
30.5%
WAGE / INCOME GAP [ % ]
69.5¢/ $1
WAGE / INCOME GAP [ $ ]
0.46
INEQUALITY / GINI INDEX
5,614
TOTAL POPULATION
2,677
MALE POPULATION
2,937
FEMALE POPULATION
91.15
MALES / 100 FEMALES
109.71
FEMALES / 100 MALES
39.4
MEDIAN AGE
3.4
AVG FAMILY SIZE
2.8
AVG HOUSEHOLD SIZE
2,784
LABOR FORCE [ PEOPLE ]
61.5%
PERCENT IN LABOR FORCE
2.7%
UNEMPLOYMENT RATE
Tracyton Area Codes
Income in Tracyton
Income Overview in Tracyton
Per Capita Income in Tracyton is $44,677, while median incomes of families and households are $101,000 and $87,955 respectively.
| Characteristic | Number | Measure |
| Per Capita Income | 5,614 | $44,677 |
| Median Family Income | 1,304 | $101,000 |
| Mean Family Income | 1,304 | $120,642 |
| Median Household Income | 1,988 | $87,955 |
| Mean Household Income | 1,988 | $122,603 |
| Income Deficit | 1,304 | $0 |
| Wage / Income Gap (%) | 5,614 | 30.53% |
| Wage / Income Gap ($) | 5,614 | 69.47¢ per $1 |
| Gini / Inequality Index | 5,614 | 0.46 |
Earnings by Sex in Tracyton
Average Earnings in Tracyton are $43,500, $53,199 for men and $36,956 for women, a difference of 30.5%.
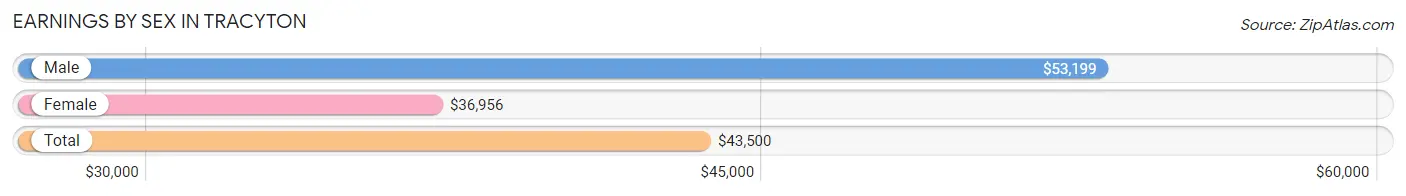
| Sex | Number | Average Earnings |
| Male | 1,445 (50.8%) | $53,199 |
| Female | 1,399 (49.2%) | $36,956 |
| Total | 2,844 (100.0%) | $43,500 |
Earnings by Sex by Income Bracket in Tracyton
The most common earnings brackets in Tracyton are $100,000+ for men (314 | 21.7%) and $75,000 to $99,999 for women (206 | 14.7%).
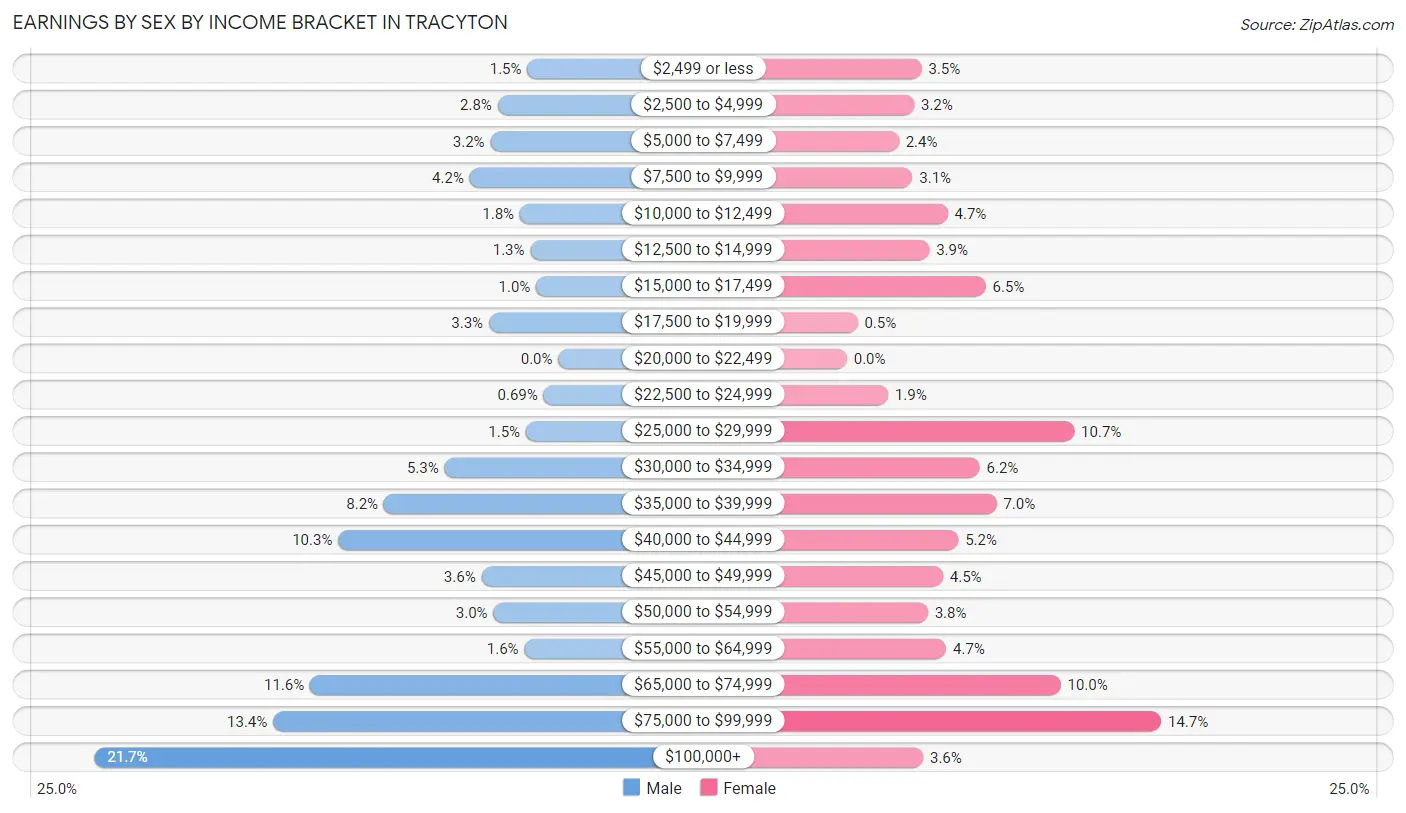
| Income | Male | Female |
| $2,499 or less | 21 (1.5%) | 49 (3.5%) |
| $2,500 to $4,999 | 41 (2.8%) | 44 (3.2%) |
| $5,000 to $7,499 | 46 (3.2%) | 34 (2.4%) |
| $7,500 to $9,999 | 60 (4.2%) | 43 (3.1%) |
| $10,000 to $12,499 | 26 (1.8%) | 66 (4.7%) |
| $12,500 to $14,999 | 19 (1.3%) | 54 (3.9%) |
| $15,000 to $17,499 | 15 (1.0%) | 91 (6.5%) |
| $17,500 to $19,999 | 47 (3.3%) | 7 (0.5%) |
| $20,000 to $22,499 | 0 (0.0%) | 0 (0.0%) |
| $22,500 to $24,999 | 10 (0.7%) | 27 (1.9%) |
| $25,000 to $29,999 | 22 (1.5%) | 149 (10.6%) |
| $30,000 to $34,999 | 77 (5.3%) | 87 (6.2%) |
| $35,000 to $39,999 | 118 (8.2%) | 98 (7.0%) |
| $40,000 to $44,999 | 149 (10.3%) | 73 (5.2%) |
| $45,000 to $49,999 | 52 (3.6%) | 63 (4.5%) |
| $50,000 to $54,999 | 44 (3.0%) | 53 (3.8%) |
| $55,000 to $64,999 | 23 (1.6%) | 65 (4.6%) |
| $65,000 to $74,999 | 168 (11.6%) | 140 (10.0%) |
| $75,000 to $99,999 | 193 (13.4%) | 206 (14.7%) |
| $100,000+ | 314 (21.7%) | 50 (3.6%) |
| Total | 1,445 (100.0%) | 1,399 (100.0%) |
Earnings by Sex by Educational Attainment in Tracyton
Average earnings in Tracyton are $66,196 for men and $45,765 for women, a difference of 30.9%. Men with an educational attainment of bachelor's degree enjoy the highest average annual earnings of $116,389, while those with high school diploma education earn the least with $39,850. Women with an educational attainment of graduate degree earn the most with the average annual earnings of $60,250, while those with less than high school education have the smallest earnings of $12,054.
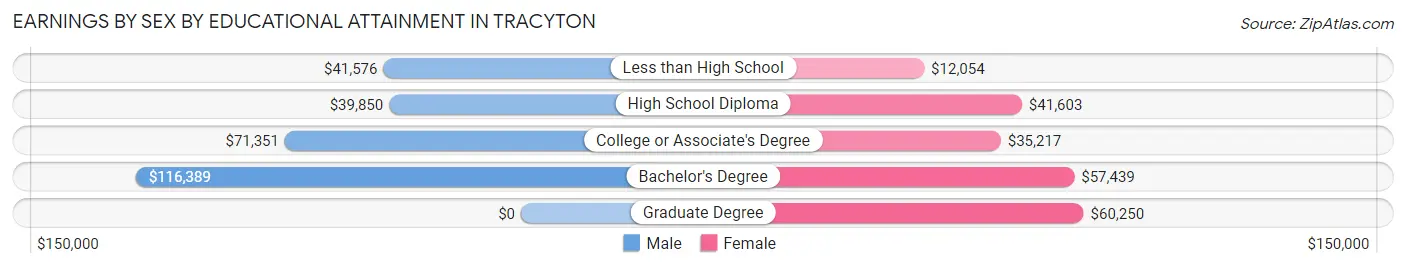
| Educational Attainment | Male Income | Female Income |
| Less than High School | $41,576 | $12,054 |
| High School Diploma | $39,850 | $41,603 |
| College or Associate's Degree | $71,351 | $35,217 |
| Bachelor's Degree | $116,389 | $57,439 |
| Graduate Degree | - | - |
| Total | $66,196 | $45,765 |
Family Income in Tracyton
Family Income Brackets in Tracyton
According to the Tracyton family income data, there are 334 families falling into the $100,000 to $149,999 income range, which is the most common income bracket and makes up 25.6% of all families. Conversely, the $25,000 to $34,999 income bracket is the least frequent group with only 8 families (0.6%) belonging to this category.
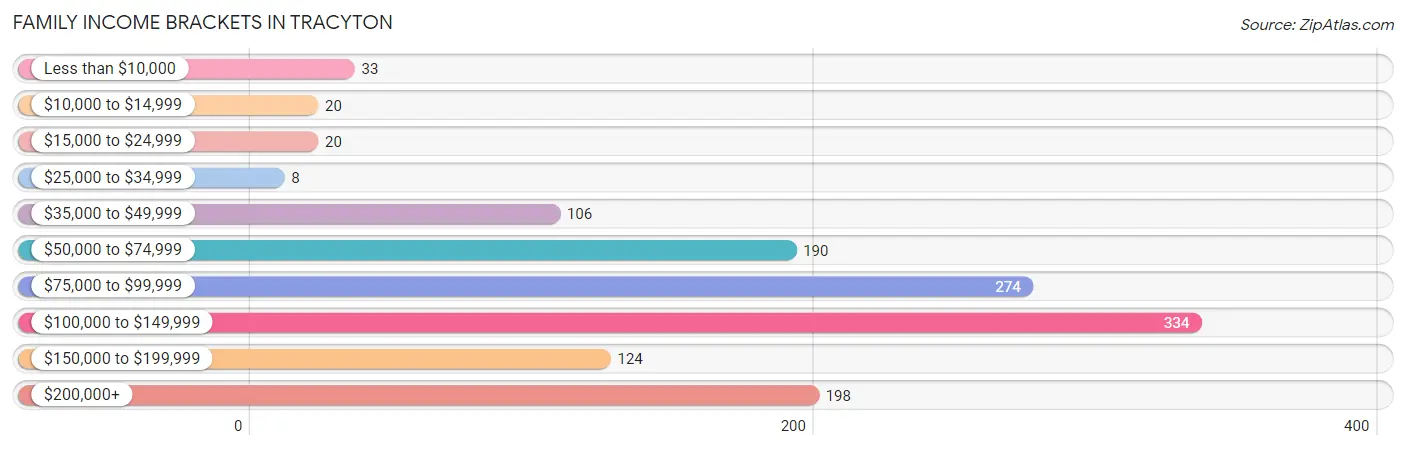
| Income Bracket | # Families | % Families |
| Less than $10,000 | 33 | 2.5% |
| $10,000 to $14,999 | 20 | 1.5% |
| $15,000 to $24,999 | 20 | 1.5% |
| $25,000 to $34,999 | 8 | 0.6% |
| $35,000 to $49,999 | 106 | 8.1% |
| $50,000 to $74,999 | 190 | 14.6% |
| $75,000 to $99,999 | 274 | 21.0% |
| $100,000 to $149,999 | 334 | 25.6% |
| $150,000 to $199,999 | 124 | 9.5% |
| $200,000+ | 198 | 15.2% |
Family Income by Famaliy Size in Tracyton
7+ person families (120 | 9.2%) account for the highest median family income in Tracyton with $203,048 per family, while 2-person families (551 | 42.2%) have the highest median income of $40,175 per family member.
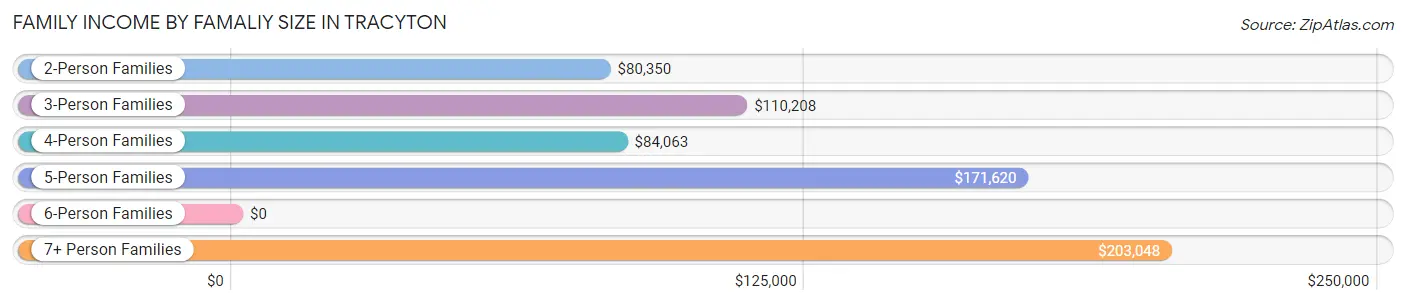
| Income Bracket | # Families | Median Income |
| 2-Person Families | 551 (42.2%) | $80,350 |
| 3-Person Families | 258 (19.8%) | $110,208 |
| 4-Person Families | 166 (12.7%) | $84,063 |
| 5-Person Families | 179 (13.7%) | $171,620 |
| 6-Person Families | 30 (2.3%) | $0 |
| 7+ Person Families | 120 (9.2%) | $203,048 |
| Total | 1,304 (100.0%) | $101,000 |
Family Income by Number of Earners in Tracyton
The median family income in Tracyton is $101,000, with families comprising 2 earners (595) having the highest median family income of $120,268, while families with no earners (253) have the lowest median family income of $75,625, accounting for 45.6% and 19.4% of families, respectively.
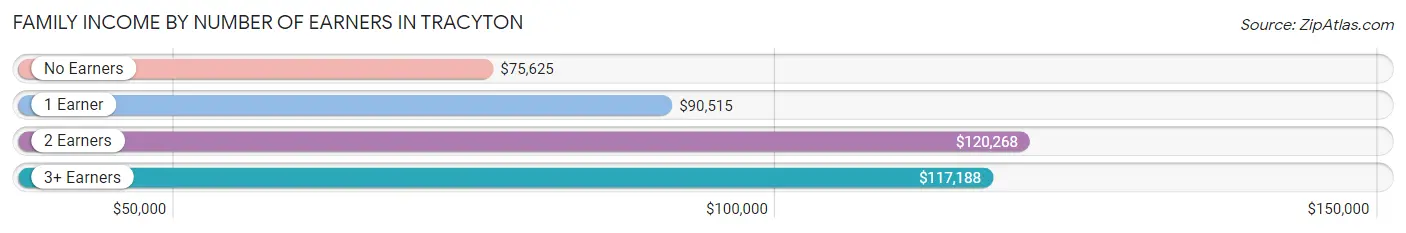
| Number of Earners | # Families | Median Income |
| No Earners | 253 (19.4%) | $75,625 |
| 1 Earner | 299 (22.9%) | $90,515 |
| 2 Earners | 595 (45.6%) | $120,268 |
| 3+ Earners | 157 (12.0%) | $117,188 |
| Total | 1,304 (100.0%) | $101,000 |
Household Income in Tracyton
Household Income Brackets in Tracyton
With 491 households falling in the category, the $100,000 to $149,999 income range is the most frequent in Tracyton, accounting for 24.7% of all households. In contrast, only 30 households (1.5%) fall into the $10,000 to $14,999 income bracket, making it the least populous group.
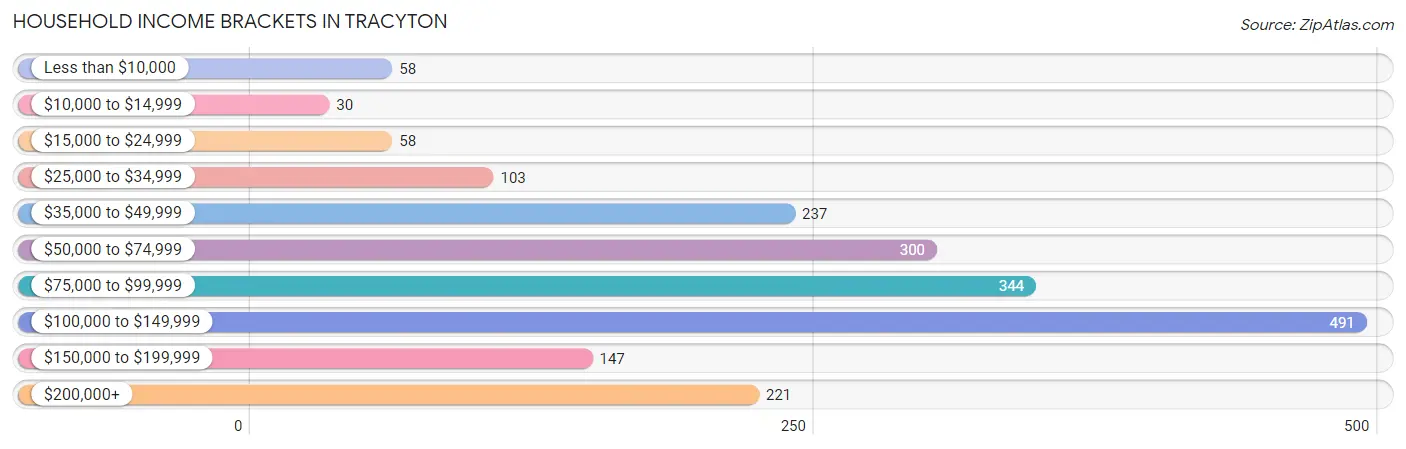
| Income Bracket | # Households | % Households |
| Less than $10,000 | 58 | 2.9% |
| $10,000 to $14,999 | 30 | 1.5% |
| $15,000 to $24,999 | 58 | 2.9% |
| $25,000 to $34,999 | 103 | 5.2% |
| $35,000 to $49,999 | 237 | 11.9% |
| $50,000 to $74,999 | 300 | 15.1% |
| $75,000 to $99,999 | 344 | 17.3% |
| $100,000 to $149,999 | 491 | 24.7% |
| $150,000 to $199,999 | 147 | 7.4% |
| $200,000+ | 221 | 11.1% |
Household Income by Householder Age in Tracyton
The median household income in Tracyton is $87,955, with the highest median household income of $108,864 found in the 25 to 44 years age bracket for the primary householder. A total of 604 households (30.4%) fall into this category. Meanwhile, the 15 to 24 years age bracket for the primary householder has the lowest median household income of $58,142, with 93 households (4.7%) in this group.
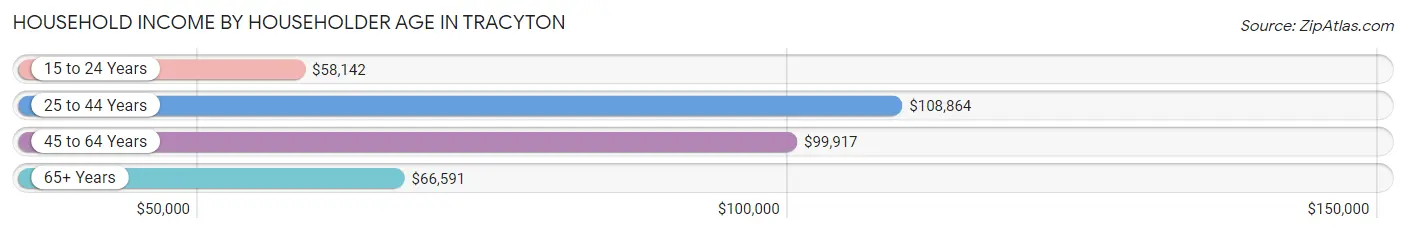
| Income Bracket | # Households | Median Income |
| 15 to 24 Years | 93 (4.7%) | $58,142 |
| 25 to 44 Years | 604 (30.4%) | $108,864 |
| 45 to 64 Years | 653 (32.9%) | $99,917 |
| 65+ Years | 638 (32.1%) | $66,591 |
| Total | 1,988 (100.0%) | $87,955 |
Poverty in Tracyton
Income Below Poverty by Sex and Age in Tracyton
With 4.3% poverty level for males and 7.8% for females among the residents of Tracyton, 5 year old males and under 5 year old females are the most vulnerable to poverty, with 9 males (21.4%) and 22 females (32.8%) in their respective age groups living below the poverty level.
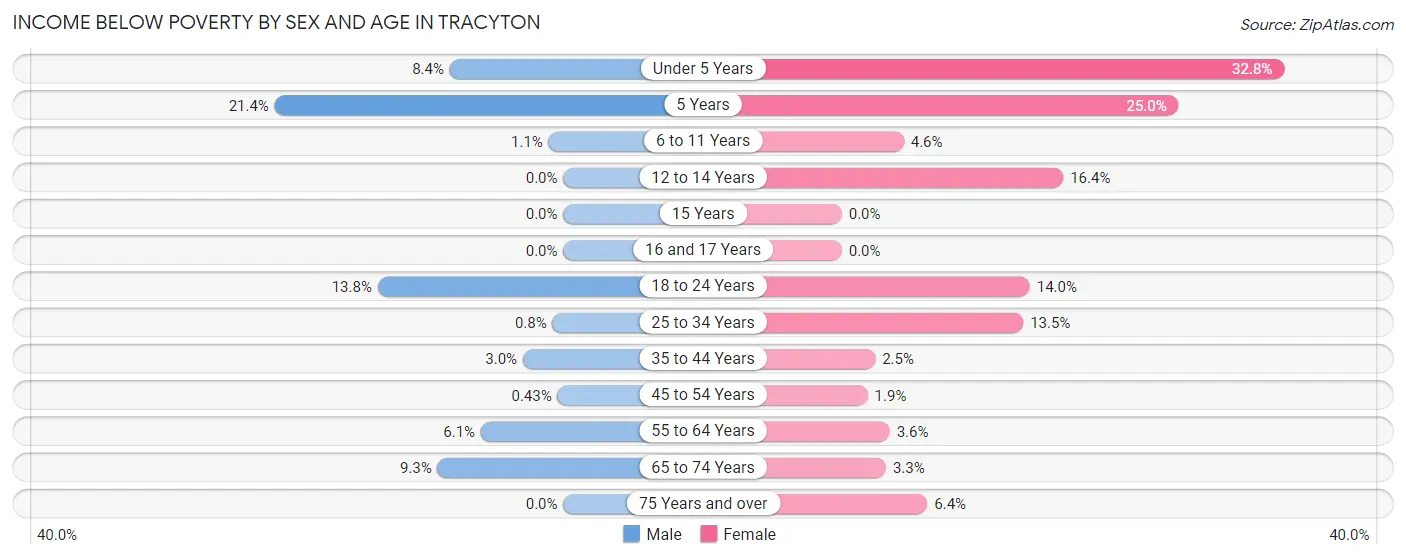
| Age Bracket | Male | Female |
| Under 5 Years | 15 (8.4%) | 22 (32.8%) |
| 5 Years | 9 (21.4%) | 9 (25.0%) |
| 6 to 11 Years | 3 (1.1%) | 12 (4.6%) |
| 12 to 14 Years | 0 (0.0%) | 12 (16.4%) |
| 15 Years | 0 (0.0%) | 0 (0.0%) |
| 16 and 17 Years | 0 (0.0%) | 0 (0.0%) |
| 18 to 24 Years | 31 (13.8%) | 55 (14.0%) |
| 25 to 34 Years | 4 (0.8%) | 54 (13.5%) |
| 35 to 44 Years | 12 (3.0%) | 8 (2.5%) |
| 45 to 54 Years | 1 (0.4%) | 4 (1.9%) |
| 55 to 64 Years | 15 (6.1%) | 16 (3.6%) |
| 65 to 74 Years | 24 (9.3%) | 9 (3.3%) |
| 75 Years and over | 0 (0.0%) | 27 (6.4%) |
| Total | 114 (4.3%) | 228 (7.8%) |
Income Above Poverty by Sex and Age in Tracyton
According to the poverty statistics in Tracyton, males aged 12 to 14 years and females aged 15 years are the age groups that are most secure financially, with 100.0% of males and 100.0% of females in these age groups living above the poverty line.
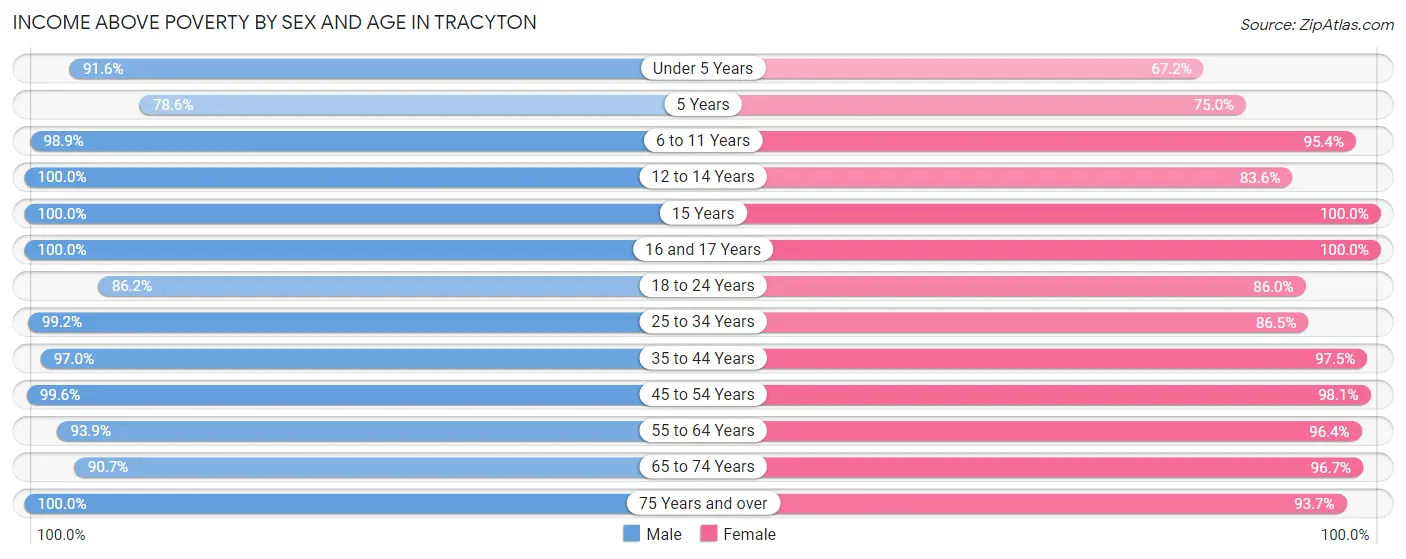
| Age Bracket | Male | Female |
| Under 5 Years | 163 (91.6%) | 45 (67.2%) |
| 5 Years | 33 (78.6%) | 27 (75.0%) |
| 6 to 11 Years | 272 (98.9%) | 249 (95.4%) |
| 12 to 14 Years | 92 (100.0%) | 61 (83.6%) |
| 15 Years | 50 (100.0%) | 3 (100.0%) |
| 16 and 17 Years | 42 (100.0%) | 12 (100.0%) |
| 18 to 24 Years | 194 (86.2%) | 339 (86.0%) |
| 25 to 34 Years | 496 (99.2%) | 347 (86.5%) |
| 35 to 44 Years | 388 (97.0%) | 315 (97.5%) |
| 45 to 54 Years | 234 (99.6%) | 204 (98.1%) |
| 55 to 64 Years | 230 (93.9%) | 434 (96.4%) |
| 65 to 74 Years | 233 (90.7%) | 265 (96.7%) |
| 75 Years and over | 136 (100.0%) | 398 (93.6%) |
| Total | 2,563 (95.7%) | 2,699 (92.2%) |
Income Below Poverty Among Married-Couple Families in Tracyton
The poverty statistics for married-couple families in Tracyton show that 0.8% or 8 of the total 1,012 families live below the poverty line. Families with no children have the highest poverty rate of 1.4%, comprising of 8 families. On the other hand, families with 1 or 2 children have the lowest poverty rate of 0.0%, which includes 0 families.
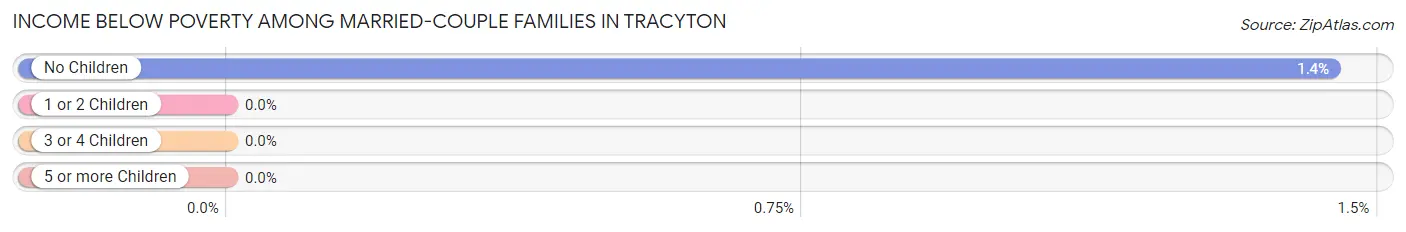
| Children | Above Poverty | Below Poverty |
| No Children | 549 (98.6%) | 8 (1.4%) |
| 1 or 2 Children | 292 (100.0%) | 0 (0.0%) |
| 3 or 4 Children | 148 (100.0%) | 0 (0.0%) |
| 5 or more Children | 15 (100.0%) | 0 (0.0%) |
| Total | 1,004 (99.2%) | 8 (0.8%) |
Income Below Poverty Among Single-Parent Households in Tracyton
According to the poverty data in Tracyton, 32.2% or 19 single-father households and 10.3% or 24 single-mother households are living below the poverty line. Among single-father households, those with 1 or 2 children have the highest poverty rate, with 12 households (33.3%) experiencing poverty. Likewise, among single-mother households, those with 5 or more children have the highest poverty rate, with 11 households (100.0%) falling below the poverty line.
| Children | Single Father | Single Mother |
| No Children | 7 (30.4%) | 0 (0.0%) |
| 1 or 2 Children | 12 (33.3%) | 13 (12.9%) |
| 3 or 4 Children | 0 (0.0%) | 0 (0.0%) |
| 5 or more Children | 0 (0.0%) | 11 (100.0%) |
| Total | 19 (32.2%) | 24 (10.3%) |
Income Below Poverty Among Married-Couple vs Single-Parent Households in Tracyton
The poverty data for Tracyton shows that 8 of the married-couple family households (0.8%) and 43 of the single-parent households (14.7%) are living below the poverty level. Within the married-couple family households, those with no children have the highest poverty rate, with 8 households (1.4%) falling below the poverty line. Among the single-parent households, those with 5 or more children have the highest poverty rate, with 11 household (100.0%) living below poverty.
| Children | Married-Couple Families | Single-Parent Households |
| No Children | 8 (1.4%) | 7 (5.0%) |
| 1 or 2 Children | 0 (0.0%) | 25 (18.2%) |
| 3 or 4 Children | 0 (0.0%) | 0 (0.0%) |
| 5 or more Children | 0 (0.0%) | 11 (100.0%) |
| Total | 8 (0.8%) | 43 (14.7%) |
Race in Tracyton
The most populous races in Tracyton are White / Caucasian (3,534 | 62.9%), Asian (964 | 17.2%), and Hispanic or Latino (584 | 10.4%).
| Race | # Population | % Population |
| Asian | 964 | 17.2% |
| Black / African American | 207 | 3.7% |
| Hawaiian / Pacific | 83 | 1.5% |
| Hispanic or Latino | 584 | 10.4% |
| Native / Alaskan | 16 | 0.3% |
| White / Caucasian | 3,534 | 62.9% |
| Two or more Races | 559 | 10.0% |
| Some other Race | 251 | 4.5% |
| Total | 5,614 | 100.0% |
Ancestry in Tracyton
The most populous ancestries reported in Tracyton are English (743 | 13.2%), German (734 | 13.1%), Irish (473 | 8.4%), Korean (442 | 7.9%), and Sri Lankan (437 | 7.8%), together accounting for 50.4% of all Tracyton residents.
| Ancestry | # Population | % Population |
| African | 72 | 1.3% |
| Alaska Native | 6 | 0.1% |
| Aleut | 7 | 0.1% |
| American | 276 | 4.9% |
| Bhutanese | 126 | 2.2% |
| Burmese | 21 | 0.4% |
| Central American | 14 | 0.3% |
| Cherokee | 102 | 1.8% |
| Choctaw | 7 | 0.1% |
| Czech | 9 | 0.2% |
| Danish | 8 | 0.1% |
| Dutch | 27 | 0.5% |
| English | 743 | 13.2% |
| European | 72 | 1.3% |
| Finnish | 22 | 0.4% |
| French | 212 | 3.8% |
| French American Indian | 7 | 0.1% |
| French Canadian | 68 | 1.2% |
| German | 734 | 13.1% |
| Guamanian / Chamorro | 84 | 1.5% |
| Hungarian | 4 | 0.1% |
| Indian (Asian) | 65 | 1.2% |
| Inupiat | 6 | 0.1% |
| Irish | 473 | 8.4% |
| Italian | 89 | 1.6% |
| Korean | 442 | 7.9% |
| Mexican | 342 | 6.1% |
| Mexican American Indian | 52 | 0.9% |
| Native Hawaiian | 67 | 1.2% |
| Nigerian | 3 | 0.1% |
| Norwegian | 293 | 5.2% |
| Pakistani | 33 | 0.6% |
| Polish | 99 | 1.8% |
| Portuguese | 23 | 0.4% |
| Russian | 34 | 0.6% |
| Salvadoran | 14 | 0.3% |
| Samoan | 9 | 0.2% |
| Scandinavian | 12 | 0.2% |
| Scotch-Irish | 152 | 2.7% |
| Scottish | 202 | 3.6% |
| Slavic | 9 | 0.2% |
| Slovak | 8 | 0.1% |
| Spanish | 11 | 0.2% |
| Sri Lankan | 437 | 7.8% |
| Subsaharan African | 75 | 1.3% |
| Swedish | 41 | 0.7% |
| Swiss | 15 | 0.3% |
| Thai | 44 | 0.8% |
| Turkish | 6 | 0.1% |
| Welsh | 101 | 1.8% | View All 50 Rows |
Immigrants in Tracyton
The most numerous immigrant groups reported in Tracyton came from Asia (683 | 12.2%), South Eastern Asia (527 | 9.4%), Vietnam (325 | 5.8%), Philippines (186 | 3.3%), and Central America (146 | 2.6%), together accounting for 33.3% of all Tracyton residents.
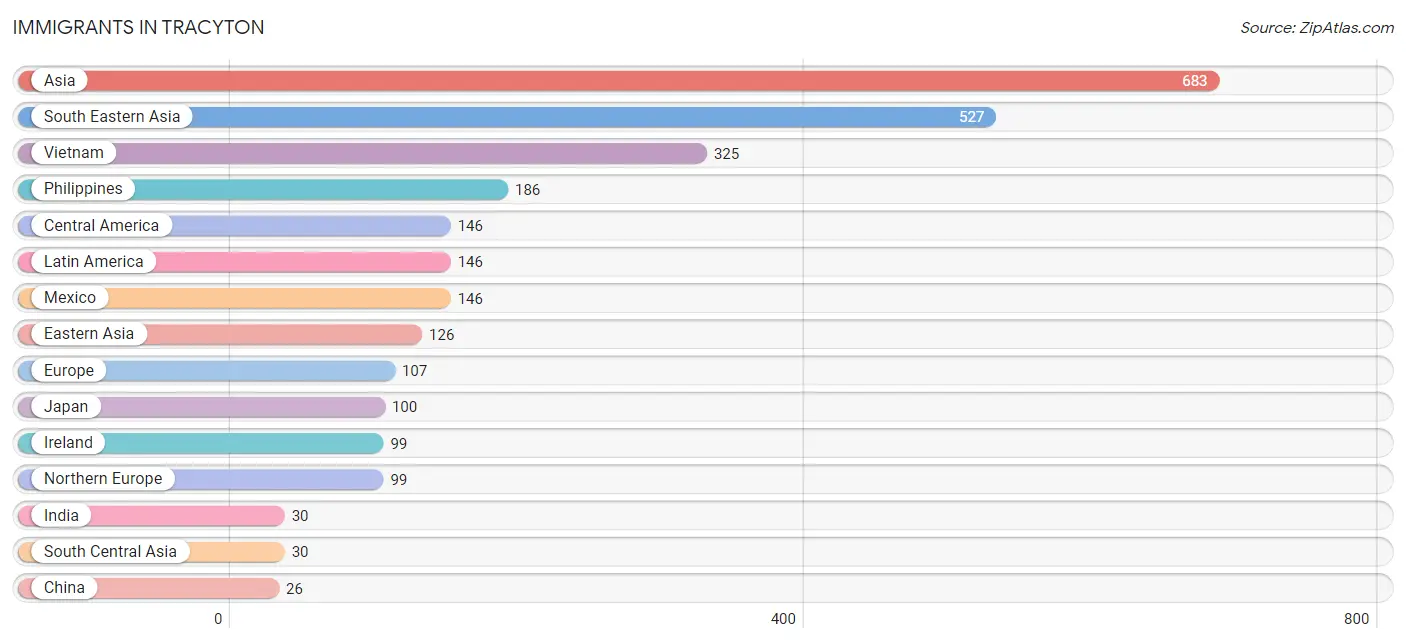
| Immigration Origin | # Population | % Population |
| Asia | 683 | 12.2% |
| Australia | 9 | 0.2% |
| Central America | 146 | 2.6% |
| China | 26 | 0.5% |
| Eastern Asia | 126 | 2.2% |
| Europe | 107 | 1.9% |
| France | 8 | 0.1% |
| Hong Kong | 3 | 0.1% |
| India | 30 | 0.5% |
| Ireland | 99 | 1.8% |
| Japan | 100 | 1.8% |
| Latin America | 146 | 2.6% |
| Mexico | 146 | 2.6% |
| Northern Europe | 99 | 1.8% |
| Oceania | 11 | 0.2% |
| Philippines | 186 | 3.3% |
| South Central Asia | 30 | 0.5% |
| South Eastern Asia | 527 | 9.4% |
| Thailand | 16 | 0.3% |
| Vietnam | 325 | 5.8% |
| Western Europe | 8 | 0.1% | View All 21 Rows |
Sex and Age in Tracyton
Sex and Age in Tracyton
The most populous age groups in Tracyton are 25 to 29 Years (317 | 11.8%) for men and 55 to 59 Years (290 | 9.9%) for women.
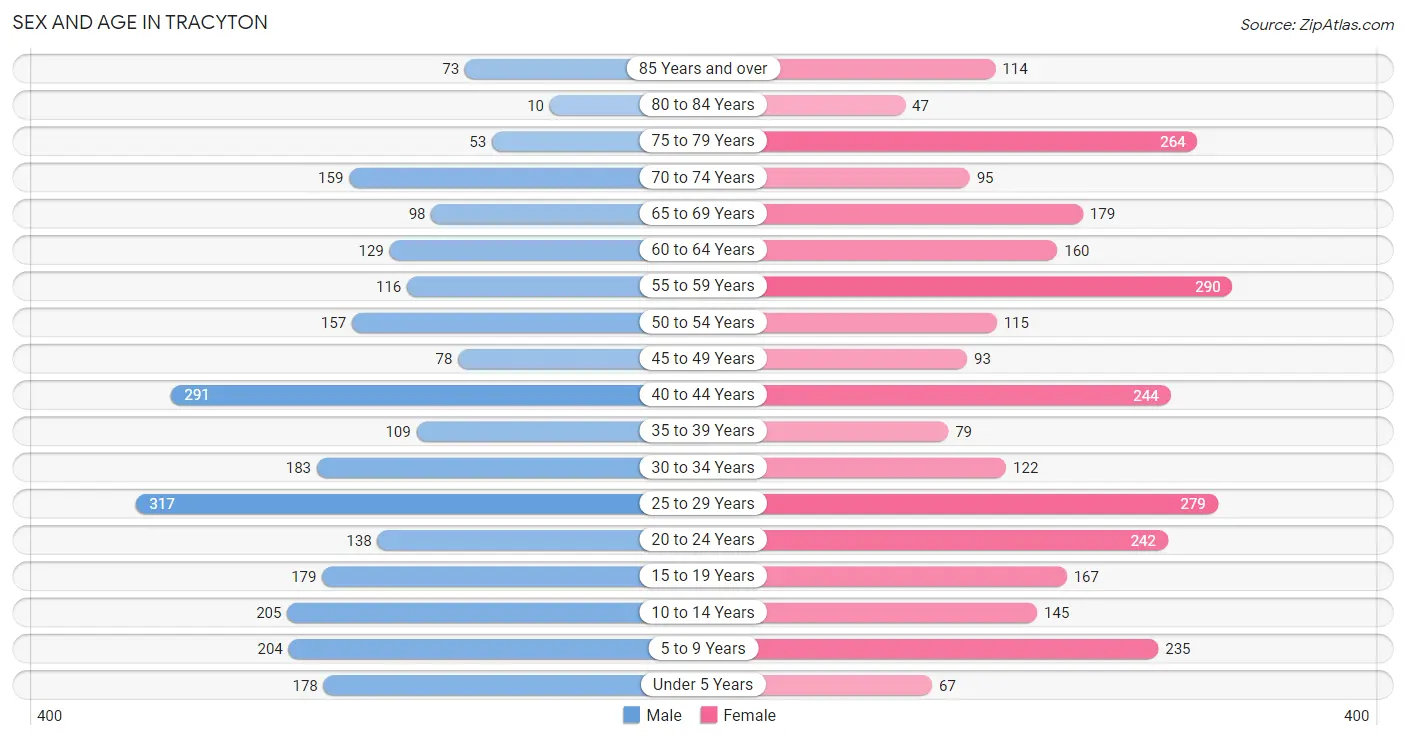
| Age Bracket | Male | Female |
| Under 5 Years | 178 (6.7%) | 67 (2.3%) |
| 5 to 9 Years | 204 (7.6%) | 235 (8.0%) |
| 10 to 14 Years | 205 (7.7%) | 145 (4.9%) |
| 15 to 19 Years | 179 (6.7%) | 167 (5.7%) |
| 20 to 24 Years | 138 (5.2%) | 242 (8.2%) |
| 25 to 29 Years | 317 (11.8%) | 279 (9.5%) |
| 30 to 34 Years | 183 (6.8%) | 122 (4.2%) |
| 35 to 39 Years | 109 (4.1%) | 79 (2.7%) |
| 40 to 44 Years | 291 (10.9%) | 244 (8.3%) |
| 45 to 49 Years | 78 (2.9%) | 93 (3.2%) |
| 50 to 54 Years | 157 (5.9%) | 115 (3.9%) |
| 55 to 59 Years | 116 (4.3%) | 290 (9.9%) |
| 60 to 64 Years | 129 (4.8%) | 160 (5.4%) |
| 65 to 69 Years | 98 (3.7%) | 179 (6.1%) |
| 70 to 74 Years | 159 (5.9%) | 95 (3.2%) |
| 75 to 79 Years | 53 (2.0%) | 264 (9.0%) |
| 80 to 84 Years | 10 (0.4%) | 47 (1.6%) |
| 85 Years and over | 73 (2.7%) | 114 (3.9%) |
| Total | 2,677 (100.0%) | 2,937 (100.0%) |
Families and Households in Tracyton
Median Family Size in Tracyton
The median family size in Tracyton is 3.40 persons per family, with married-couple families (1,012 | 77.6%) accounting for the largest median family size of 3.53 persons per family. On the other hand, single male/father families (59 | 4.5%) represent the smallest median family size with 2.46 persons per family.
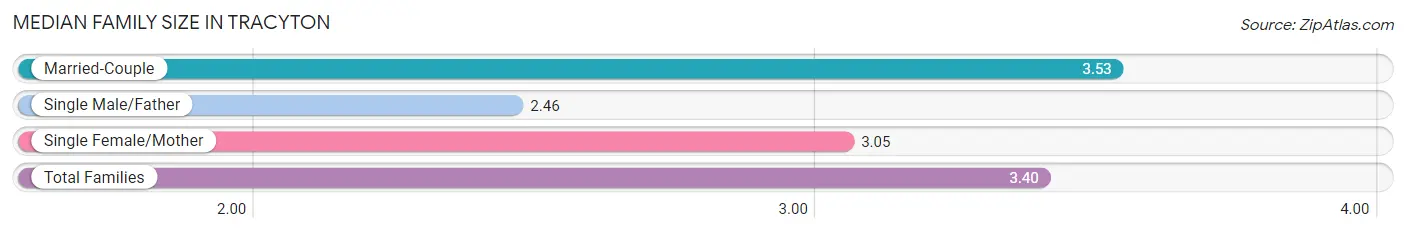
| Family Type | # Families | Family Size |
| Married-Couple | 1,012 (77.6%) | 3.53 |
| Single Male/Father | 59 (4.5%) | 2.46 |
| Single Female/Mother | 233 (17.9%) | 3.05 |
| Total Families | 1,304 (100.0%) | 3.40 |
Median Household Size in Tracyton
The median household size in Tracyton is 2.82 persons per household, with married-couple households (1,012 | 50.9%) accounting for the largest median household size of 3.69 persons per household. non-family households (684 | 34.4%) represent the smallest median household size with 1.35 persons per household.
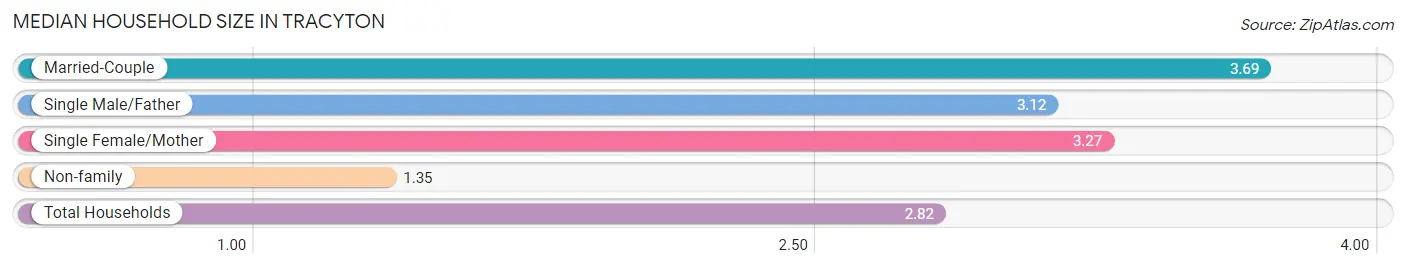
| Household Type | # Households | Household Size |
| Married-Couple | 1,012 (50.9%) | 3.69 |
| Single Male/Father | 59 (3.0%) | 3.12 |
| Single Female/Mother | 233 (11.7%) | 3.27 |
| Non-family | 684 (34.4%) | 1.35 |
| Total Households | 1,988 (100.0%) | 2.82 |
Household Size by Marriage Status in Tracyton
Out of a total of 1,988 households in Tracyton, 1,304 (65.6%) are family households, while 684 (34.4%) are nonfamily households. The most numerous type of family households are 2-person households, comprising 485, and the most common type of nonfamily households are 1-person households, comprising 501.
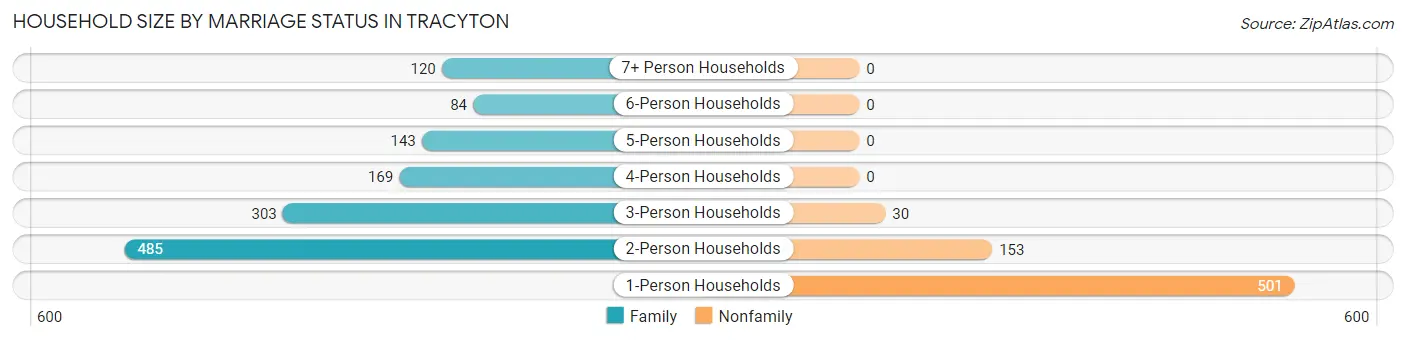
| Household Size | Family Households | Nonfamily Households |
| 1-Person Households | - | 501 (25.2%) |
| 2-Person Households | 485 (24.4%) | 153 (7.7%) |
| 3-Person Households | 303 (15.2%) | 30 (1.5%) |
| 4-Person Households | 169 (8.5%) | 0 (0.0%) |
| 5-Person Households | 143 (7.2%) | 0 (0.0%) |
| 6-Person Households | 84 (4.2%) | 0 (0.0%) |
| 7+ Person Households | 120 (6.0%) | 0 (0.0%) |
| Total | 1,304 (65.6%) | 684 (34.4%) |
Female Fertility in Tracyton
Fertility by Age in Tracyton
Average fertility rate in Tracyton is 40.0 births per 1,000 women. Women in the age bracket of 20 to 34 years have the highest fertility rate with 76.0 births per 1,000 women. Women in the age bracket of 20 to 34 years acount for 100.0% of all women with births.
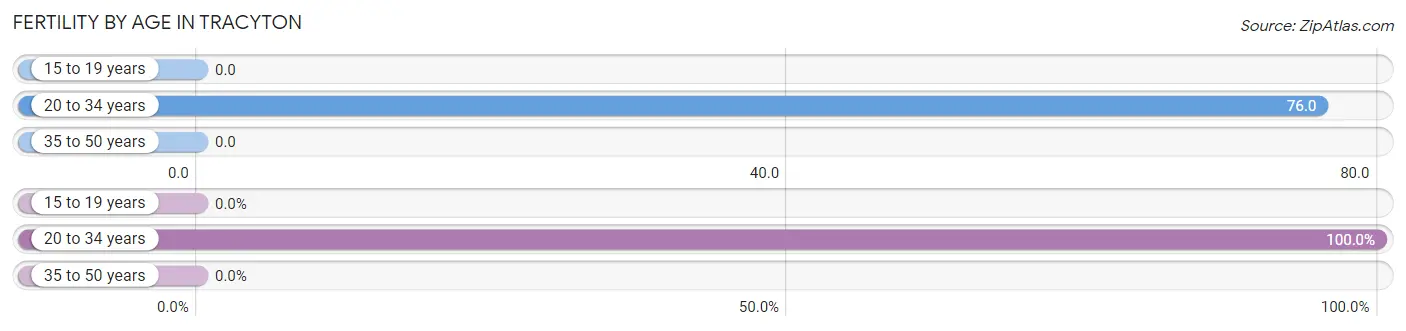
| Age Bracket | Women with Births | Births / 1,000 Women |
| 15 to 19 years | 0 (0.0%) | 0.0 |
| 20 to 34 years | 49 (100.0%) | 76.0 |
| 35 to 50 years | 0 (0.0%) | 0.0 |
| Total | 49 (100.0%) | 40.0 |
Fertility by Age by Marriage Status in Tracyton
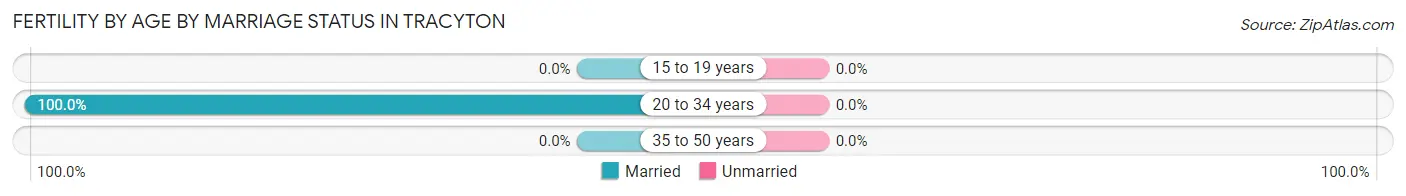
| Age Bracket | Married | Unmarried |
| 15 to 19 years | 0 (0.0%) | 0 (0.0%) |
| 20 to 34 years | 49 (100.0%) | 0 (0.0%) |
| 35 to 50 years | 0 (0.0%) | 0 (0.0%) |
| Total | 49 (100.0%) | 0 (0.0%) |
Fertility by Education in Tracyton
| Educational Attainment | Women with Births | Births / 1,000 Women |
| Less than High School | 0 (0.0%) | 0.0 |
| High School Diploma | 15 (30.6%) | 58.0 |
| College or Associate's Degree | 27 (55.1%) | 53.0 |
| Bachelor's Degree | 7 (14.3%) | 23.0 |
| Graduate Degree | 0 (0.0%) | 0.0 |
| Total | 49 (100.0%) | 40.0 |
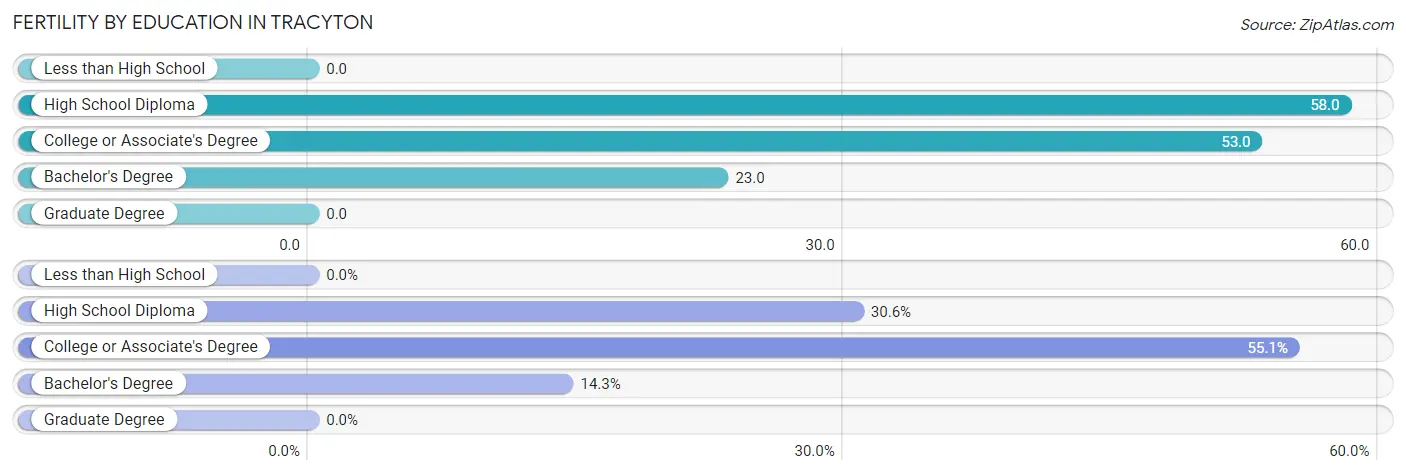
Fertility by Education by Marriage Status in Tracyton
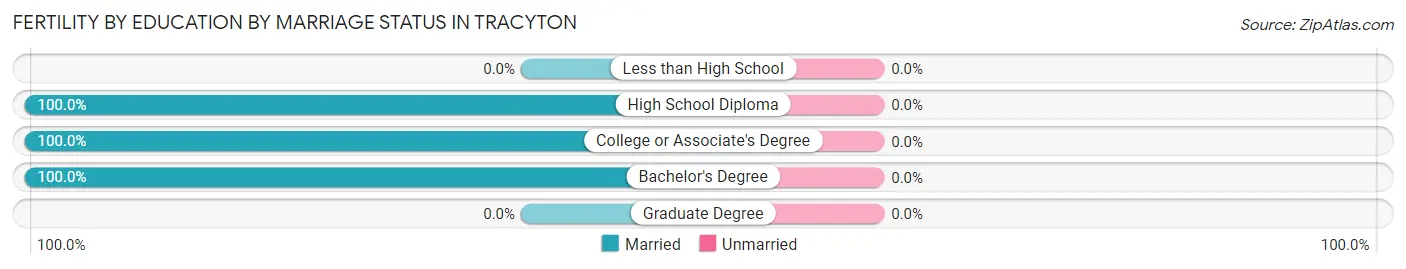
| Educational Attainment | Married | Unmarried |
| Less than High School | 0 (0.0%) | 0 (0.0%) |
| High School Diploma | 15 (100.0%) | 0 (0.0%) |
| College or Associate's Degree | 27 (100.0%) | 0 (0.0%) |
| Bachelor's Degree | 7 (100.0%) | 0 (0.0%) |
| Graduate Degree | 0 (0.0%) | 0 (0.0%) |
| Total | 49 (100.0%) | 0 (0.0%) |
Employment Characteristics in Tracyton
Employment by Class of Employer in Tracyton
Among the 2,632 employed individuals in Tracyton, private company employees (1,275 | 48.4%), federal government employees (713 | 27.1%), and not-for-profit organizations (314 | 11.9%) make up the most common classes of employment.
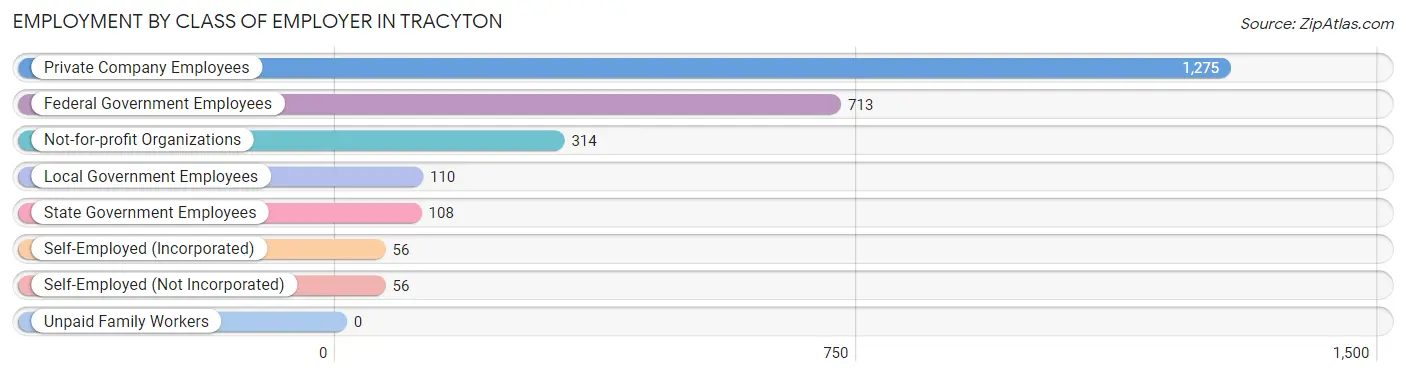
| Employer Class | # Employees | % Employees |
| Private Company Employees | 1,275 | 48.4% |
| Self-Employed (Incorporated) | 56 | 2.1% |
| Self-Employed (Not Incorporated) | 56 | 2.1% |
| Not-for-profit Organizations | 314 | 11.9% |
| Local Government Employees | 110 | 4.2% |
| State Government Employees | 108 | 4.1% |
| Federal Government Employees | 713 | 27.1% |
| Unpaid Family Workers | 0 | 0.0% |
| Total | 2,632 | 100.0% |
Employment Status by Age in Tracyton
According to the labor force statistics for Tracyton, out of the total population over 16 years of age (4,527), 61.5% or 2,784 individuals are in the labor force, with 2.7% or 75 of them unemployed. The age group with the highest labor force participation rate is 20 to 24 years, with 93.9% or 357 individuals in the labor force. Within the labor force, the 16 to 19 years age range has the highest percentage of unemployed individuals, with 20.2% or 22 of them being unemployed.
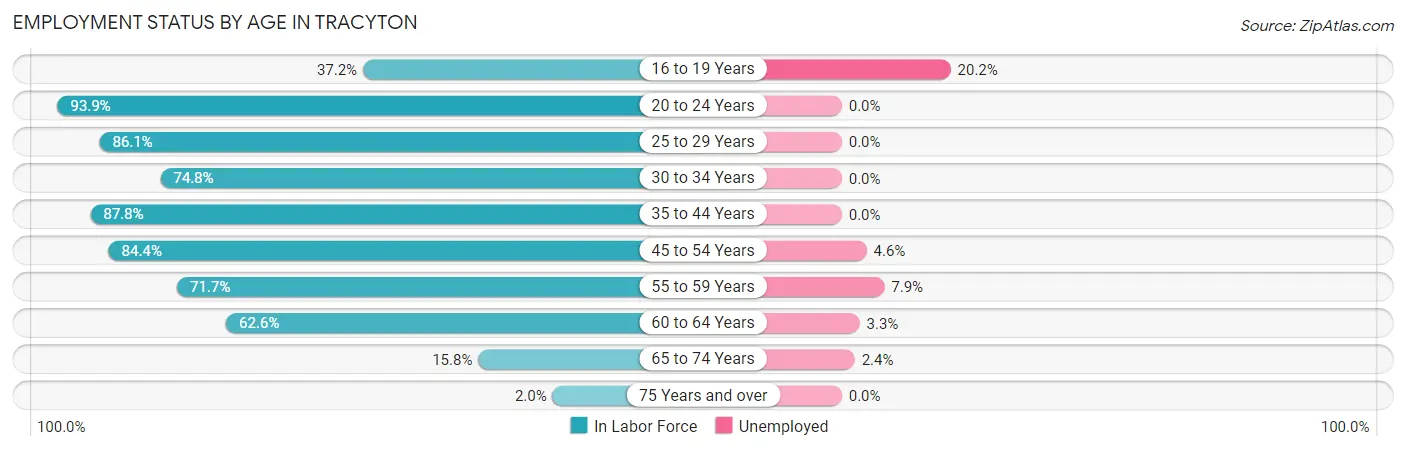
| Age Bracket | In Labor Force | Unemployed |
| 16 to 19 Years | 109 (37.2%) | 22 (20.2%) |
| 20 to 24 Years | 357 (93.9%) | 0 (0.0%) |
| 25 to 29 Years | 513 (86.1%) | 0 (0.0%) |
| 30 to 34 Years | 228 (74.8%) | 0 (0.0%) |
| 35 to 44 Years | 635 (87.8%) | 0 (0.0%) |
| 45 to 54 Years | 374 (84.4%) | 17 (4.6%) |
| 55 to 59 Years | 291 (71.7%) | 23 (7.9%) |
| 60 to 64 Years | 181 (62.6%) | 6 (3.3%) |
| 65 to 74 Years | 84 (15.8%) | 2 (2.4%) |
| 75 Years and over | 11 (2.0%) | 0 (0.0%) |
| Total | 2,784 (61.5%) | 75 (2.7%) |
Employment Status by Educational Attainment in Tracyton
According to labor force statistics for Tracyton, 80.4% of individuals (2,221) out of the total population between 25 and 64 years of age (2,762) are in the labor force, with 2.2% or 49 of them being unemployed. The group with the highest labor force participation rate are those with the educational attainment of bachelor's degree or higher, with 90.3% or 724 individuals in the labor force. Within the labor force, individuals with high school diploma education have the highest percentage of unemployment, with 6.2% or 26 of them being unemployed.
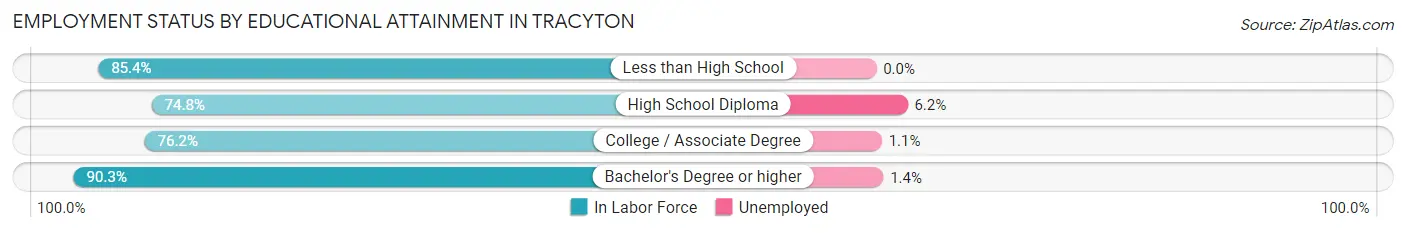
| Educational Attainment | In Labor Force | Unemployed |
| Less than High School | 111 (85.4%) | 0 (0.0%) |
| High School Diploma | 418 (74.8%) | 35 (6.2%) |
| College / Associate Degree | 969 (76.2%) | 14 (1.1%) |
| Bachelor's Degree or higher | 724 (90.3%) | 11 (1.4%) |
| Total | 2,221 (80.4%) | 61 (2.2%) |
Employment Occupations by Sex in Tracyton
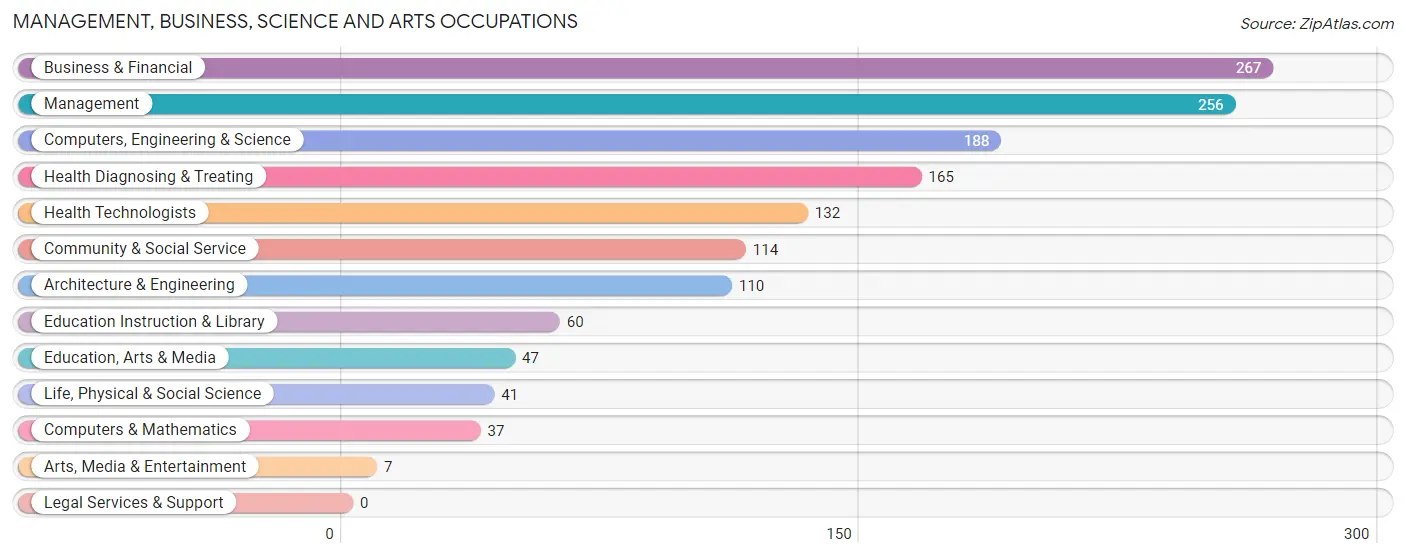
Management, Business, Science and Arts Occupations
The most common Management, Business, Science and Arts occupations in Tracyton are Business & Financial (267 | 10.5%), Management (256 | 10.1%), Computers, Engineering & Science (188 | 7.4%), Health Diagnosing & Treating (165 | 6.5%), and Health Technologists (132 | 5.2%).
Management, Business, Science and Arts Occupations by Sex
Within the Management, Business, Science and Arts occupations in Tracyton, the most male-oriented occupations are Arts, Media & Entertainment (100.0%), Architecture & Engineering (98.2%), and Computers, Engineering & Science (86.7%), while the most female-oriented occupations are Education Instruction & Library (100.0%), Health Technologists (95.5%), and Health Diagnosing & Treating (80.0%).
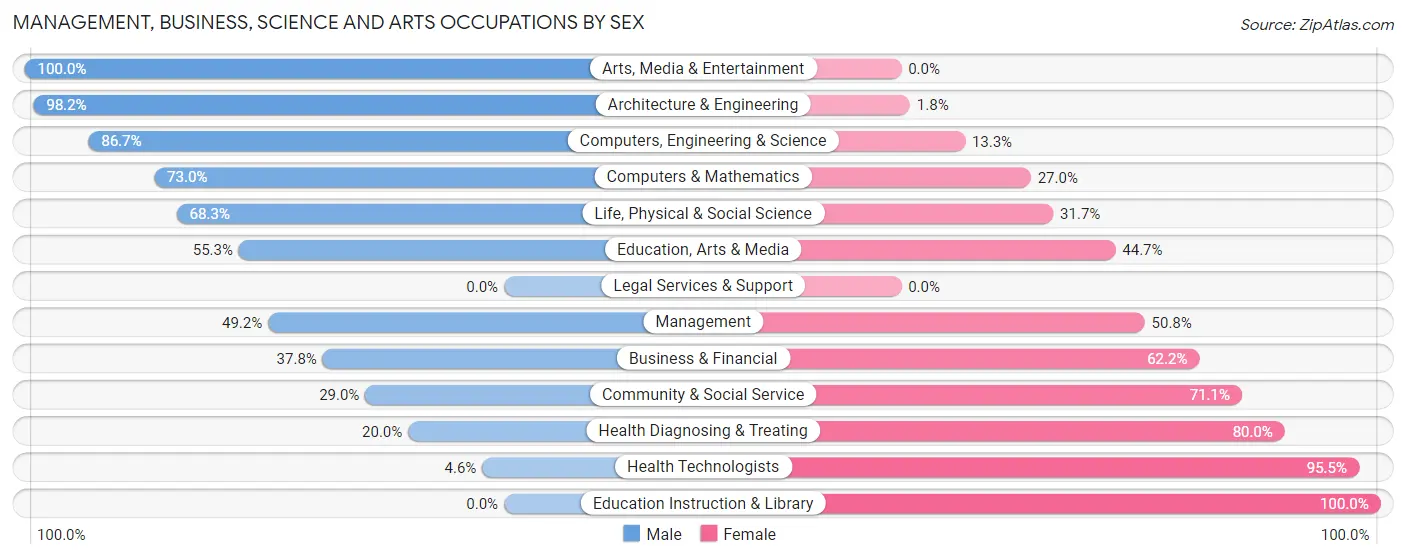
| Occupation | Male | Female |
| Management | 126 (49.2%) | 130 (50.8%) |
| Business & Financial | 101 (37.8%) | 166 (62.2%) |
| Computers, Engineering & Science | 163 (86.7%) | 25 (13.3%) |
| Computers & Mathematics | 27 (73.0%) | 10 (27.0%) |
| Architecture & Engineering | 108 (98.2%) | 2 (1.8%) |
| Life, Physical & Social Science | 28 (68.3%) | 13 (31.7%) |
| Community & Social Service | 33 (28.9%) | 81 (71.1%) |
| Education, Arts & Media | 26 (55.3%) | 21 (44.7%) |
| Legal Services & Support | 0 (0.0%) | 0 (0.0%) |
| Education Instruction & Library | 0 (0.0%) | 60 (100.0%) |
| Arts, Media & Entertainment | 7 (100.0%) | 0 (0.0%) |
| Health Diagnosing & Treating | 33 (20.0%) | 132 (80.0%) |
| Health Technologists | 6 (4.5%) | 126 (95.5%) |
| Total (Category) | 456 (46.1%) | 534 (53.9%) |
| Total (Overall) | 1,279 (50.2%) | 1,269 (49.8%) |
Services Occupations
The most common Services occupations in Tracyton are Food Preparation & Serving (289 | 11.3%), Healthcare Support (177 | 7.0%), Cleaning & Maintenance (114 | 4.5%), Personal Care & Service (60 | 2.4%), and Security & Protection (42 | 1.7%).

Services Occupations by Sex
Within the Services occupations in Tracyton, the most male-oriented occupations are Security & Protection (100.0%), Firefighting & Prevention (100.0%), and Law Enforcement (100.0%), while the most female-oriented occupations are Healthcare Support (100.0%), Cleaning & Maintenance (58.8%), and Food Preparation & Serving (43.6%).
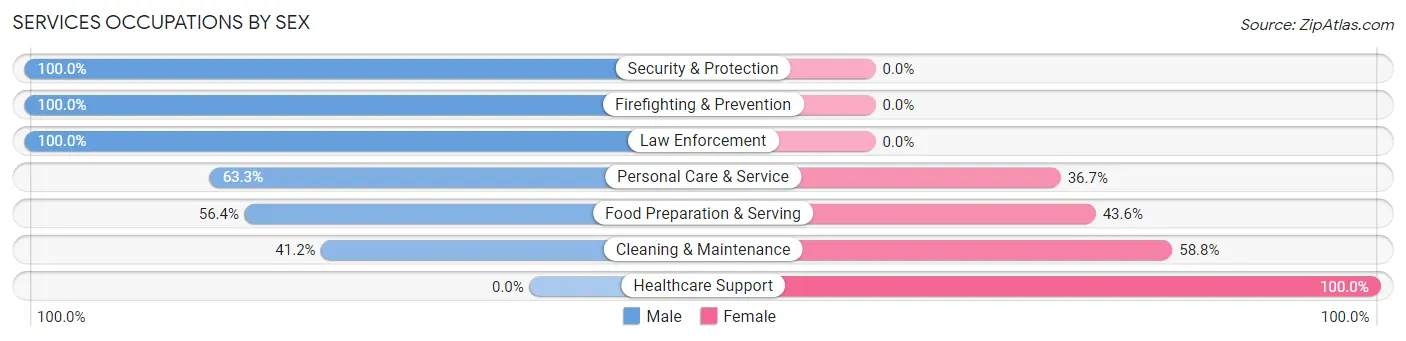
| Occupation | Male | Female |
| Healthcare Support | 0 (0.0%) | 177 (100.0%) |
| Security & Protection | 42 (100.0%) | 0 (0.0%) |
| Firefighting & Prevention | 21 (100.0%) | 0 (0.0%) |
| Law Enforcement | 21 (100.0%) | 0 (0.0%) |
| Food Preparation & Serving | 163 (56.4%) | 126 (43.6%) |
| Cleaning & Maintenance | 47 (41.2%) | 67 (58.8%) |
| Personal Care & Service | 38 (63.3%) | 22 (36.7%) |
| Total (Category) | 290 (42.5%) | 392 (57.5%) |
| Total (Overall) | 1,279 (50.2%) | 1,269 (49.8%) |
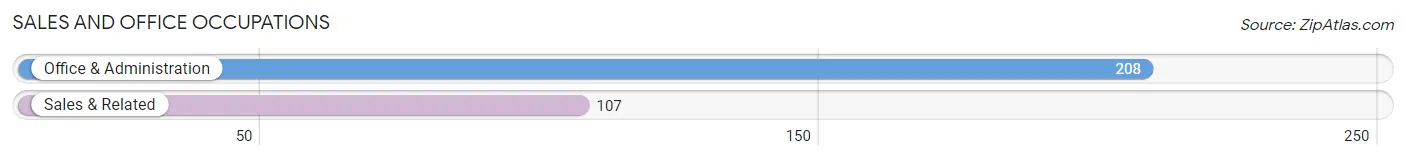
Sales and Office Occupations
The most common Sales and Office occupations in Tracyton are Office & Administration (208 | 8.2%), and Sales & Related (107 | 4.2%).
Sales and Office Occupations by Sex
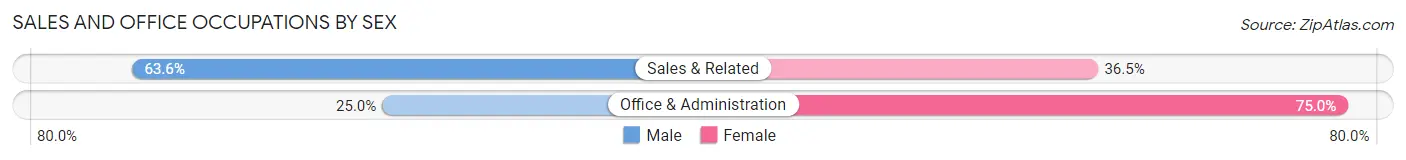
| Occupation | Male | Female |
| Sales & Related | 68 (63.5%) | 39 (36.4%) |
| Office & Administration | 52 (25.0%) | 156 (75.0%) |
| Total (Category) | 120 (38.1%) | 195 (61.9%) |
| Total (Overall) | 1,279 (50.2%) | 1,269 (49.8%) |
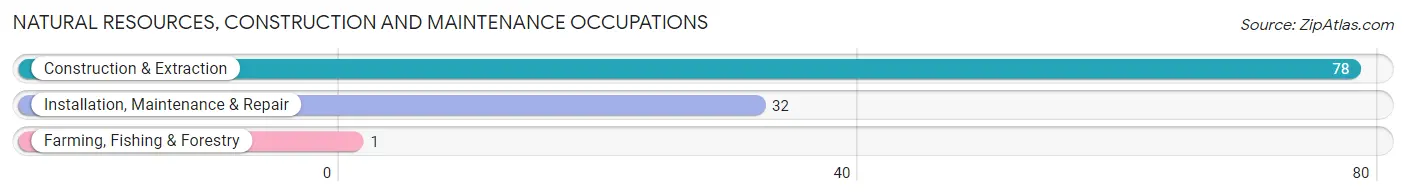
Natural Resources, Construction and Maintenance Occupations
The most common Natural Resources, Construction and Maintenance occupations in Tracyton are Construction & Extraction (78 | 3.1%), Installation, Maintenance & Repair (32 | 1.3%), and Farming, Fishing & Forestry (1 | 0.0%).
Natural Resources, Construction and Maintenance Occupations by Sex
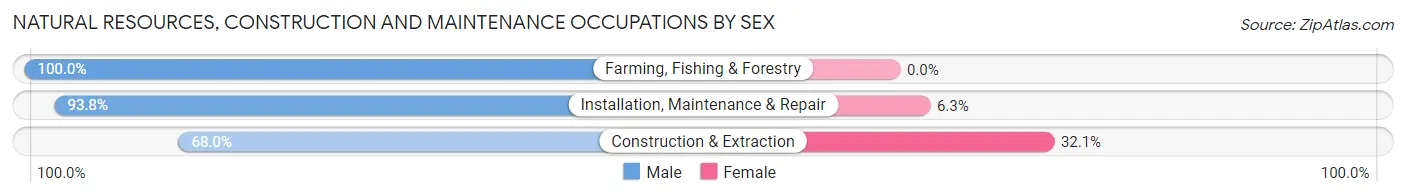
| Occupation | Male | Female |
| Farming, Fishing & Forestry | 1 (100.0%) | 0 (0.0%) |
| Construction & Extraction | 53 (67.9%) | 25 (32.1%) |
| Installation, Maintenance & Repair | 30 (93.8%) | 2 (6.2%) |
| Total (Category) | 84 (75.7%) | 27 (24.3%) |
| Total (Overall) | 1,279 (50.2%) | 1,269 (49.8%) |
Production, Transportation and Moving Occupations
The most common Production, Transportation and Moving occupations in Tracyton are Production (286 | 11.2%), Transportation (125 | 4.9%), and Material Moving (39 | 1.5%).
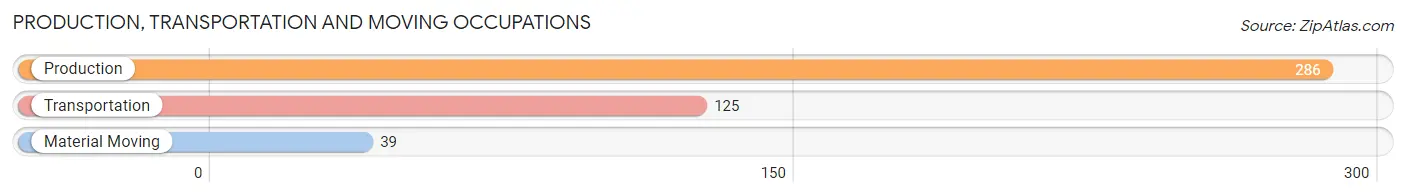
Production, Transportation and Moving Occupations by Sex
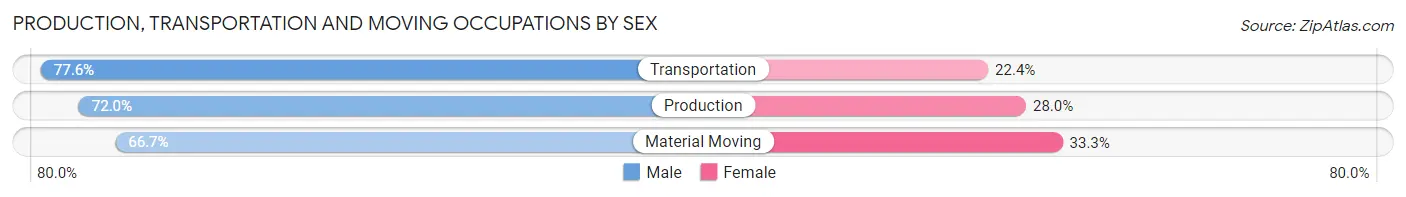
| Occupation | Male | Female |
| Production | 206 (72.0%) | 80 (28.0%) |
| Transportation | 97 (77.6%) | 28 (22.4%) |
| Material Moving | 26 (66.7%) | 13 (33.3%) |
| Total (Category) | 329 (73.1%) | 121 (26.9%) |
| Total (Overall) | 1,279 (50.2%) | 1,269 (49.8%) |
Employment Industries by Sex in Tracyton
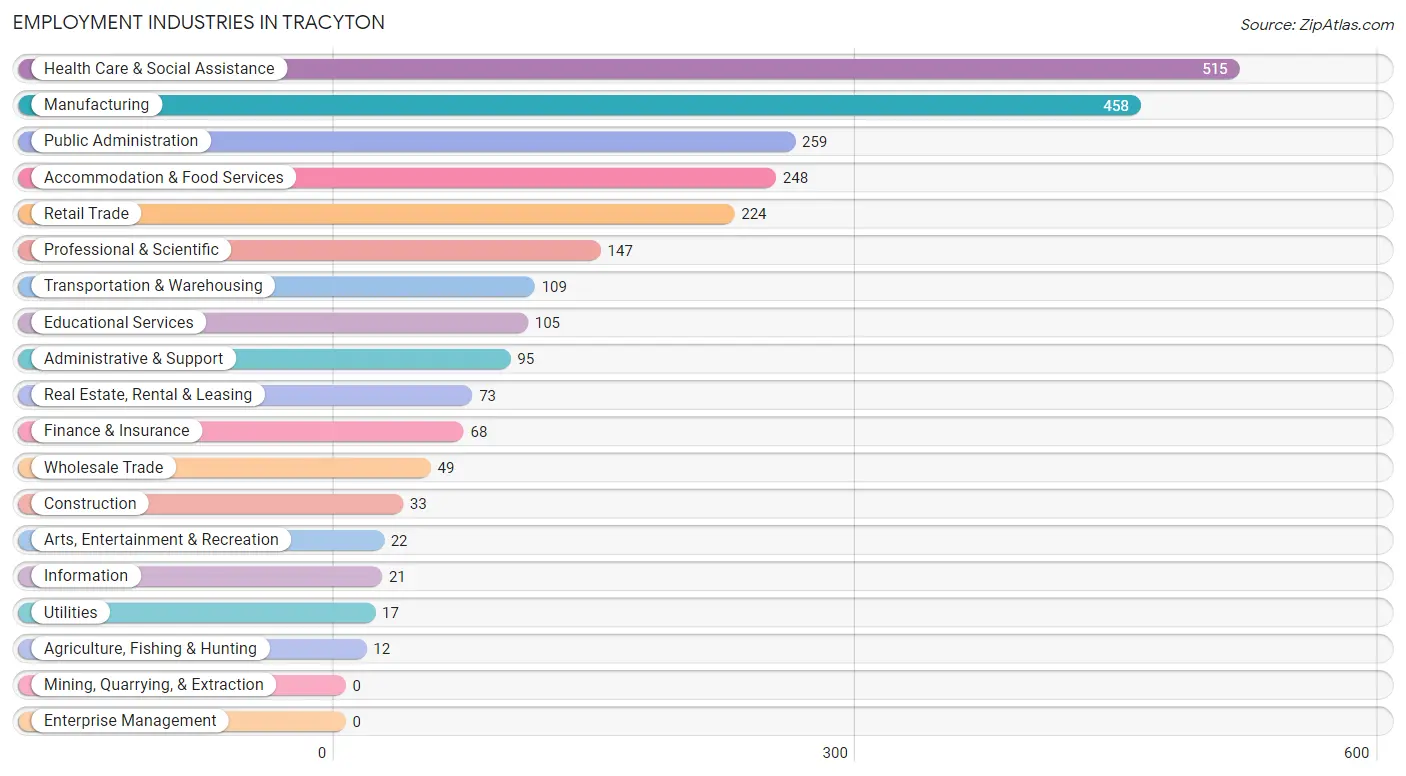
Employment Industries in Tracyton
The major employment industries in Tracyton include Health Care & Social Assistance (515 | 20.2%), Manufacturing (458 | 18.0%), Public Administration (259 | 10.2%), Accommodation & Food Services (248 | 9.7%), and Retail Trade (224 | 8.8%).
Employment Industries by Sex in Tracyton
The Tracyton industries that see more men than women are Construction (100.0%), Transportation & Warehousing (100.0%), and Information (100.0%), whereas the industries that tend to have a higher number of women are Agriculture, Fishing & Hunting (91.7%), Health Care & Social Assistance (87.6%), and Educational Services (84.8%).
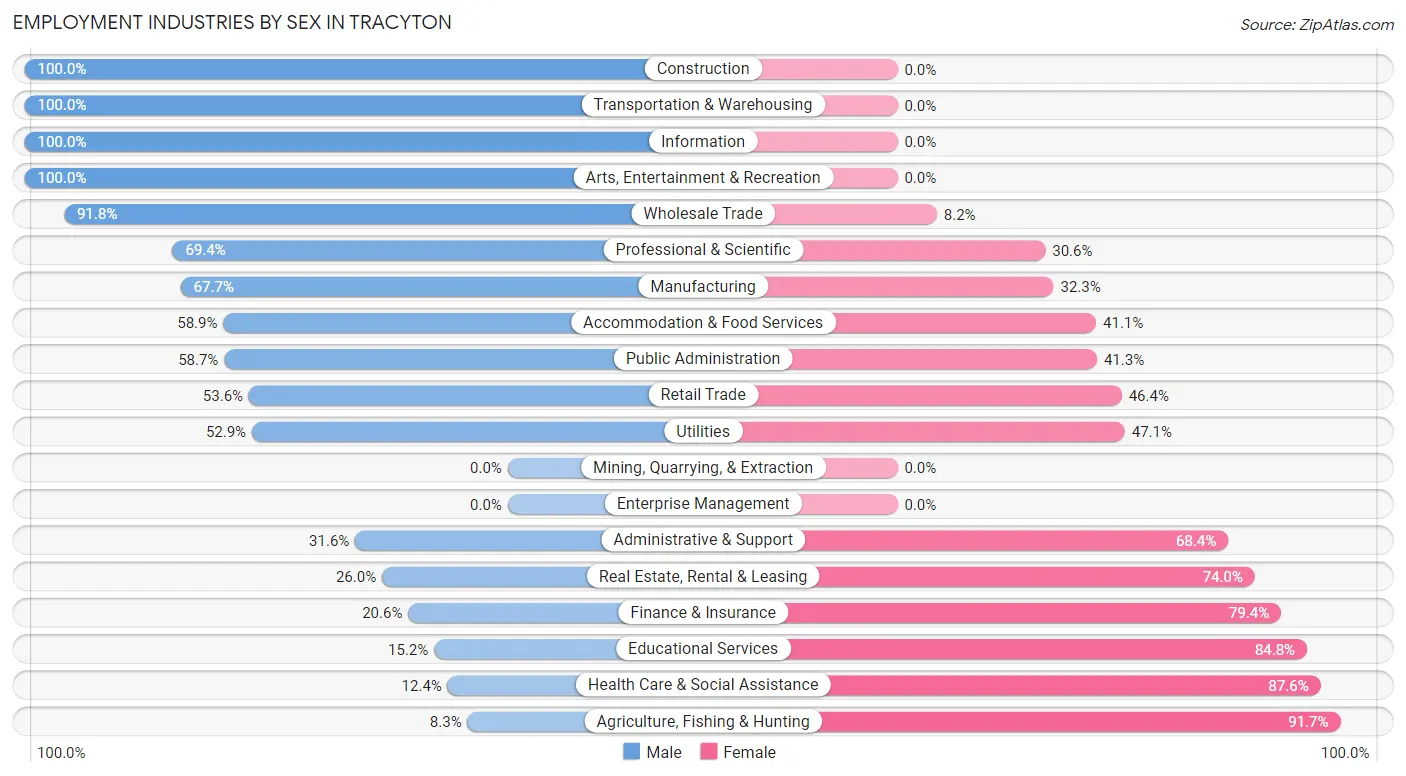
| Industry | Male | Female |
| Agriculture, Fishing & Hunting | 1 (8.3%) | 11 (91.7%) |
| Mining, Quarrying, & Extraction | 0 (0.0%) | 0 (0.0%) |
| Construction | 33 (100.0%) | 0 (0.0%) |
| Manufacturing | 310 (67.7%) | 148 (32.3%) |
| Wholesale Trade | 45 (91.8%) | 4 (8.2%) |
| Retail Trade | 120 (53.6%) | 104 (46.4%) |
| Transportation & Warehousing | 109 (100.0%) | 0 (0.0%) |
| Utilities | 9 (52.9%) | 8 (47.1%) |
| Information | 21 (100.0%) | 0 (0.0%) |
| Finance & Insurance | 14 (20.6%) | 54 (79.4%) |
| Real Estate, Rental & Leasing | 19 (26.0%) | 54 (74.0%) |
| Professional & Scientific | 102 (69.4%) | 45 (30.6%) |
| Enterprise Management | 0 (0.0%) | 0 (0.0%) |
| Administrative & Support | 30 (31.6%) | 65 (68.4%) |
| Educational Services | 16 (15.2%) | 89 (84.8%) |
| Health Care & Social Assistance | 64 (12.4%) | 451 (87.6%) |
| Arts, Entertainment & Recreation | 22 (100.0%) | 0 (0.0%) |
| Accommodation & Food Services | 146 (58.9%) | 102 (41.1%) |
| Public Administration | 152 (58.7%) | 107 (41.3%) |
| Total | 1,279 (50.2%) | 1,269 (49.8%) |
Education in Tracyton
School Enrollment in Tracyton
The most common levels of schooling among the 1,366 students in Tracyton are elementary school (308 | 22.6%), middle school (280 | 20.5%), and college / undergraduate (253 | 18.5%).
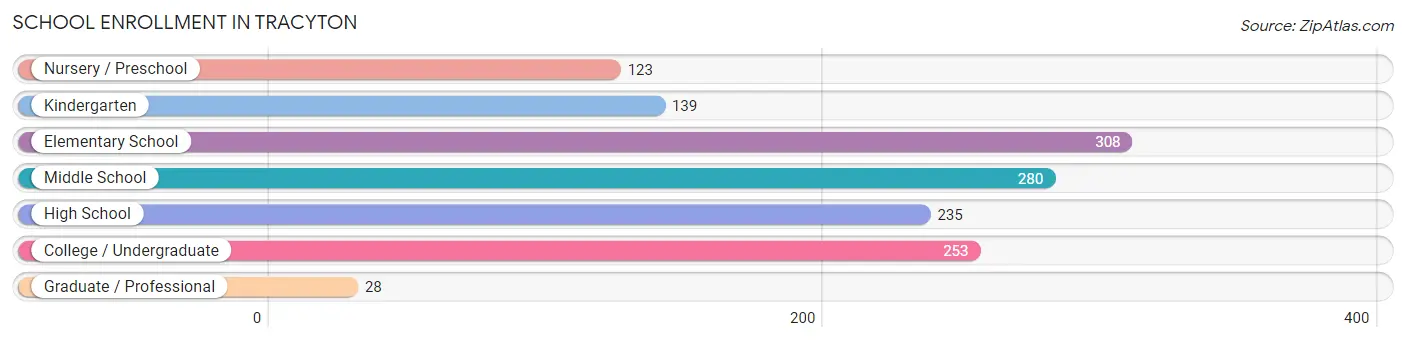
| School Level | # Students | % Students |
| Nursery / Preschool | 123 | 9.0% |
| Kindergarten | 139 | 10.2% |
| Elementary School | 308 | 22.6% |
| Middle School | 280 | 20.5% |
| High School | 235 | 17.2% |
| College / Undergraduate | 253 | 18.5% |
| Graduate / Professional | 28 | 2.1% |
| Total | 1,366 | 100.0% |
School Enrollment by Age by Funding Source in Tracyton
Out of a total of 1,366 students who are enrolled in schools in Tracyton, 228 (16.7%) attend a private institution, while the remaining 1,138 (83.3%) are enrolled in public schools. The age group of 3 to 4 year olds has the highest likelihood of being enrolled in private schools, with 82 (81.2% in the age bracket) enrolled. Conversely, the age group of 15 to 17 year olds has the lowest likelihood of being enrolled in a private school, with 107 (100.0% in the age bracket) attending a public institution.
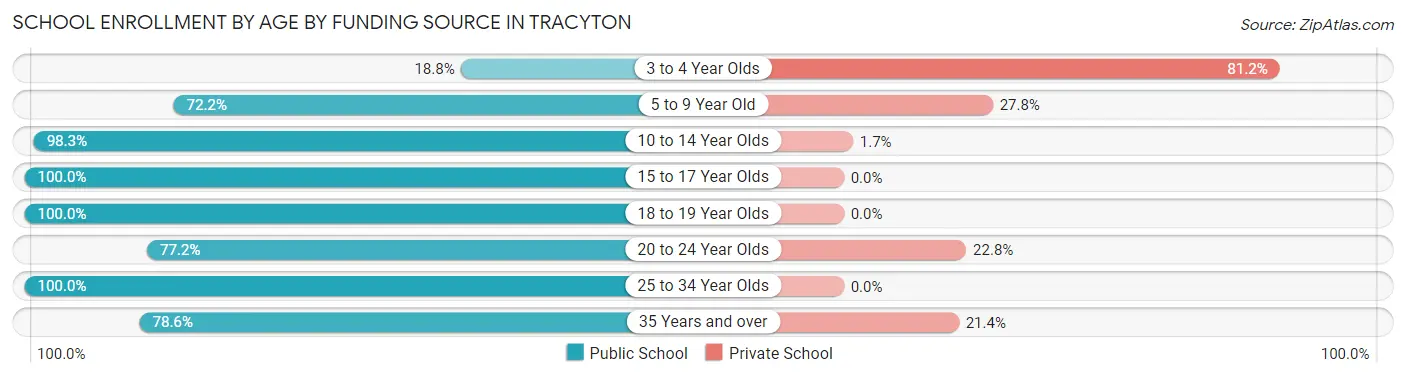
| Age Bracket | Public School | Private School |
| 3 to 4 Year Olds | 19 (18.8%) | 82 (81.2%) |
| 5 to 9 Year Old | 307 (72.2%) | 118 (27.8%) |
| 10 to 14 Year Olds | 344 (98.3%) | 6 (1.7%) |
| 15 to 17 Year Olds | 107 (100.0%) | 0 (0.0%) |
| 18 to 19 Year Olds | 170 (100.0%) | 0 (0.0%) |
| 20 to 24 Year Olds | 44 (77.2%) | 13 (22.8%) |
| 25 to 34 Year Olds | 114 (100.0%) | 0 (0.0%) |
| 35 Years and over | 33 (78.6%) | 9 (21.4%) |
| Total | 1,138 (83.3%) | 228 (16.7%) |
Educational Attainment by Field of Study in Tracyton
Business (225 | 19.3%), engineering (221 | 18.9%), bio, nature & agricultural (138 | 11.8%), arts & humanities (113 | 9.7%), and literature & languages (105 | 9.0%) are the most common fields of study among 1,168 individuals in Tracyton who have obtained a bachelor's degree or higher.
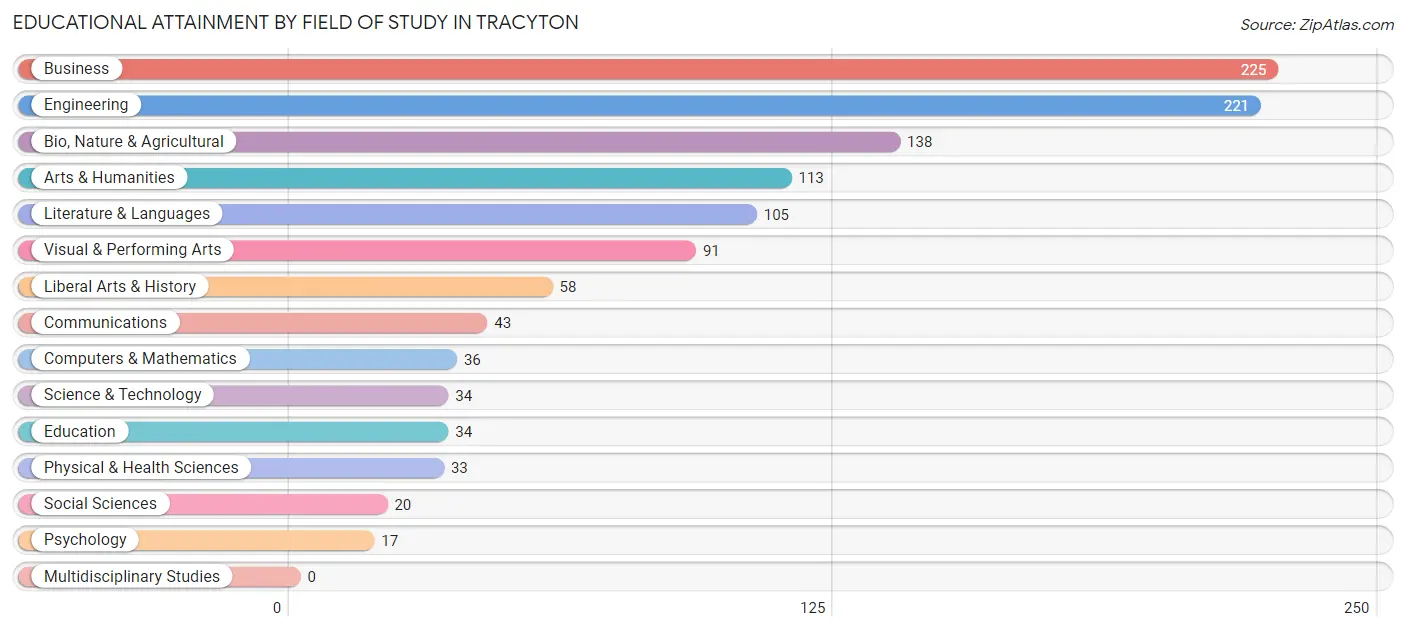
| Field of Study | # Graduates | % Graduates |
| Computers & Mathematics | 36 | 3.1% |
| Bio, Nature & Agricultural | 138 | 11.8% |
| Physical & Health Sciences | 33 | 2.8% |
| Psychology | 17 | 1.5% |
| Social Sciences | 20 | 1.7% |
| Engineering | 221 | 18.9% |
| Multidisciplinary Studies | 0 | 0.0% |
| Science & Technology | 34 | 2.9% |
| Business | 225 | 19.3% |
| Education | 34 | 2.9% |
| Literature & Languages | 105 | 9.0% |
| Liberal Arts & History | 58 | 5.0% |
| Visual & Performing Arts | 91 | 7.8% |
| Communications | 43 | 3.7% |
| Arts & Humanities | 113 | 9.7% |
| Total | 1,168 | 100.0% |
Transportation & Commute in Tracyton
Vehicle Availability by Sex in Tracyton
The most prevalent vehicle ownership categories in Tracyton are males with 3 vehicles (546, accounting for 41.2%) and females with 3 vehicles (355, making up 41.8%).
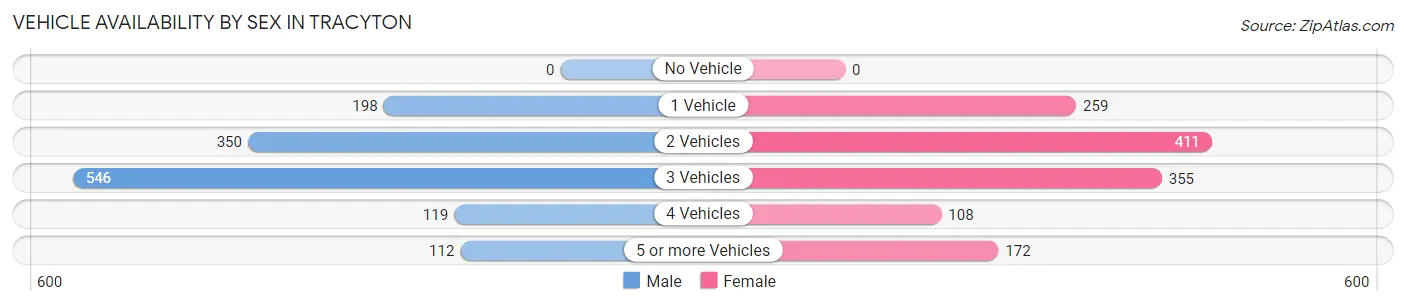
| Vehicles Available | Male | Female |
| No Vehicle | 0 (0.0%) | 0 (0.0%) |
| 1 Vehicle | 198 (14.9%) | 259 (19.9%) |
| 2 Vehicles | 350 (26.4%) | 411 (31.5%) |
| 3 Vehicles | 546 (41.2%) | 355 (27.2%) |
| 4 Vehicles | 119 (9.0%) | 108 (8.3%) |
| 5 or more Vehicles | 112 (8.5%) | 172 (13.2%) |
| Total | 1,325 (100.0%) | 1,305 (100.0%) |
Commute Time in Tracyton
The most frequently occuring commute durations in Tracyton are 15 to 19 minutes (479 commuters, 19.6%), 20 to 24 minutes (451 commuters, 18.4%), and 10 to 14 minutes (342 commuters, 14.0%).
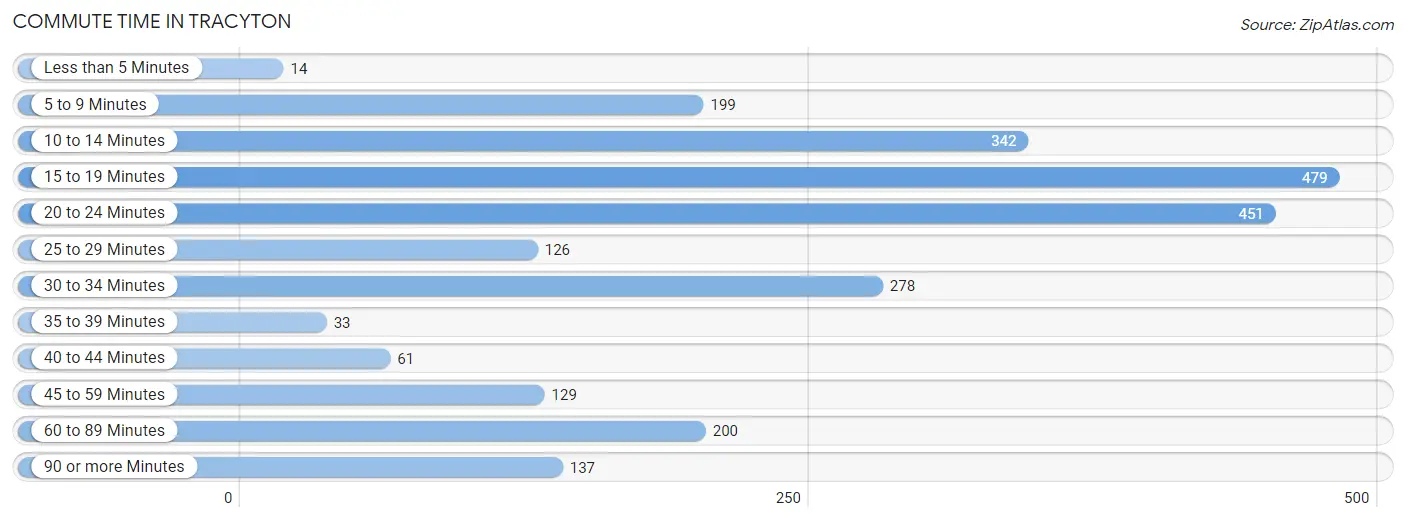
| Commute Time | # Commuters | % Commuters |
| Less than 5 Minutes | 14 | 0.6% |
| 5 to 9 Minutes | 199 | 8.1% |
| 10 to 14 Minutes | 342 | 14.0% |
| 15 to 19 Minutes | 479 | 19.6% |
| 20 to 24 Minutes | 451 | 18.4% |
| 25 to 29 Minutes | 126 | 5.1% |
| 30 to 34 Minutes | 278 | 11.4% |
| 35 to 39 Minutes | 33 | 1.3% |
| 40 to 44 Minutes | 61 | 2.5% |
| 45 to 59 Minutes | 129 | 5.3% |
| 60 to 89 Minutes | 200 | 8.2% |
| 90 or more Minutes | 137 | 5.6% |
Commute Time by Sex in Tracyton
The most common commute times in Tracyton are 20 to 24 minutes (214 commuters, 17.0%) for males and 15 to 19 minutes (295 commuters, 24.7%) for females.
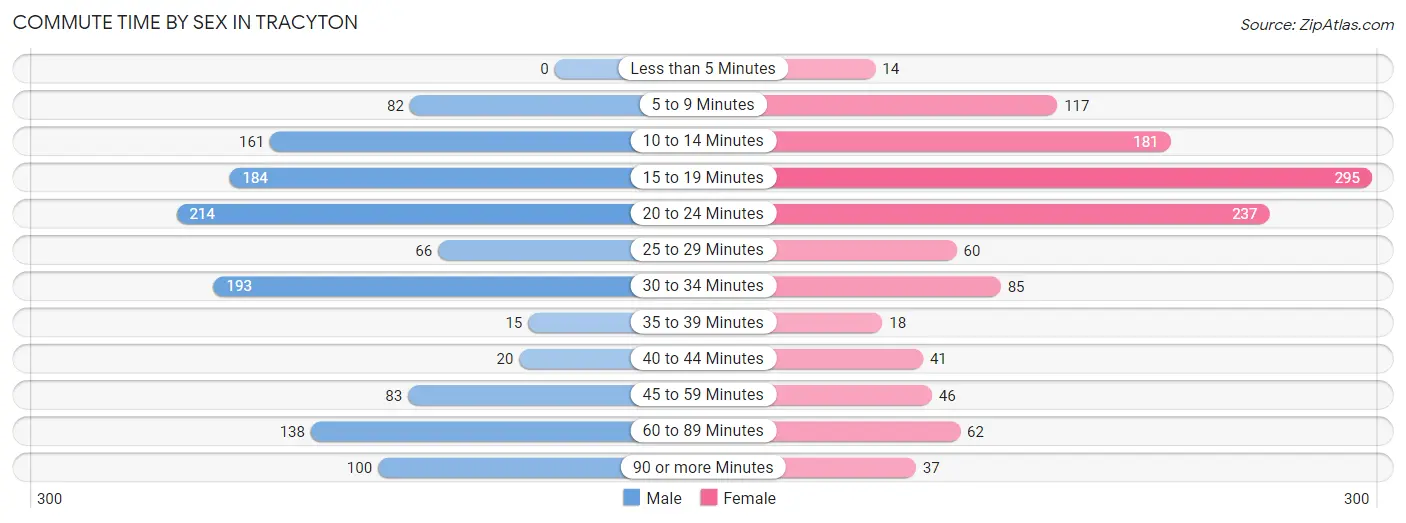
| Commute Time | Male | Female |
| Less than 5 Minutes | 0 (0.0%) | 14 (1.2%) |
| 5 to 9 Minutes | 82 (6.5%) | 117 (9.8%) |
| 10 to 14 Minutes | 161 (12.8%) | 181 (15.2%) |
| 15 to 19 Minutes | 184 (14.6%) | 295 (24.7%) |
| 20 to 24 Minutes | 214 (17.0%) | 237 (19.9%) |
| 25 to 29 Minutes | 66 (5.2%) | 60 (5.0%) |
| 30 to 34 Minutes | 193 (15.4%) | 85 (7.1%) |
| 35 to 39 Minutes | 15 (1.2%) | 18 (1.5%) |
| 40 to 44 Minutes | 20 (1.6%) | 41 (3.4%) |
| 45 to 59 Minutes | 83 (6.6%) | 46 (3.9%) |
| 60 to 89 Minutes | 138 (11.0%) | 62 (5.2%) |
| 90 or more Minutes | 100 (8.0%) | 37 (3.1%) |
Time of Departure to Work by Sex in Tracyton
The most frequent times of departure to work in Tracyton are 12:00 PM to 3:59 PM (187, 14.9%) for males and 7:00 AM to 7:29 AM (169, 14.2%) for females.
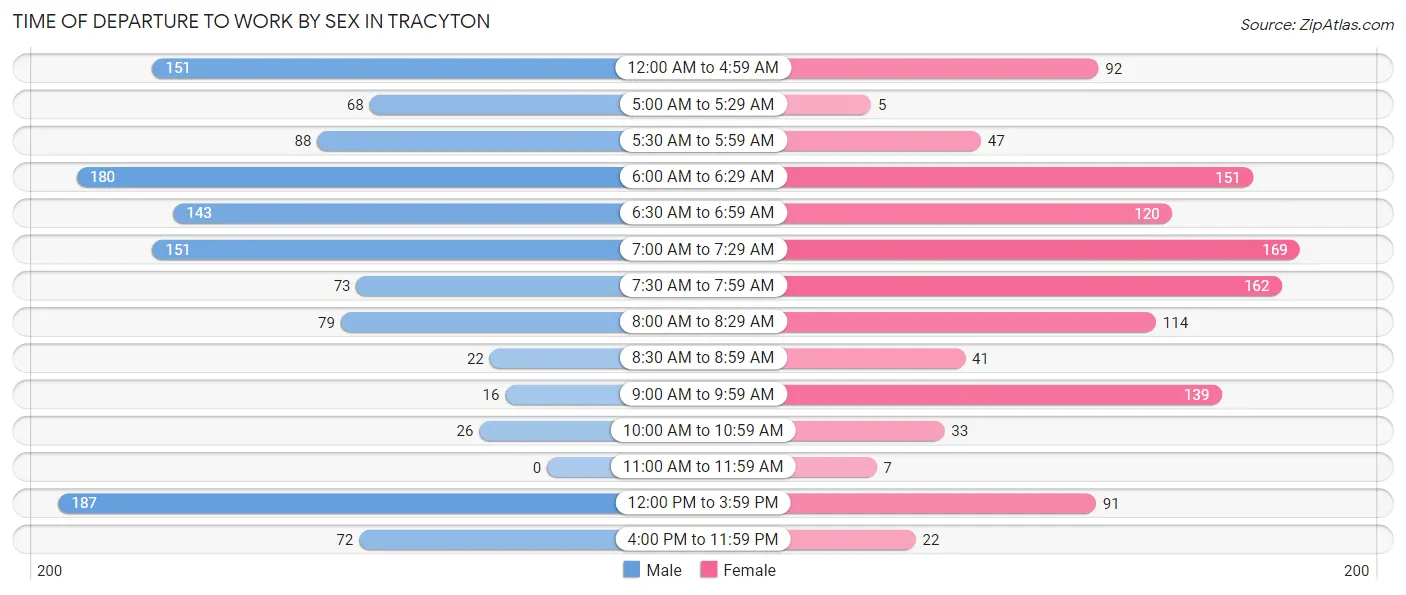
| Time of Departure | Male | Female |
| 12:00 AM to 4:59 AM | 151 (12.0%) | 92 (7.7%) |
| 5:00 AM to 5:29 AM | 68 (5.4%) | 5 (0.4%) |
| 5:30 AM to 5:59 AM | 88 (7.0%) | 47 (3.9%) |
| 6:00 AM to 6:29 AM | 180 (14.3%) | 151 (12.7%) |
| 6:30 AM to 6:59 AM | 143 (11.4%) | 120 (10.1%) |
| 7:00 AM to 7:29 AM | 151 (12.0%) | 169 (14.2%) |
| 7:30 AM to 7:59 AM | 73 (5.8%) | 162 (13.6%) |
| 8:00 AM to 8:29 AM | 79 (6.3%) | 114 (9.6%) |
| 8:30 AM to 8:59 AM | 22 (1.8%) | 41 (3.4%) |
| 9:00 AM to 9:59 AM | 16 (1.3%) | 139 (11.7%) |
| 10:00 AM to 10:59 AM | 26 (2.1%) | 33 (2.8%) |
| 11:00 AM to 11:59 AM | 0 (0.0%) | 7 (0.6%) |
| 12:00 PM to 3:59 PM | 187 (14.9%) | 91 (7.6%) |
| 4:00 PM to 11:59 PM | 72 (5.7%) | 22 (1.8%) |
| Total | 1,256 (100.0%) | 1,193 (100.0%) |
Housing Occupancy in Tracyton
Occupancy by Ownership in Tracyton
Of the total 1,988 dwellings in Tracyton, owner-occupied units account for 1,544 (77.7%), while renter-occupied units make up 444 (22.3%).
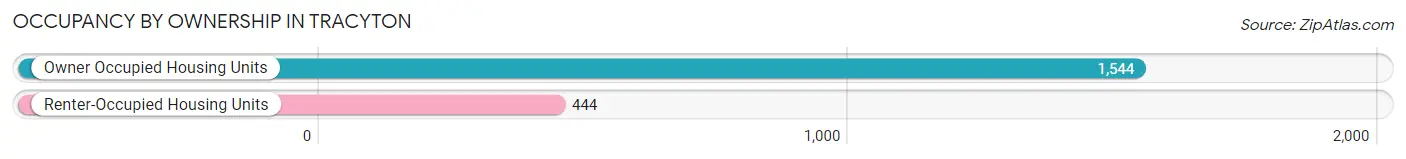
| Occupancy | # Housing Units | % Housing Units |
| Owner Occupied Housing Units | 1,544 | 77.7% |
| Renter-Occupied Housing Units | 444 | 22.3% |
| Total Occupied Housing Units | 1,988 | 100.0% |
Occupancy by Household Size in Tracyton
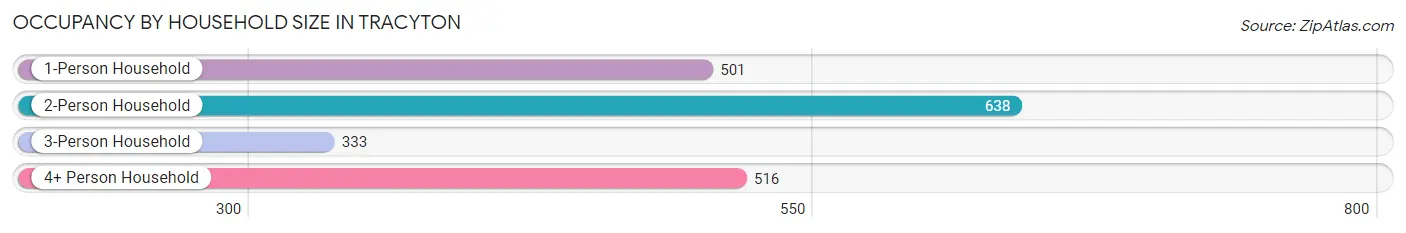
| Household Size | # Housing Units | % Housing Units |
| 1-Person Household | 501 | 25.2% |
| 2-Person Household | 638 | 32.1% |
| 3-Person Household | 333 | 16.8% |
| 4+ Person Household | 516 | 26.0% |
| Total Housing Units | 1,988 | 100.0% |
Occupancy by Ownership by Household Size in Tracyton
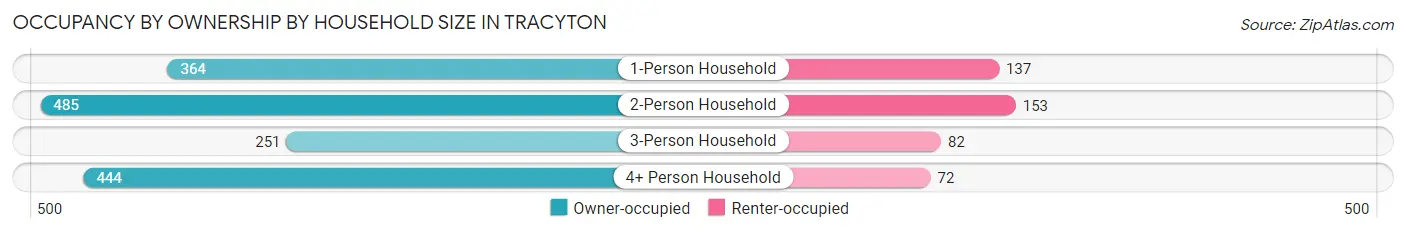
| Household Size | Owner-occupied | Renter-occupied |
| 1-Person Household | 364 (72.7%) | 137 (27.4%) |
| 2-Person Household | 485 (76.0%) | 153 (24.0%) |
| 3-Person Household | 251 (75.4%) | 82 (24.6%) |
| 4+ Person Household | 444 (86.1%) | 72 (14.0%) |
| Total Housing Units | 1,544 (77.7%) | 444 (22.3%) |
Occupancy by Educational Attainment in Tracyton
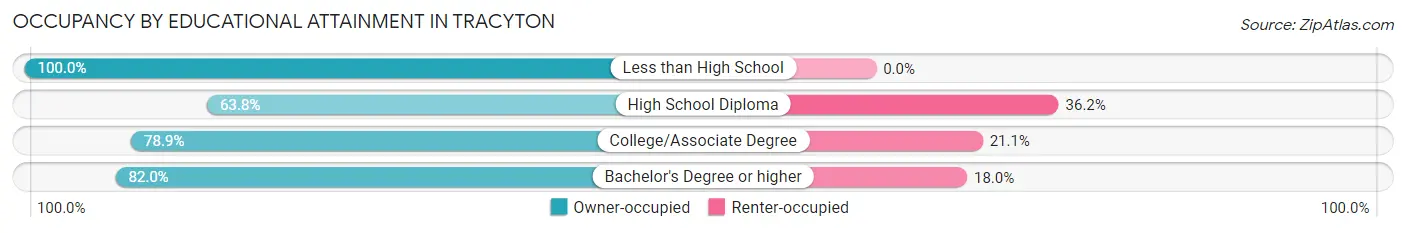
| Household Size | Owner-occupied | Renter-occupied |
| Less than High School | 81 (100.0%) | 0 (0.0%) |
| High School Diploma | 240 (63.8%) | 136 (36.2%) |
| College/Associate Degree | 818 (78.9%) | 219 (21.1%) |
| Bachelor's Degree or higher | 405 (82.0%) | 89 (18.0%) |
Occupancy by Age of Householder in Tracyton
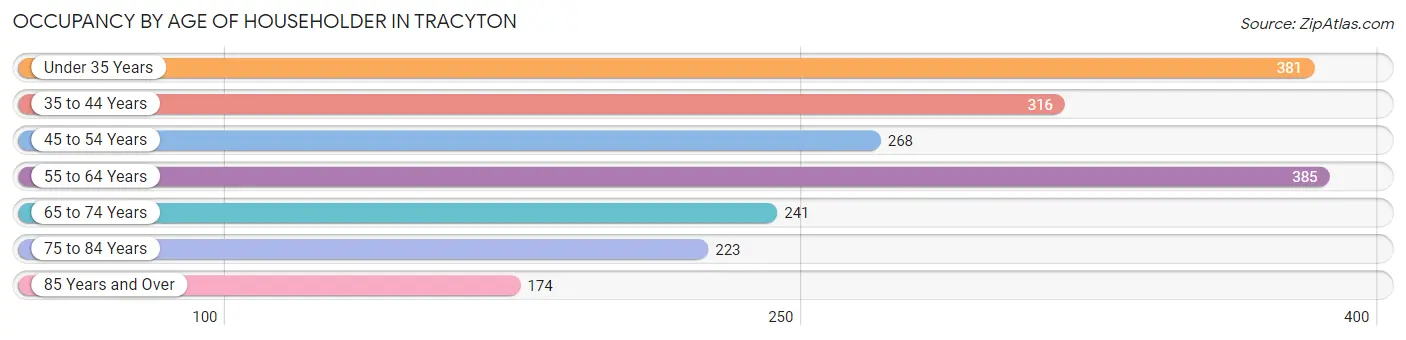
| Age Bracket | # Households | % Households |
| Under 35 Years | 381 | 19.2% |
| 35 to 44 Years | 316 | 15.9% |
| 45 to 54 Years | 268 | 13.5% |
| 55 to 64 Years | 385 | 19.4% |
| 65 to 74 Years | 241 | 12.1% |
| 75 to 84 Years | 223 | 11.2% |
| 85 Years and Over | 174 | 8.7% |
| Total | 1,988 | 100.0% |
Housing Finances in Tracyton
Median Income by Occupancy in Tracyton
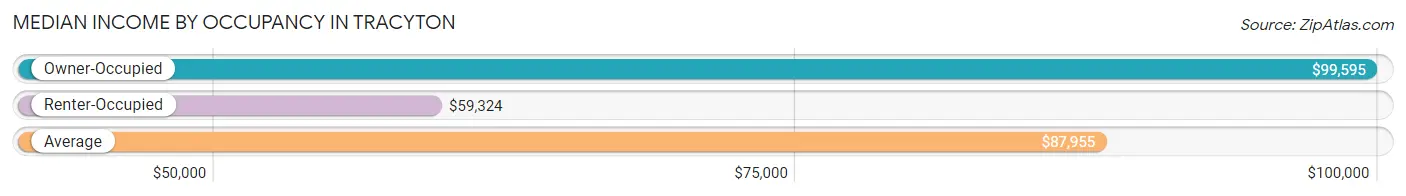
| Occupancy Type | # Households | Median Income |
| Owner-Occupied | 1,544 (77.7%) | $99,595 |
| Renter-Occupied | 444 (22.3%) | $59,324 |
| Average | 1,988 (100.0%) | $87,955 |
Occupancy by Householder Income Bracket in Tracyton
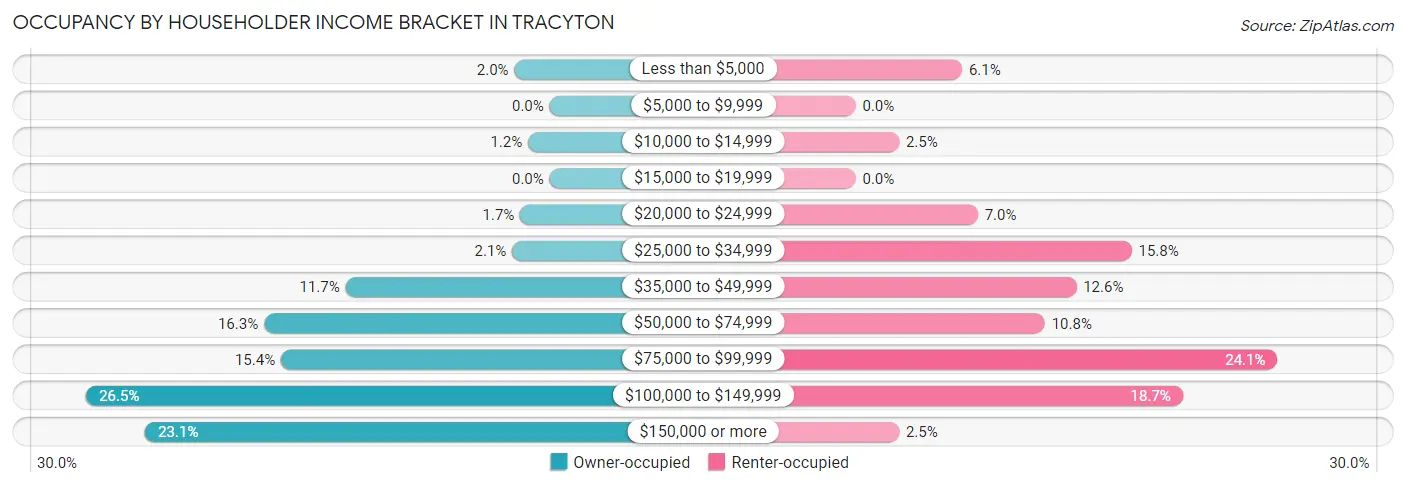
| Income Bracket | Owner-occupied | Renter-occupied |
| Less than $5,000 | 31 (2.0%) | 27 (6.1%) |
| $5,000 to $9,999 | 0 (0.0%) | 0 (0.0%) |
| $10,000 to $14,999 | 19 (1.2%) | 11 (2.5%) |
| $15,000 to $19,999 | 0 (0.0%) | 0 (0.0%) |
| $20,000 to $24,999 | 26 (1.7%) | 31 (7.0%) |
| $25,000 to $34,999 | 33 (2.1%) | 70 (15.8%) |
| $35,000 to $49,999 | 180 (11.7%) | 56 (12.6%) |
| $50,000 to $74,999 | 252 (16.3%) | 48 (10.8%) |
| $75,000 to $99,999 | 237 (15.3%) | 107 (24.1%) |
| $100,000 to $149,999 | 409 (26.5%) | 83 (18.7%) |
| $150,000 or more | 357 (23.1%) | 11 (2.5%) |
| Total | 1,544 (100.0%) | 444 (100.0%) |
Monthly Housing Cost Tiers in Tracyton
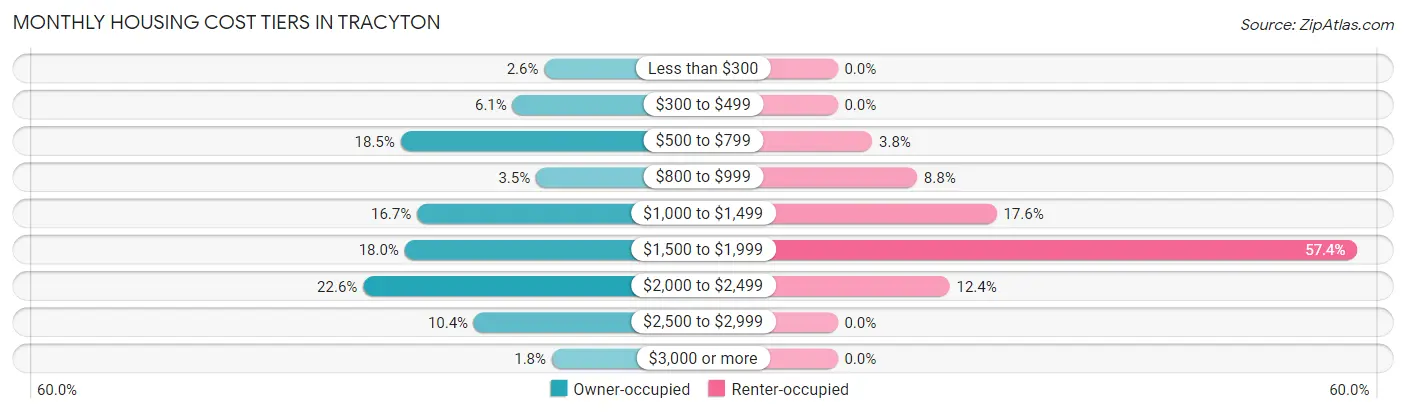
| Monthly Cost | Owner-occupied | Renter-occupied |
| Less than $300 | 40 (2.6%) | 0 (0.0%) |
| $300 to $499 | 94 (6.1%) | 0 (0.0%) |
| $500 to $799 | 285 (18.5%) | 17 (3.8%) |
| $800 to $999 | 54 (3.5%) | 39 (8.8%) |
| $1,000 to $1,499 | 257 (16.7%) | 78 (17.6%) |
| $1,500 to $1,999 | 278 (18.0%) | 255 (57.4%) |
| $2,000 to $2,499 | 349 (22.6%) | 55 (12.4%) |
| $2,500 to $2,999 | 160 (10.4%) | 0 (0.0%) |
| $3,000 or more | 27 (1.8%) | 0 (0.0%) |
| Total | 1,544 (100.0%) | 444 (100.0%) |
Physical Housing Characteristics in Tracyton
Housing Structures in Tracyton
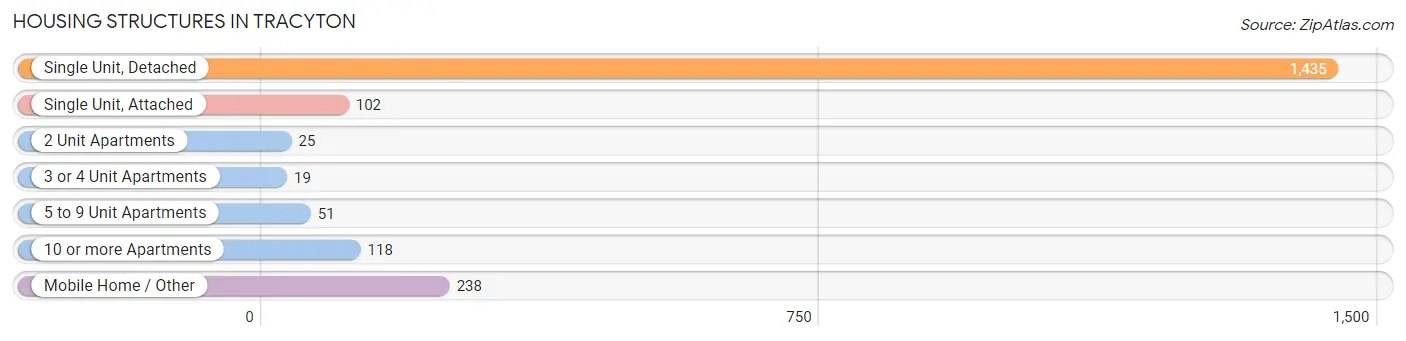
| Structure Type | # Housing Units | % Housing Units |
| Single Unit, Detached | 1,435 | 72.2% |
| Single Unit, Attached | 102 | 5.1% |
| 2 Unit Apartments | 25 | 1.3% |
| 3 or 4 Unit Apartments | 19 | 1.0% |
| 5 to 9 Unit Apartments | 51 | 2.6% |
| 10 or more Apartments | 118 | 5.9% |
| Mobile Home / Other | 238 | 12.0% |
| Total | 1,988 | 100.0% |
Housing Structures by Occupancy in Tracyton
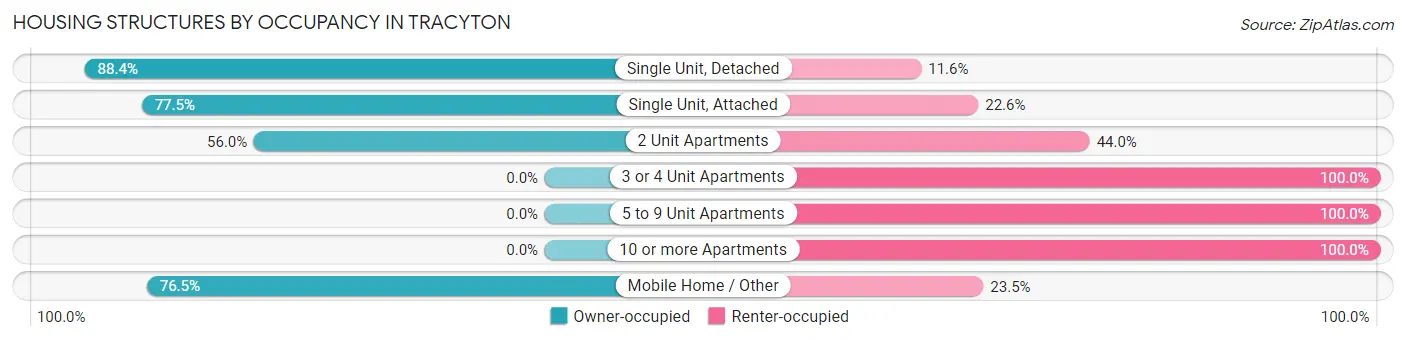
| Structure Type | Owner-occupied | Renter-occupied |
| Single Unit, Detached | 1,269 (88.4%) | 166 (11.6%) |
| Single Unit, Attached | 79 (77.4%) | 23 (22.6%) |
| 2 Unit Apartments | 14 (56.0%) | 11 (44.0%) |
| 3 or 4 Unit Apartments | 0 (0.0%) | 19 (100.0%) |
| 5 to 9 Unit Apartments | 0 (0.0%) | 51 (100.0%) |
| 10 or more Apartments | 0 (0.0%) | 118 (100.0%) |
| Mobile Home / Other | 182 (76.5%) | 56 (23.5%) |
| Total | 1,544 (77.7%) | 444 (22.3%) |
Housing Structures by Number of Rooms in Tracyton
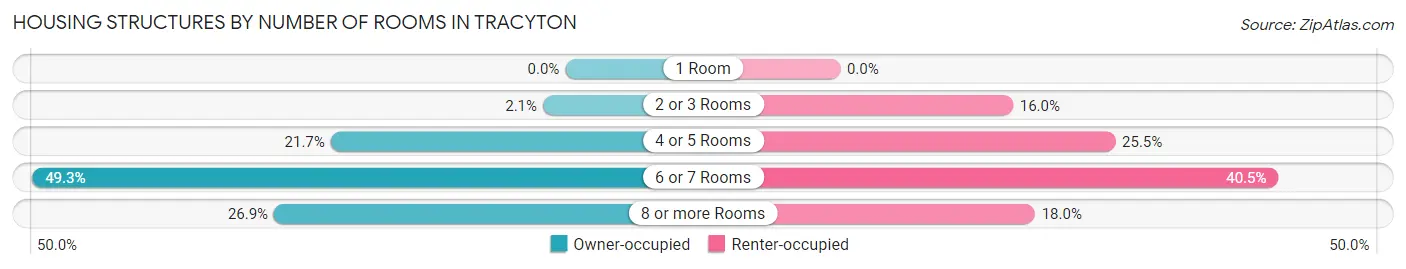
| Number of Rooms | Owner-occupied | Renter-occupied |
| 1 Room | 0 (0.0%) | 0 (0.0%) |
| 2 or 3 Rooms | 32 (2.1%) | 71 (16.0%) |
| 4 or 5 Rooms | 335 (21.7%) | 113 (25.5%) |
| 6 or 7 Rooms | 761 (49.3%) | 180 (40.5%) |
| 8 or more Rooms | 416 (26.9%) | 80 (18.0%) |
| Total | 1,544 (100.0%) | 444 (100.0%) |
Housing Structure by Heating Type in Tracyton
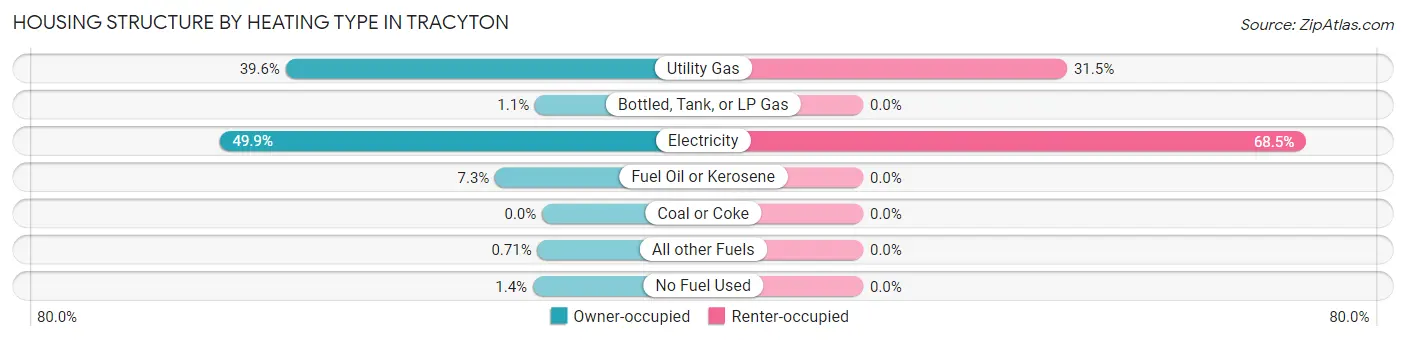
| Heating Type | Owner-occupied | Renter-occupied |
| Utility Gas | 612 (39.6%) | 140 (31.5%) |
| Bottled, Tank, or LP Gas | 17 (1.1%) | 0 (0.0%) |
| Electricity | 770 (49.9%) | 304 (68.5%) |
| Fuel Oil or Kerosene | 112 (7.2%) | 0 (0.0%) |
| Coal or Coke | 0 (0.0%) | 0 (0.0%) |
| All other Fuels | 11 (0.7%) | 0 (0.0%) |
| No Fuel Used | 22 (1.4%) | 0 (0.0%) |
| Total | 1,544 (100.0%) | 444 (100.0%) |
Household Vehicle Usage in Tracyton
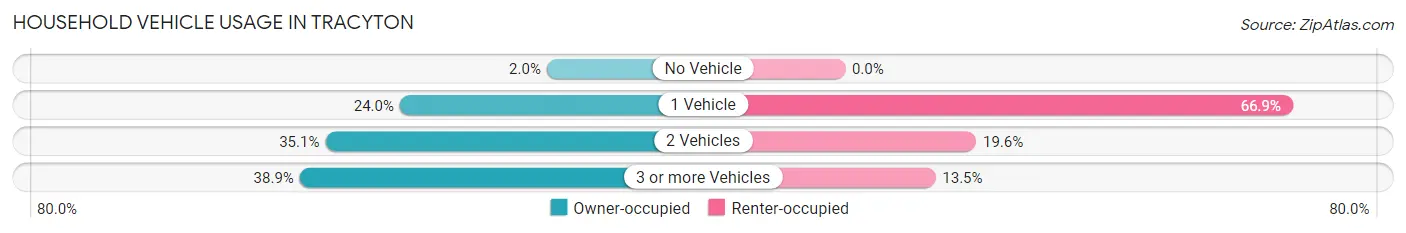
| Vehicles per Household | Owner-occupied | Renter-occupied |
| No Vehicle | 31 (2.0%) | 0 (0.0%) |
| 1 Vehicle | 370 (24.0%) | 297 (66.9%) |
| 2 Vehicles | 542 (35.1%) | 87 (19.6%) |
| 3 or more Vehicles | 601 (38.9%) | 60 (13.5%) |
| Total | 1,544 (100.0%) | 444 (100.0%) |
Real Estate & Mortgages in Tracyton
Real Estate and Mortgage Overview in Tracyton
| Characteristic | Without Mortgage | With Mortgage |
| Housing Units | 552 | 992 |
| Median Property Value | $384,500 | $375,800 |
| Median Household Income | $72,188 | $246 |
| Monthly Housing Costs | $679 | $27 |
| Real Estate Taxes | $3,699 | $5 |
Property Value by Mortgage Status in Tracyton
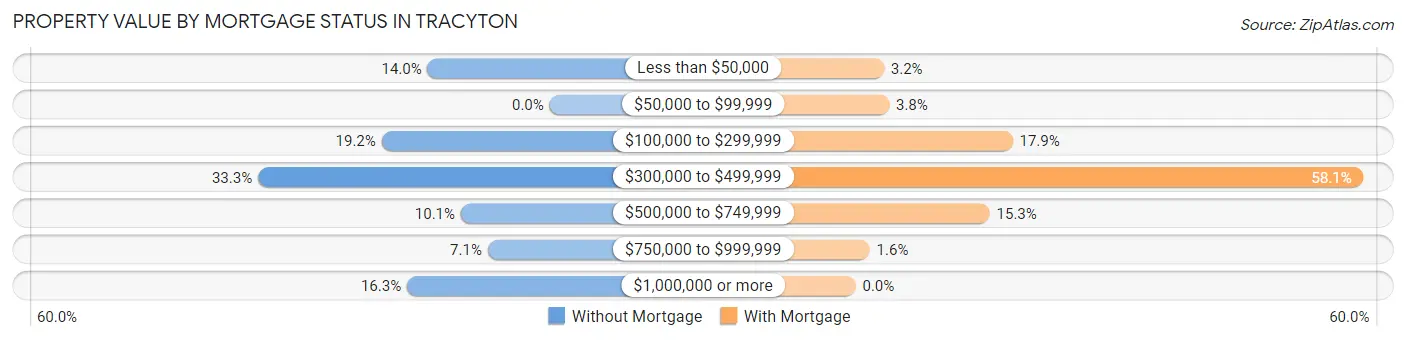
| Property Value | Without Mortgage | With Mortgage |
| Less than $50,000 | 77 (14.0%) | 32 (3.2%) |
| $50,000 to $99,999 | 0 (0.0%) | 38 (3.8%) |
| $100,000 to $299,999 | 106 (19.2%) | 178 (17.9%) |
| $300,000 to $499,999 | 184 (33.3%) | 576 (58.1%) |
| $500,000 to $749,999 | 56 (10.1%) | 152 (15.3%) |
| $750,000 to $999,999 | 39 (7.1%) | 16 (1.6%) |
| $1,000,000 or more | 90 (16.3%) | 0 (0.0%) |
| Total | 552 (100.0%) | 992 (100.0%) |
Household Income by Mortgage Status in Tracyton
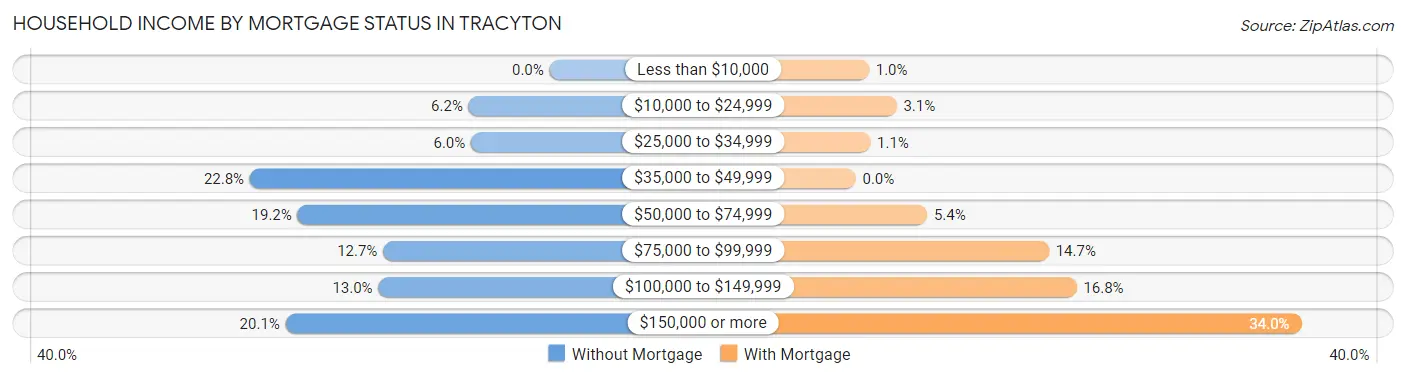
| Household Income | Without Mortgage | With Mortgage |
| Less than $10,000 | 0 (0.0%) | 10 (1.0%) |
| $10,000 to $24,999 | 34 (6.2%) | 31 (3.1%) |
| $25,000 to $34,999 | 33 (6.0%) | 11 (1.1%) |
| $35,000 to $49,999 | 126 (22.8%) | 0 (0.0%) |
| $50,000 to $74,999 | 106 (19.2%) | 54 (5.4%) |
| $75,000 to $99,999 | 70 (12.7%) | 146 (14.7%) |
| $100,000 to $149,999 | 72 (13.0%) | 167 (16.8%) |
| $150,000 or more | 111 (20.1%) | 337 (34.0%) |
| Total | 552 (100.0%) | 992 (100.0%) |
Property Value to Household Income Ratio in Tracyton
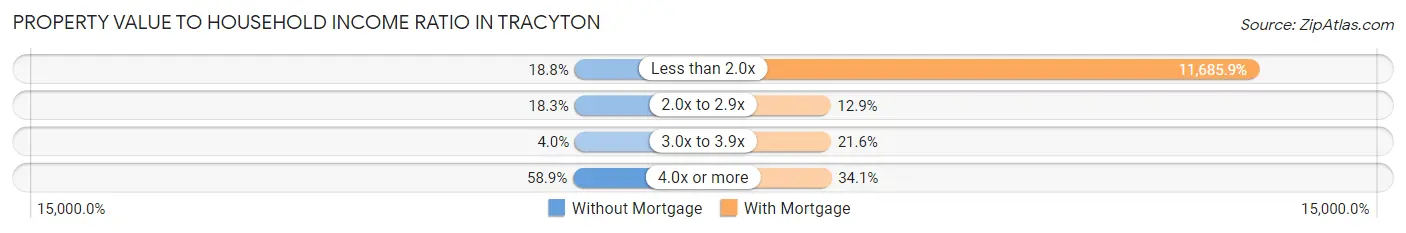
| Value-to-Income Ratio | Without Mortgage | With Mortgage |
| Less than 2.0x | 104 (18.8%) | 115,924 (11,685.9%) |
| 2.0x to 2.9x | 101 (18.3%) | 128 (12.9%) |
| 3.0x to 3.9x | 22 (4.0%) | 214 (21.6%) |
| 4.0x or more | 325 (58.9%) | 338 (34.1%) |
| Total | 552 (100.0%) | 992 (100.0%) |
Real Estate Taxes by Mortgage Status in Tracyton
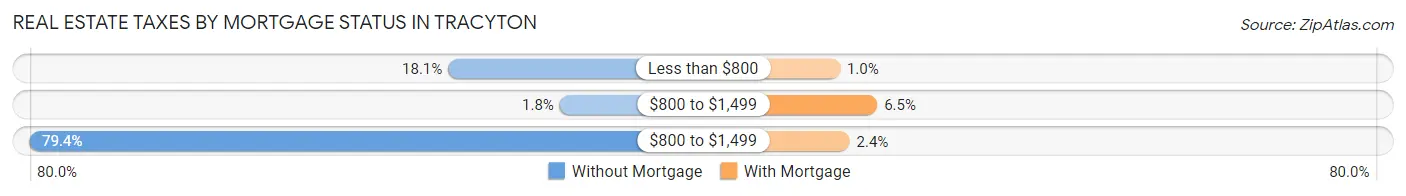
| Property Taxes | Without Mortgage | With Mortgage |
| Less than $800 | 100 (18.1%) | 10 (1.0%) |
| $800 to $1,499 | 10 (1.8%) | 64 (6.5%) |
| $800 to $1,499 | 438 (79.3%) | 24 (2.4%) |
| Total | 552 (100.0%) | 992 (100.0%) |
Health & Disability in Tracyton
Health Insurance Coverage by Age in Tracyton
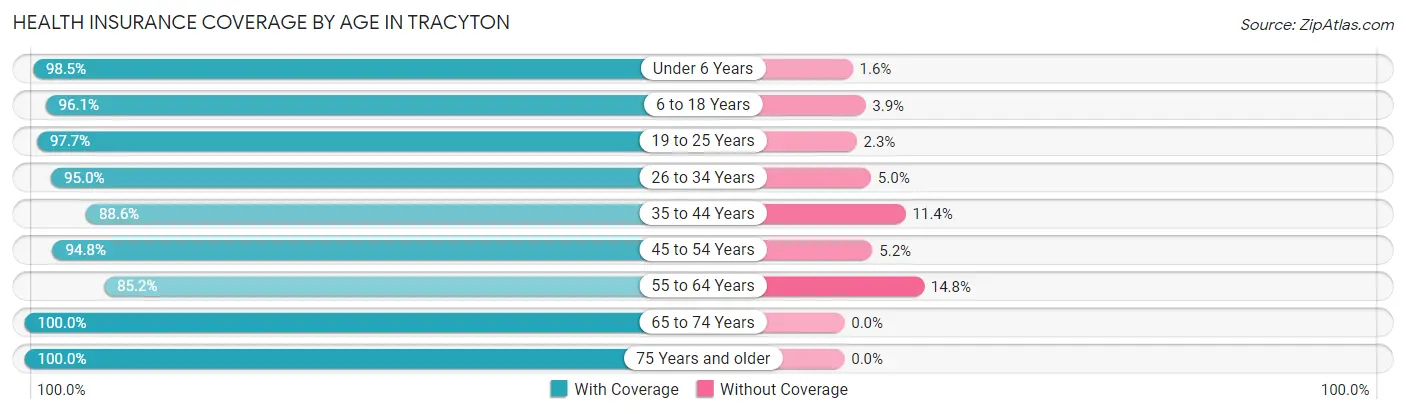
| Age Bracket | With Coverage | Without Coverage |
| Under 6 Years | 318 (98.5%) | 5 (1.5%) |
| 6 to 18 Years | 930 (96.1%) | 38 (3.9%) |
| 19 to 25 Years | 511 (97.7%) | 12 (2.3%) |
| 26 to 34 Years | 690 (95.0%) | 36 (5.0%) |
| 35 to 44 Years | 604 (88.6%) | 78 (11.4%) |
| 45 to 54 Years | 417 (94.8%) | 23 (5.2%) |
| 55 to 64 Years | 592 (85.2%) | 103 (14.8%) |
| 65 to 74 Years | 531 (100.0%) | 0 (0.0%) |
| 75 Years and older | 561 (100.0%) | 0 (0.0%) |
| Total | 5,154 (94.6%) | 295 (5.4%) |
Health Insurance Coverage by Citizenship Status in Tracyton
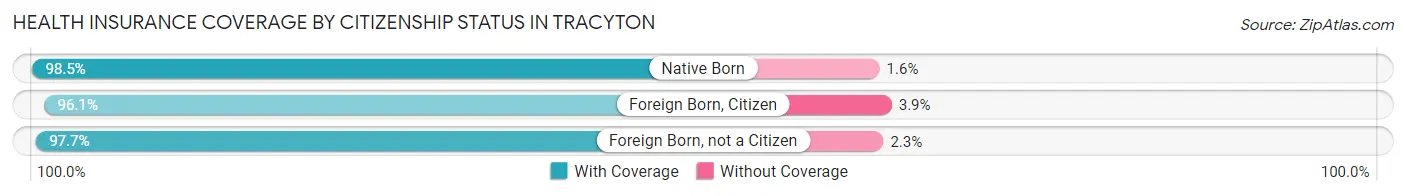
| Citizenship Status | With Coverage | Without Coverage |
| Native Born | 318 (98.5%) | 5 (1.5%) |
| Foreign Born, Citizen | 930 (96.1%) | 38 (3.9%) |
| Foreign Born, not a Citizen | 511 (97.7%) | 12 (2.3%) |
Health Insurance Coverage by Household Income in Tracyton
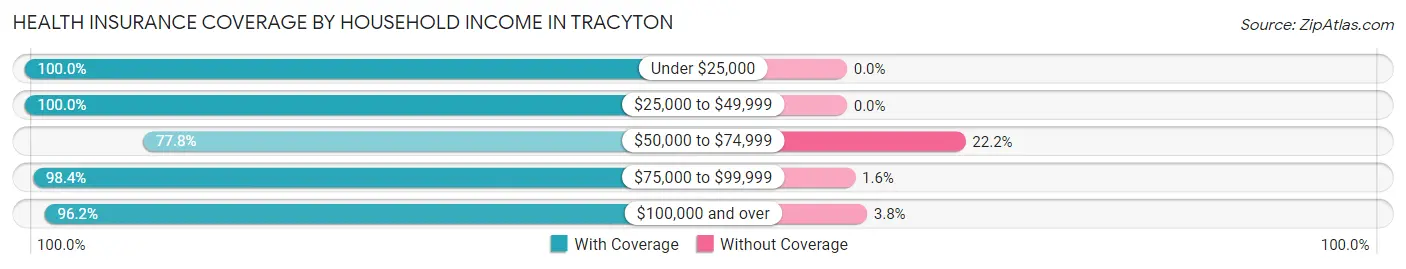
| Household Income | With Coverage | Without Coverage |
| Under $25,000 | 329 (100.0%) | 0 (0.0%) |
| $25,000 to $49,999 | 455 (100.0%) | 0 (0.0%) |
| $50,000 to $74,999 | 595 (77.8%) | 170 (22.2%) |
| $75,000 to $99,999 | 949 (98.4%) | 15 (1.6%) |
| $100,000 and over | 2,814 (96.2%) | 110 (3.8%) |
Public vs Private Health Insurance Coverage by Age in Tracyton
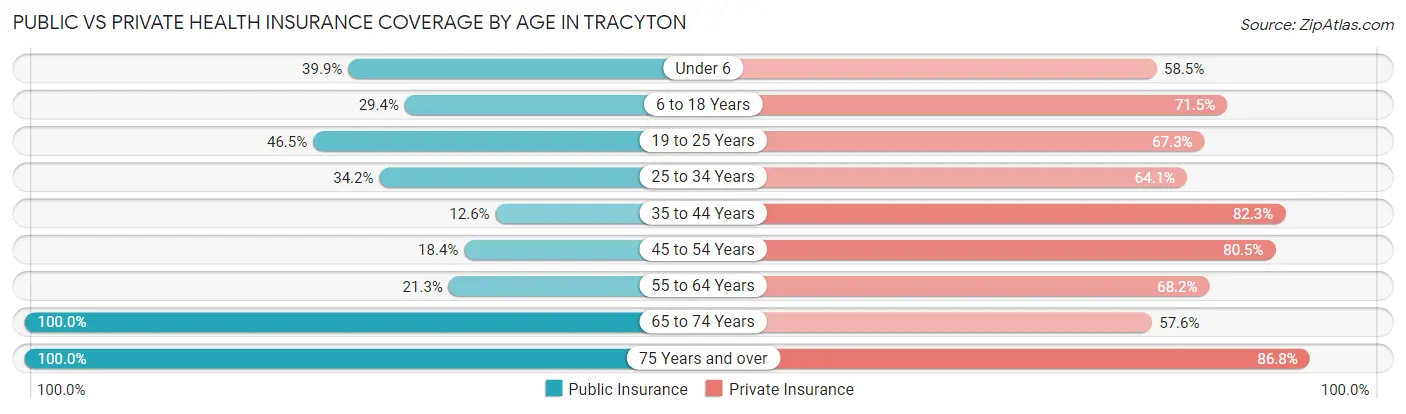
| Age Bracket | Public Insurance | Private Insurance |
| Under 6 | 129 (39.9%) | 189 (58.5%) |
| 6 to 18 Years | 285 (29.4%) | 692 (71.5%) |
| 19 to 25 Years | 243 (46.5%) | 352 (67.3%) |
| 25 to 34 Years | 248 (34.2%) | 465 (64.0%) |
| 35 to 44 Years | 86 (12.6%) | 561 (82.3%) |
| 45 to 54 Years | 81 (18.4%) | 354 (80.4%) |
| 55 to 64 Years | 148 (21.3%) | 474 (68.2%) |
| 65 to 74 Years | 531 (100.0%) | 306 (57.6%) |
| 75 Years and over | 561 (100.0%) | 487 (86.8%) |
| Total | 2,312 (42.4%) | 3,880 (71.2%) |
Disability Status by Sex by Age in Tracyton
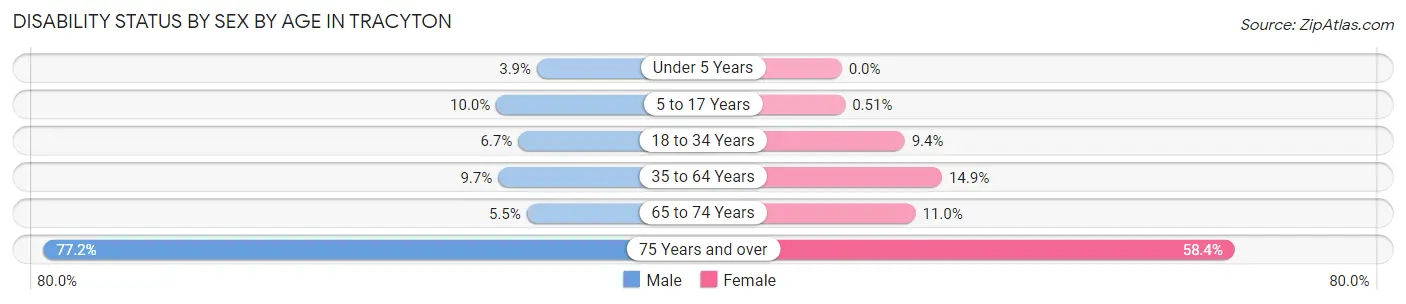
| Age Bracket | Male | Female |
| Under 5 Years | 7 (3.9%) | 0 (0.0%) |
| 5 to 17 Years | 50 (10.0%) | 2 (0.5%) |
| 18 to 34 Years | 43 (6.7%) | 71 (9.3%) |
| 35 to 64 Years | 81 (9.7%) | 146 (14.9%) |
| 65 to 74 Years | 14 (5.4%) | 30 (11.0%) |
| 75 Years and over | 105 (77.2%) | 248 (58.4%) |
Disability Class by Sex by Age in Tracyton
Disability Class: Hearing Difficulty
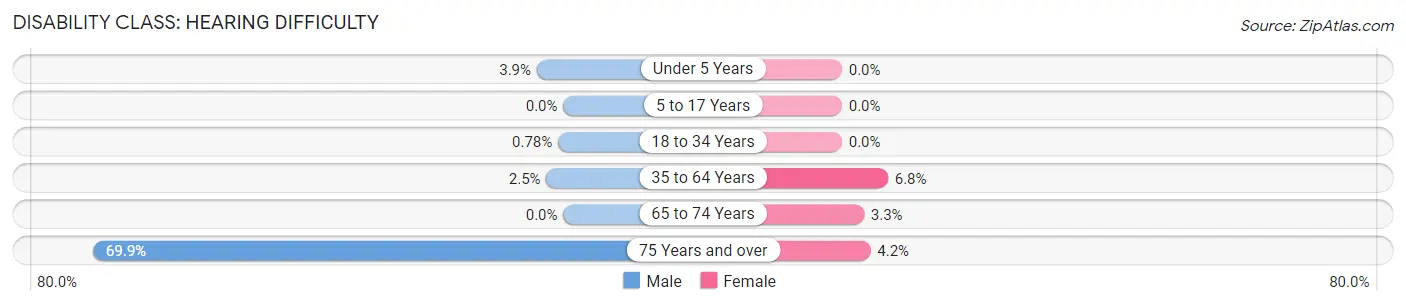
| Age Bracket | Male | Female |
| Under 5 Years | 7 (3.9%) | 0 (0.0%) |
| 5 to 17 Years | 0 (0.0%) | 0 (0.0%) |
| 18 to 34 Years | 5 (0.8%) | 0 (0.0%) |
| 35 to 64 Years | 21 (2.5%) | 67 (6.8%) |
| 65 to 74 Years | 0 (0.0%) | 9 (3.3%) |
| 75 Years and over | 95 (69.9%) | 18 (4.2%) |
Disability Class: Vision Difficulty
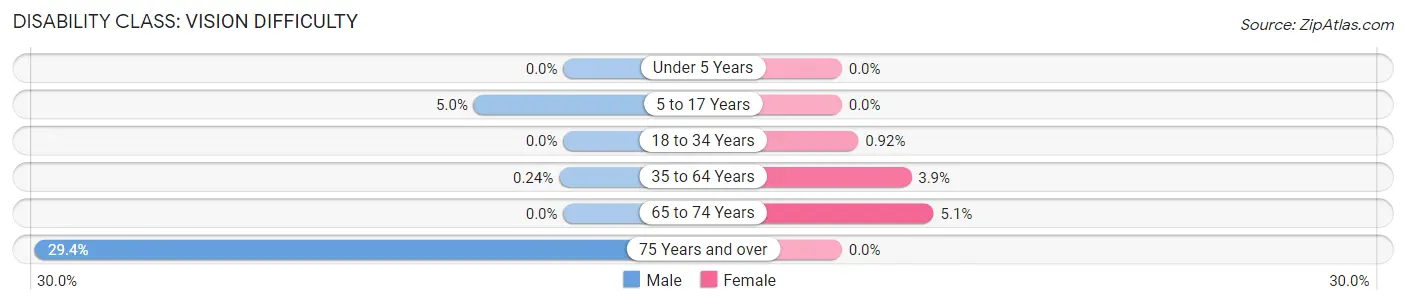
| Age Bracket | Male | Female |
| Under 5 Years | 0 (0.0%) | 0 (0.0%) |
| 5 to 17 Years | 25 (5.0%) | 0 (0.0%) |
| 18 to 34 Years | 0 (0.0%) | 7 (0.9%) |
| 35 to 64 Years | 2 (0.2%) | 38 (3.9%) |
| 65 to 74 Years | 0 (0.0%) | 14 (5.1%) |
| 75 Years and over | 40 (29.4%) | 0 (0.0%) |
Disability Class: Cognitive Difficulty
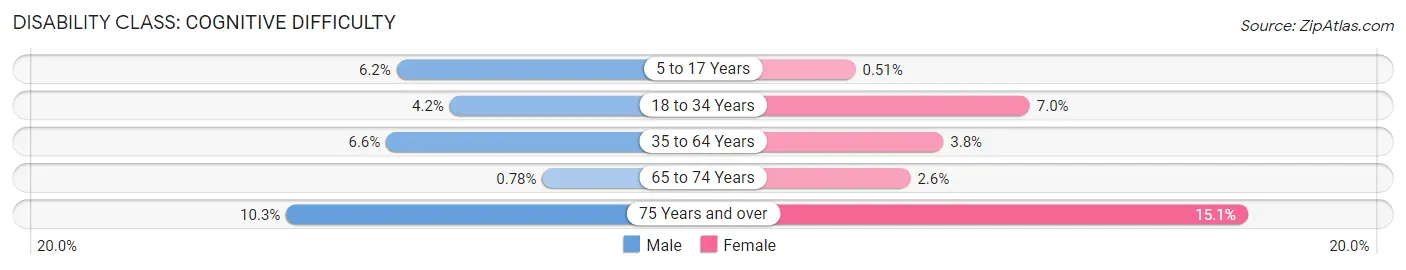
| Age Bracket | Male | Female |
| 5 to 17 Years | 31 (6.2%) | 2 (0.5%) |
| 18 to 34 Years | 27 (4.2%) | 53 (7.0%) |
| 35 to 64 Years | 55 (6.6%) | 37 (3.8%) |
| 65 to 74 Years | 2 (0.8%) | 7 (2.5%) |
| 75 Years and over | 14 (10.3%) | 64 (15.1%) |
Disability Class: Ambulatory Difficulty
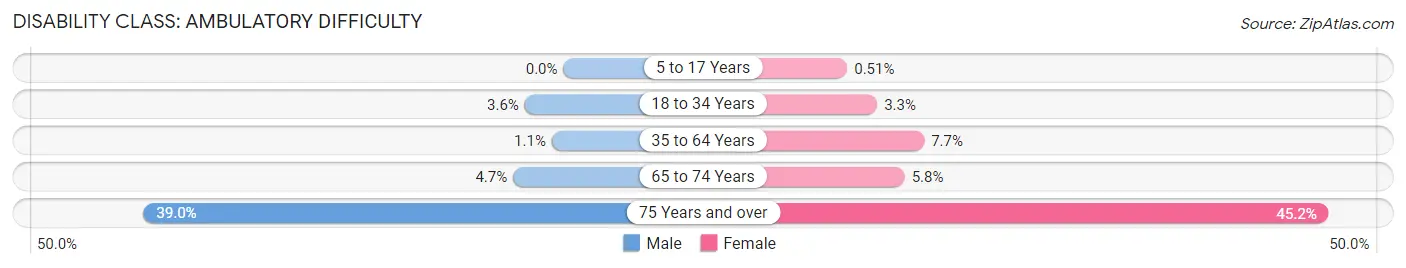
| Age Bracket | Male | Female |
| 5 to 17 Years | 0 (0.0%) | 2 (0.5%) |
| 18 to 34 Years | 23 (3.6%) | 25 (3.3%) |
| 35 to 64 Years | 9 (1.1%) | 75 (7.6%) |
| 65 to 74 Years | 12 (4.7%) | 16 (5.8%) |
| 75 Years and over | 53 (39.0%) | 192 (45.2%) |
Disability Class: Self-Care Difficulty
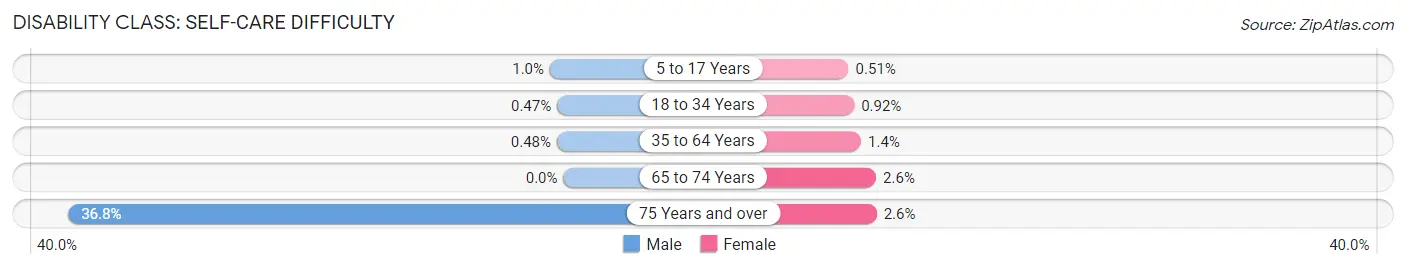
| Age Bracket | Male | Female |
| 5 to 17 Years | 5 (1.0%) | 2 (0.5%) |
| 18 to 34 Years | 3 (0.5%) | 7 (0.9%) |
| 35 to 64 Years | 4 (0.5%) | 14 (1.4%) |
| 65 to 74 Years | 0 (0.0%) | 7 (2.5%) |
| 75 Years and over | 50 (36.8%) | 11 (2.6%) |
Technology Access in Tracyton
Computing Device Access in Tracyton
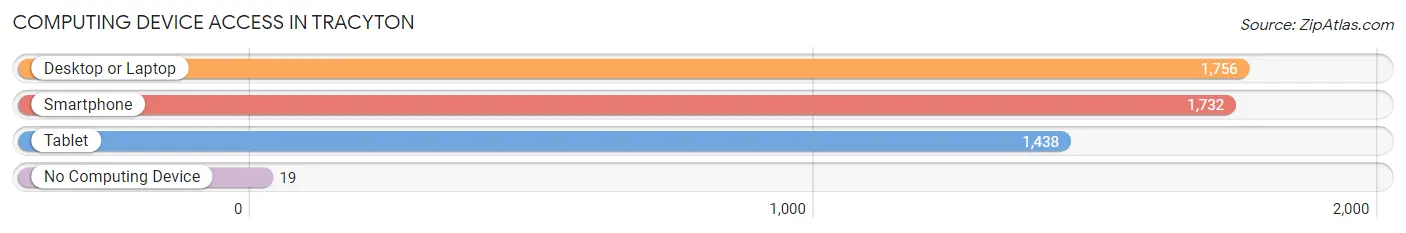
| Device Type | # Households | % Households |
| Desktop or Laptop | 1,756 | 88.3% |
| Smartphone | 1,732 | 87.1% |
| Tablet | 1,438 | 72.3% |
| No Computing Device | 19 | 1.0% |
| Total | 1,988 | 100.0% |
Internet Access in Tracyton
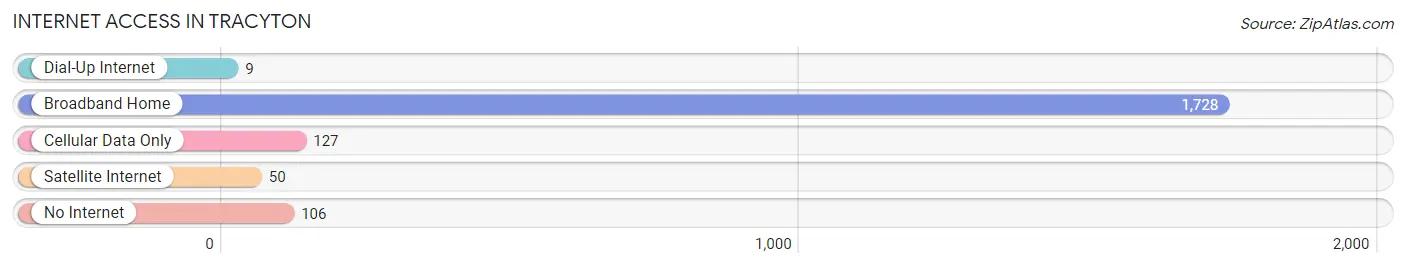
| Internet Type | # Households | % Households |
| Dial-Up Internet | 9 | 0.4% |
| Broadband Home | 1,728 | 86.9% |
| Cellular Data Only | 127 | 6.4% |
| Satellite Internet | 50 | 2.5% |
| No Internet | 106 | 5.3% |
| Total | 1,988 | 100.0% |
Tracyton Summary
Tracyton is a small unincorporated community located in Kitsap County, Washington, United States. It is located on the Kitsap Peninsula, just north of the city of Bremerton. The population of Tracyton was estimated to be 4,845 in 2019.
History
Tracyton was first settled in the late 1800s by a group of homesteaders who were drawn to the area by its abundant natural resources. The area was originally known as "Tracy's Town" after the first settler, William Tracy. The town was officially incorporated in 1909 and was named after Tracy.
Tracyton was a small farming community until the 1940s, when the Puget Sound Naval Shipyard was built nearby. This brought an influx of workers to the area, and the population of Tracyton grew rapidly. The town was also home to a number of small businesses, including a sawmill, a general store, and a post office.
Geography
Tracyton is located on the Kitsap Peninsula, just north of the city of Bremerton. It is bordered by the Hood Canal to the west, the Dyes Inlet to the north, and the Sinclair Inlet to the east. The town is situated at an elevation of approximately 20 feet above sea level.
The climate in Tracyton is mild and temperate, with warm summers and cool winters. The average annual temperature is around 50 degrees Fahrenheit, and the average annual precipitation is around 40 inches.
Economy
Tracyton's economy is largely based on the Puget Sound Naval Shipyard, which is located nearby. The shipyard is the largest employer in the area, and it provides jobs for many of the town's residents. Other major employers in the area include the Bremerton School District, the Kitsap County government, and the Naval Undersea Warfare Center.
Tracyton is also home to a number of small businesses, including restaurants, retail stores, and service providers. The town is also home to a number of recreational activities, including fishing, boating, and hiking.
Demographics
As of 2019, the population of Tracyton was estimated to be 4,845. The racial makeup of the town was 87.3% White, 5.2% Hispanic or Latino, 2.2% Asian, 1.7% African American, and 0.8% Native American. The median household income in Tracyton was $60,945 in 2019, and the median home value was $310,000.
Conclusion
Tracyton is a small unincorporated community located in Kitsap County, Washington. It was first settled in the late 1800s and was officially incorporated in 1909. The town is largely dependent on the nearby Puget Sound Naval Shipyard for its economy, and it is home to a number of small businesses. The population of Tracyton was estimated to be 4,845 in 2019, and the median household income was $60,945.
Common Questions
What is Per Capita Income in Tracyton?
Per Capita income in Tracyton is $44,677.
What is the Median Family Income in Tracyton?
Median Family Income in Tracyton is $101,000.
What is the Median Household income in Tracyton?
Median Household Income in Tracyton is $87,955.
What is Income or Wage Gap in Tracyton?
Income or Wage Gap in Tracyton is 30.5%.
Women in Tracyton earn 69.5 cents for every dollar earned by a man.
What is Inequality or Gini Index in Tracyton?
Inequality or Gini Index in Tracyton is 0.46.
What is the Total Population of Tracyton?
Total Population of Tracyton is 5,614.
What is the Total Male Population of Tracyton?
Total Male Population of Tracyton is 2,677.
What is the Total Female Population of Tracyton?
Total Female Population of Tracyton is 2,937.
What is the Ratio of Males per 100 Females in Tracyton?
There are 91.15 Males per 100 Females in Tracyton.
What is the Ratio of Females per 100 Males in Tracyton?
There are 109.71 Females per 100 Males in Tracyton.
What is the Median Population Age in Tracyton?
Median Population Age in Tracyton is 39.4 Years.
What is the Average Family Size in Tracyton
Average Family Size in Tracyton is 3.4 People.
What is the Average Household Size in Tracyton
Average Household Size in Tracyton is 2.8 People.
How Large is the Labor Force in Tracyton?
There are 2,784 People in the Labor Forcein in Tracyton.
What is the Percentage of People in the Labor Force in Tracyton?
61.5% of People are in the Labor Force in Tracyton.
What is the Unemployment Rate in Tracyton?
Unemployment Rate in Tracyton is 2.7%.