Cities with the Lowest Costs of Housing as Percentage of Income in Washington
RELATED REPORTS & OPTIONS
Lowest Housing Costs / Income
Washington
Compare Cities
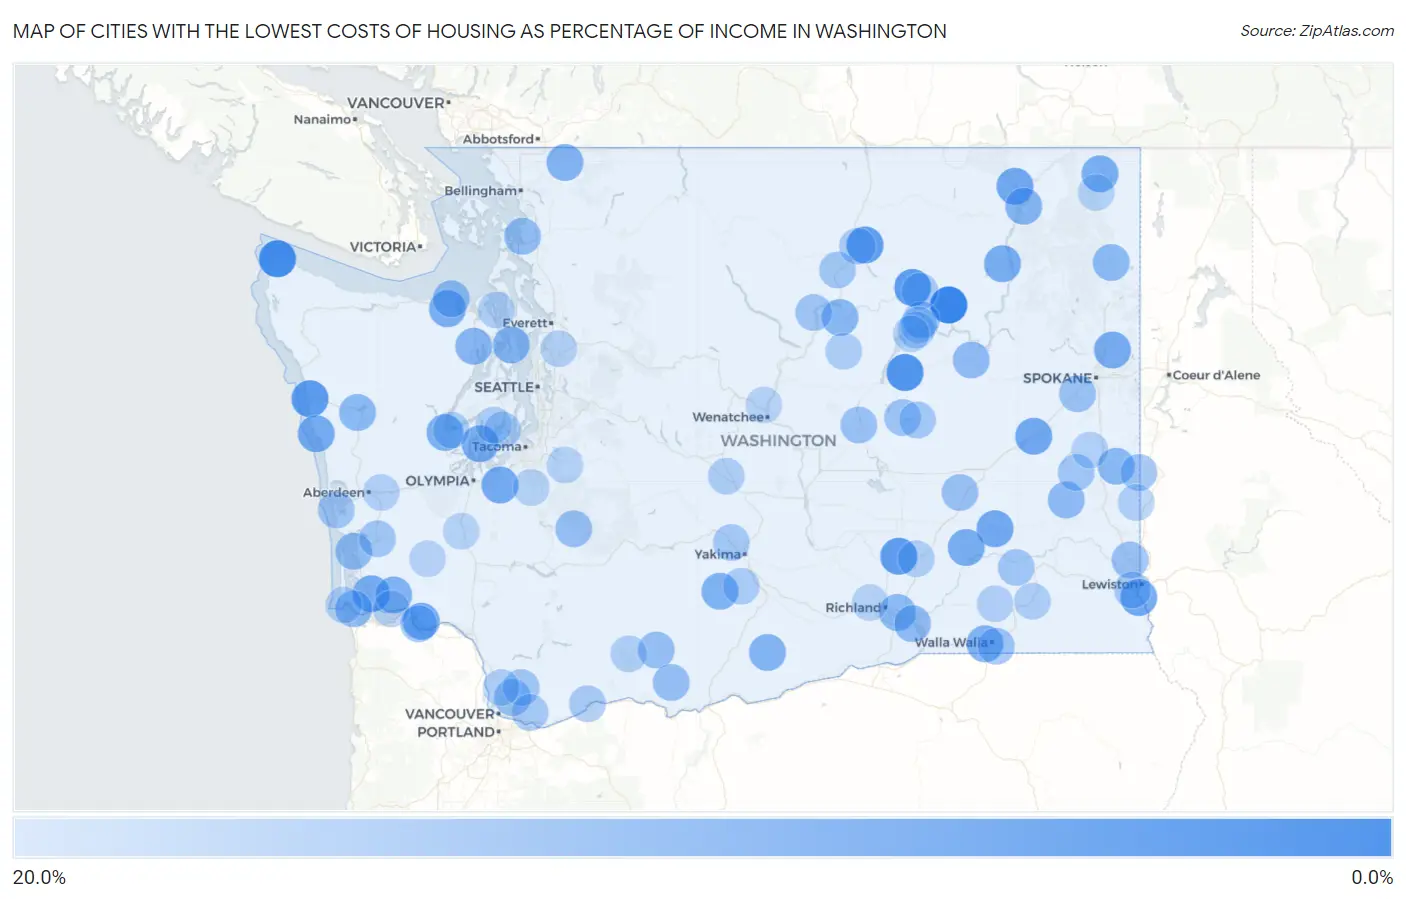
Map of Cities with the Lowest Costs of Housing as Percentage of Income in Washington
20.0%
0.0%
Cities with the Lowest Costs of Housing as Percentage of Income in Washington
| City | Housing Costs / Income | vs State | vs National | |
| 1. | Keller | 3.1% | 22.0%(-18.9)#1 | 20.4%(-17.3)#12 |
| 2. | Neah Bay | 4.5% | 22.0%(-17.5)#2 | 20.4%(-15.9)#46 |
| 3. | Hartline | 5.8% | 22.0%(-16.2)#3 | 20.4%(-14.6)#142 |
| 4. | Nespelem Community | 6.9% | 22.0%(-15.1)#4 | 20.4%(-13.5)#304 |
| 5. | Queets | 6.9% | 22.0%(-15.1)#5 | 20.4%(-13.5)#310 |
| 6. | North Omak | 7.2% | 22.0%(-14.8)#6 | 20.4%(-13.2)#375 |
| 7. | Basin City | 7.3% | 22.0%(-14.7)#7 | 20.4%(-13.1)#387 |
| 8. | Asotin | 8.9% | 22.0%(-13.0)#8 | 20.4%(-11.4)#869 |
| 9. | Barstow | 9.0% | 22.0%(-13.0)#9 | 20.4%(-11.4)#880 |
| 10. | Washtucna | 9.0% | 22.0%(-13.0)#10 | 20.4%(-11.4)#895 |
| 11. | Sprague | 9.1% | 22.0%(-12.9)#11 | 20.4%(-11.3)#916 |
| 12. | Nisqually Indian Community | 9.4% | 22.0%(-12.6)#12 | 20.4%(-11.0)#1,053 |
| 13. | East Cathlamet | 9.4% | 22.0%(-12.6)#13 | 20.4%(-11.0)#1,077 |
| 14. | Taholah | 9.4% | 22.0%(-12.5)#14 | 20.4%(-10.9)#1,103 |
| 15. | Naselle | 9.5% | 22.0%(-12.5)#15 | 20.4%(-10.9)#1,128 |
| 16. | Green Bluff | 9.7% | 22.0%(-12.3)#16 | 20.4%(-10.7)#1,230 |
| 17. | Inchelium | 9.8% | 22.0%(-12.2)#17 | 20.4%(-10.6)#1,266 |
| 18. | River Road | 9.8% | 22.0%(-12.2)#18 | 20.4%(-10.6)#1,308 |
| 19. | Kahlotus | 9.9% | 22.0%(-12.1)#19 | 20.4%(-10.5)#1,345 |
| 20. | Herron Island | 9.9% | 22.0%(-12.1)#20 | 20.4%(-10.5)#1,367 |
| 21. | Skokomish | 10.0% | 22.0%(-12.0)#21 | 20.4%(-10.4)#1,414 |
| 22. | Metaline | 10.0% | 22.0%(-11.9)#22 | 20.4%(-10.3)#1,430 |
| 23. | Crescent Bar | 10.1% | 22.0%(-11.9)#23 | 20.4%(-10.3)#1,471 |
| 24. | White Swan | 10.4% | 22.0%(-11.6)#24 | 20.4%(-9.97)#1,651 |
| 25. | Garrett | 10.6% | 22.0%(-11.4)#25 | 20.4%(-9.77)#1,804 |
| 26. | Grays River | 10.8% | 22.0%(-11.2)#26 | 20.4%(-9.63)#1,906 |
| 27. | Bickleton | 10.8% | 22.0%(-11.1)#27 | 20.4%(-9.53)#1,975 |
| 28. | Port Gamble Tribal Community | 10.9% | 22.0%(-11.1)#28 | 20.4%(-9.49)#2,006 |
| 29. | Maple Falls | 11.0% | 22.0%(-11.0)#29 | 20.4%(-9.39)#2,085 |
| 30. | Marcus | 11.2% | 22.0%(-10.8)#30 | 20.4%(-9.18)#2,241 |
| 31. | Quilcene | 11.2% | 22.0%(-10.7)#31 | 20.4%(-9.13)#2,286 |
| 32. | Bridgeport | 11.5% | 22.0%(-10.5)#32 | 20.4%(-8.90)#2,490 |
| 33. | Oakesdale | 11.6% | 22.0%(-10.4)#33 | 20.4%(-8.81)#2,580 |
| 34. | Amanda Park | 11.7% | 22.0%(-10.3)#34 | 20.4%(-8.67)#2,715 |
| 35. | Cusick | 11.7% | 22.0%(-10.3)#35 | 20.4%(-8.66)#2,721 |
| 36. | Chinook | 11.8% | 22.0%(-10.2)#36 | 20.4%(-8.62)#2,779 |
| 37. | West Pasco | 11.8% | 22.0%(-10.2)#37 | 20.4%(-8.56)#2,838 |
| 38. | Endicott | 12.1% | 22.0%(-9.92)#38 | 20.4%(-8.32)#3,084 |
| 39. | Creston | 12.1% | 22.0%(-9.84)#39 | 20.4%(-8.24)#3,162 |
| 40. | Finley | 12.1% | 22.0%(-9.83)#40 | 20.4%(-8.24)#3,171 |
| 41. | Bay View | 12.4% | 22.0%(-9.57)#41 | 20.4%(-7.97)#3,466 |
| 42. | Jamestown | 12.4% | 22.0%(-9.54)#42 | 20.4%(-7.94)#3,514 |
| 43. | Bay Center | 12.5% | 22.0%(-9.44)#43 | 20.4%(-7.84)#3,632 |
| 44. | Elmer City | 12.7% | 22.0%(-9.24)#44 | 20.4%(-7.64)#3,864 |
| 45. | Ashford | 12.8% | 22.0%(-9.17)#45 | 20.4%(-7.57)#3,951 |
| 46. | Glenwood | 12.9% | 22.0%(-9.05)#46 | 20.4%(-7.46)#4,088 |
| 47. | Klickitat | 12.9% | 22.0%(-9.05)#47 | 20.4%(-7.45)#4,096 |
| 48. | Erlands Point | 13.0% | 22.0%(-9.02)#48 | 20.4%(-7.43)#4,128 |
| 49. | Lind | 13.0% | 22.0%(-8.97)#49 | 20.4%(-7.37)#4,195 |
| 50. | Colton | 13.1% | 22.0%(-8.90)#50 | 20.4%(-7.30)#4,279 |
| 51. | Four Lakes | 13.2% | 22.0%(-8.75)#51 | 20.4%(-7.16)#4,493 |
| 52. | Brush Prairie | 13.2% | 22.0%(-8.75)#52 | 20.4%(-7.15)#4,505 |
| 53. | Lakeview | 13.4% | 22.0%(-8.62)#53 | 20.4%(-7.02)#4,683 |
| 54. | Walla Walla East | 13.4% | 22.0%(-8.56)#54 | 20.4%(-6.96)#4,772 |
| 55. | Puget Island | 13.5% | 22.0%(-8.52)#55 | 20.4%(-6.93)#4,819 |
| 56. | Wilson Creek | 13.6% | 22.0%(-8.37)#56 | 20.4%(-6.77)#5,055 |
| 57. | Farmington | 13.6% | 22.0%(-8.37)#57 | 20.4%(-6.77)#5,057 |
| 58. | Pateros | 13.6% | 22.0%(-8.34)#58 | 20.4%(-6.74)#5,095 |
| 59. | Starbuck | 13.9% | 22.0%(-8.09)#59 | 20.4%(-6.49)#5,492 |
| 60. | Cohassett Beach | 13.9% | 22.0%(-8.08)#60 | 20.4%(-6.48)#5,503 |
| 61. | St John | 14.0% | 22.0%(-7.98)#61 | 20.4%(-6.38)#5,653 |
| 62. | Sunland Estates | 14.1% | 22.0%(-7.87)#62 | 20.4%(-6.27)#5,849 |
| 63. | Malott | 14.2% | 22.0%(-7.82)#63 | 20.4%(-6.22)#5,945 |
| 64. | Raymond | 14.2% | 22.0%(-7.80)#64 | 20.4%(-6.20)#5,988 |
| 65. | Venersborg | 14.2% | 22.0%(-7.77)#65 | 20.4%(-6.17)#6,035 |
| 66. | Eschbach | 14.3% | 22.0%(-7.64)#66 | 20.4%(-6.04)#6,258 |
| 67. | Clarkston Heights Vineland | 14.4% | 22.0%(-7.59)#67 | 20.4%(-5.99)#6,341 |
| 68. | Krupp Marlin | 14.5% | 22.0%(-7.51)#68 | 20.4%(-5.91)#6,480 |
| 69. | Fern Prairie | 14.6% | 22.0%(-7.41)#69 | 20.4%(-5.81)#6,632 |
| 70. | Nespelem | 14.8% | 22.0%(-7.17)#70 | 20.4%(-5.57)#7,056 |
| 71. | Rosedale | 14.8% | 22.0%(-7.15)#71 | 20.4%(-5.55)#7,080 |
| 72. | Stevenson | 14.9% | 22.0%(-7.12)#72 | 20.4%(-5.52)#7,141 |
| 73. | Omak | 14.9% | 22.0%(-7.07)#73 | 20.4%(-5.47)#7,231 |
| 74. | Grand Coulee | 15.0% | 22.0%(-6.97)#74 | 20.4%(-5.38)#7,385 |
| 75. | Harrah | 15.1% | 22.0%(-6.84)#75 | 20.4%(-5.24)#7,636 |
| 76. | Dayton | 15.2% | 22.0%(-6.81)#76 | 20.4%(-5.21)#7,696 |
| 77. | Stansberry Lake | 15.2% | 22.0%(-6.76)#77 | 20.4%(-5.17)#7,791 |
| 78. | Mesa | 15.2% | 22.0%(-6.75)#78 | 20.4%(-5.15)#7,834 |
| 79. | Union | 15.3% | 22.0%(-6.63)#79 | 20.4%(-5.04)#8,034 |
| 80. | Mansfield | 15.3% | 22.0%(-6.63)#80 | 20.4%(-5.03)#8,049 |
| 81. | Thorp | 15.4% | 22.0%(-6.61)#81 | 20.4%(-5.02)#8,075 |
| 82. | Trout Lake | 15.4% | 22.0%(-6.57)#82 | 20.4%(-4.97)#8,149 |
| 83. | Palouse | 15.4% | 22.0%(-6.52)#83 | 20.4%(-4.93)#8,239 |
| 84. | Duluth | 15.5% | 22.0%(-6.46)#84 | 20.4%(-4.86)#8,385 |
| 85. | Prescott | 15.6% | 22.0%(-6.38)#85 | 20.4%(-4.78)#8,562 |
| 86. | Central Park | 15.6% | 22.0%(-6.38)#86 | 20.4%(-4.78)#8,563 |
| 87. | Malden | 15.6% | 22.0%(-6.35)#87 | 20.4%(-4.75)#8,609 |
| 88. | Marrowstone | 15.6% | 22.0%(-6.32)#88 | 20.4%(-4.73)#8,660 |
| 89. | Ilwaco | 15.7% | 22.0%(-6.24)#89 | 20.4%(-4.65)#8,820 |
| 90. | Clearview | 15.8% | 22.0%(-6.21)#90 | 20.4%(-4.61)#8,878 |
| 91. | Ione | 15.8% | 22.0%(-6.15)#91 | 20.4%(-4.55)#9,004 |
| 92. | Fords Prairie | 15.9% | 22.0%(-6.12)#92 | 20.4%(-4.52)#9,067 |
| 93. | Coulee Dam | 15.9% | 22.0%(-6.10)#93 | 20.4%(-4.50)#9,126 |
| 94. | South Creek | 15.9% | 22.0%(-6.10)#94 | 20.4%(-4.50)#9,132 |
| 95. | South Prairie | 15.9% | 22.0%(-6.04)#95 | 20.4%(-4.45)#9,241 |
| 96. | Electric City | 16.0% | 22.0%(-6.02)#96 | 20.4%(-4.42)#9,308 |
| 97. | Sunnyslope | 16.0% | 22.0%(-5.95)#97 | 20.4%(-4.35)#9,434 |
| 98. | Altoona | 16.1% | 22.0%(-5.91)#98 | 20.4%(-4.32)#9,501 |
| 99. | West Richland | 16.1% | 22.0%(-5.87)#99 | 20.4%(-4.27)#9,615 |
| 100. | Pe Ell | 16.1% | 22.0%(-5.85)#100 | 20.4%(-4.25)#9,655 |
Common Questions
What are the Top 10 Cities with the Lowest Costs of Housing as Percentage of Income in Washington?
Top 10 Cities with the Lowest Costs of Housing as Percentage of Income in Washington are:
#1
3.1%
#2
4.5%
#3
5.8%
#4
6.9%
#5
6.9%
#6
7.2%
#7
7.3%
#8
8.9%
#9
9.0%
#10
9.0%
What city has the Lowest Costs of Housing as Percentage of Income in Washington?
Keller has the Lowest Costs of Housing as Percentage of Income in Washington with 3.1%.
What is the Average Housing Costs as Percentage of Income in the State of Washington?
Average Housing Costs as Percentage of Income in Washington is 22.0%.
What is the Average Housing Costs as Percentage of Income in the United States?
Average Housing Costs as Percentage of Income in the United States is 20.4%.