Cities with the Highest Percentage of Unpaid Family Workers in Washington
RELATED REPORTS & OPTIONS
Unpaid Family Workers
Washington
Compare Cities
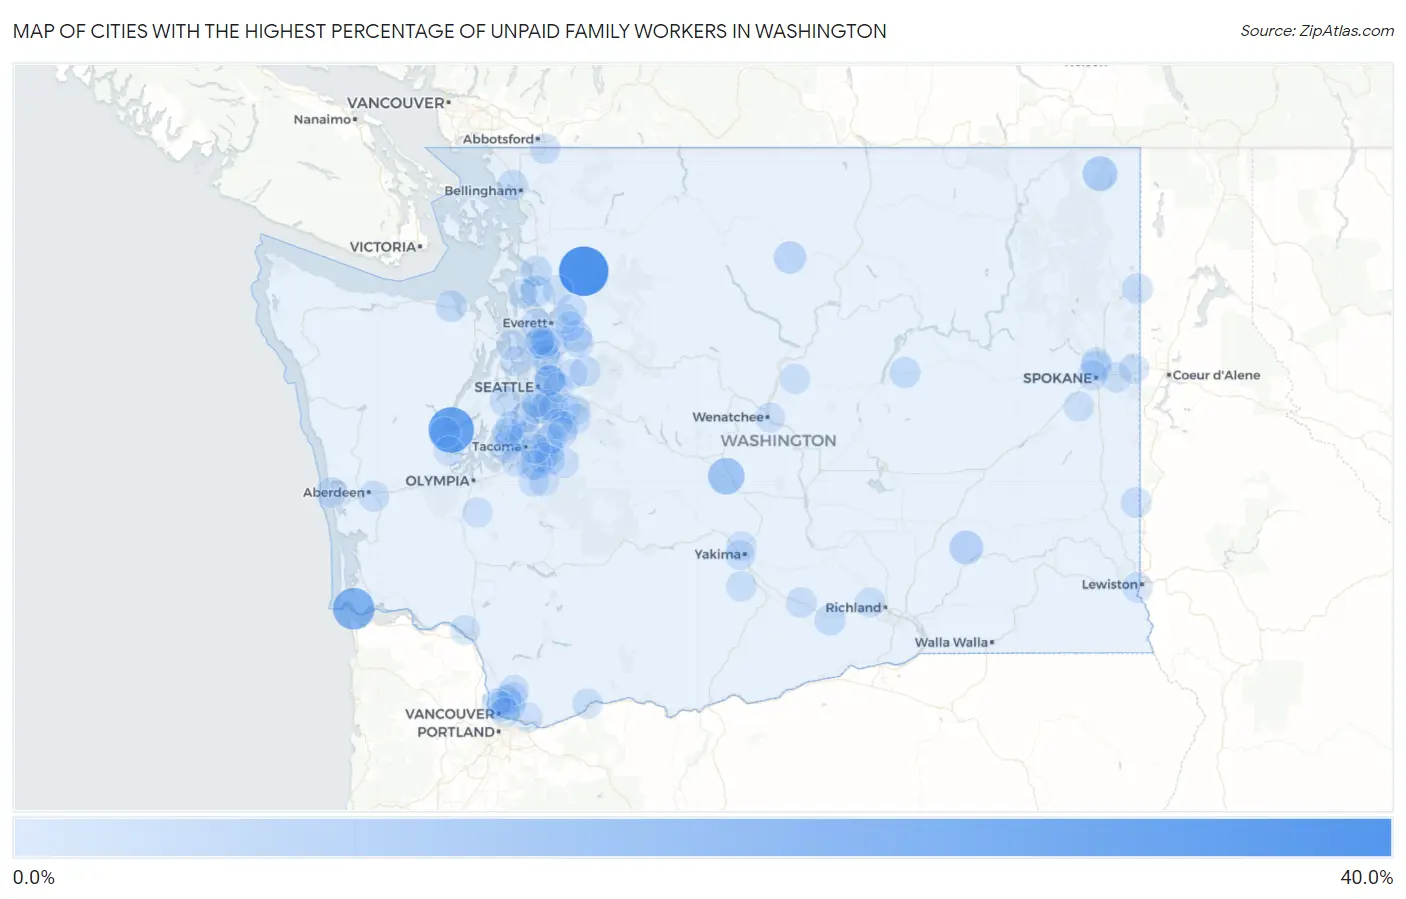
Map of Cities with the Highest Percentage of Unpaid Family Workers in Washington
0.0%
40.0%
Cities with the Highest Percentage of Unpaid Family Workers in Washington
| City | % Unpaid Family Workers | vs State | vs National | |
| 1. | Oso | 37.9% | 0.19%(+37.7)#1 | 0.19%(+37.7)#14 |
| 2. | Union | 29.8% | 0.19%(+29.6)#2 | 0.19%(+29.6)#23 |
| 3. | Chinook | 22.1% | 0.19%(+21.9)#3 | 0.19%(+21.9)#36 |
| 4. | Thorp | 12.2% | 0.19%(+12.0)#4 | 0.19%(+12.0)#81 |
| 5. | Metaline | 8.6% | 0.19%(+8.38)#5 | 0.19%(+8.38)#119 |
| 6. | Kahlotus | 6.8% | 0.19%(+6.59)#6 | 0.19%(+6.59)#173 |
| 7. | Twisp | 4.3% | 0.19%(+4.06)#7 | 0.19%(+4.06)#306 |
| 8. | Warm Beach | 2.8% | 0.19%(+2.61)#8 | 0.19%(+2.61)#506 |
| 9. | Sequim | 2.5% | 0.19%(+2.28)#9 | 0.19%(+2.28)#594 |
| 10. | Browns Point | 2.2% | 0.19%(+1.99)#10 | 0.19%(+2.00)#688 |
| 11. | Lake Ketchum | 2.1% | 0.19%(+1.87)#11 | 0.19%(+1.87)#742 |
| 12. | Chain Lake | 2.0% | 0.19%(+1.82)#12 | 0.19%(+1.82)#767 |
| 13. | Hartline | 1.9% | 0.19%(+1.72)#13 | 0.19%(+1.72)#812 |
| 14. | Prosser | 1.9% | 0.19%(+1.68)#14 | 0.19%(+1.68)#827 |
| 15. | Hunts Point | 1.6% | 0.19%(+1.44)#15 | 0.19%(+1.44)#959 |
| 16. | East Port Orchard | 1.6% | 0.19%(+1.38)#16 | 0.19%(+1.38)#992 |
| 17. | Lake Marcel Stillwater | 1.5% | 0.19%(+1.34)#17 | 0.19%(+1.34)#1,026 |
| 18. | Newport | 1.5% | 0.19%(+1.32)#18 | 0.19%(+1.32)#1,038 |
| 19. | Marietta Alderwood | 1.3% | 0.19%(+1.10)#19 | 0.19%(+1.10)#1,232 |
| 20. | Fairwood Cdp King County | 1.3% | 0.19%(+1.08)#20 | 0.19%(+1.08)#1,259 |
| 21. | Lochsloy | 1.3% | 0.19%(+1.07)#21 | 0.19%(+1.08)#1,260 |
| 22. | Palouse | 1.2% | 0.19%(+1.03)#22 | 0.19%(+1.04)#1,305 |
| 23. | Town And Country | 1.1% | 0.19%(+0.954)#23 | 0.19%(+0.956)#1,386 |
| 24. | Cosmopolis | 1.1% | 0.19%(+0.954)#24 | 0.19%(+0.956)#1,387 |
| 25. | Mill Creek | 1.1% | 0.19%(+0.949)#25 | 0.19%(+0.951)#1,393 |
| 26. | Prairie Heights | 1.1% | 0.19%(+0.929)#26 | 0.19%(+0.931)#1,414 |
| 27. | Sumas | 1.1% | 0.19%(+0.886)#27 | 0.19%(+0.888)#1,458 |
| 28. | Ocean Shores | 1.00% | 0.19%(+0.807)#28 | 0.19%(+0.809)#1,572 |
| 29. | Roche Harbor | 0.98% | 0.19%(+0.788)#29 | 0.19%(+0.790)#1,605 |
| 30. | Clyde Hill | 0.96% | 0.19%(+0.772)#30 | 0.19%(+0.774)#1,635 |
| 31. | Brush Prairie | 0.95% | 0.19%(+0.766)#31 | 0.19%(+0.768)#1,642 |
| 32. | Clinton | 0.92% | 0.19%(+0.731)#32 | 0.19%(+0.733)#1,699 |
| 33. | Maplewood | 0.91% | 0.19%(+0.720)#33 | 0.19%(+0.722)#1,716 |
| 34. | Skokomish | 0.91% | 0.19%(+0.720)#34 | 0.19%(+0.722)#1,717 |
| 35. | Sunnyside | 0.79% | 0.19%(+0.602)#35 | 0.19%(+0.604)#1,919 |
| 36. | Monroe | 0.73% | 0.19%(+0.541)#36 | 0.19%(+0.543)#2,063 |
| 37. | Vashon | 0.73% | 0.19%(+0.540)#37 | 0.19%(+0.542)#2,066 |
| 38. | Stevenson | 0.69% | 0.19%(+0.506)#38 | 0.19%(+0.508)#2,145 |
| 39. | Harrah | 0.67% | 0.19%(+0.480)#39 | 0.19%(+0.482)#2,208 |
| 40. | Tukwila | 0.63% | 0.19%(+0.444)#40 | 0.19%(+0.446)#2,305 |
| 41. | West Clarkston Highland | 0.62% | 0.19%(+0.434)#41 | 0.19%(+0.436)#2,330 |
| 42. | Algona | 0.60% | 0.19%(+0.414)#42 | 0.19%(+0.416)#2,394 |
| 43. | Sumner | 0.60% | 0.19%(+0.410)#43 | 0.19%(+0.412)#2,406 |
| 44. | Kenmore | 0.55% | 0.19%(+0.365)#44 | 0.19%(+0.367)#2,538 |
| 45. | Puyallup | 0.55% | 0.19%(+0.358)#45 | 0.19%(+0.360)#2,571 |
| 46. | Elk Plain | 0.54% | 0.19%(+0.351)#46 | 0.19%(+0.353)#2,599 |
| 47. | Burien | 0.54% | 0.19%(+0.347)#47 | 0.19%(+0.349)#2,619 |
| 48. | Five Corners | 0.53% | 0.19%(+0.343)#48 | 0.19%(+0.345)#2,630 |
| 49. | Barberton | 0.51% | 0.19%(+0.319)#49 | 0.19%(+0.321)#2,721 |
| 50. | Brier | 0.49% | 0.19%(+0.303)#50 | 0.19%(+0.305)#2,794 |
| 51. | Wollochet | 0.48% | 0.19%(+0.295)#51 | 0.19%(+0.297)#2,827 |
| 52. | North Lynnwood | 0.48% | 0.19%(+0.292)#52 | 0.19%(+0.294)#2,838 |
| 53. | Cheney | 0.48% | 0.19%(+0.290)#53 | 0.19%(+0.292)#2,843 |
| 54. | Waterville | 0.47% | 0.19%(+0.277)#54 | 0.19%(+0.279)#2,903 |
| 55. | Fox Island | 0.46% | 0.19%(+0.273)#55 | 0.19%(+0.275)#2,930 |
| 56. | Alderton | 0.46% | 0.19%(+0.271)#56 | 0.19%(+0.273)#2,936 |
| 57. | Bryn Mawr Skyway | 0.46% | 0.19%(+0.270)#57 | 0.19%(+0.272)#2,941 |
| 58. | Battle Ground | 0.45% | 0.19%(+0.264)#58 | 0.19%(+0.266)#2,968 |
| 59. | East Renton Highlands | 0.45% | 0.19%(+0.264)#59 | 0.19%(+0.266)#2,970 |
| 60. | Clover Creek | 0.45% | 0.19%(+0.257)#60 | 0.19%(+0.259)#3,003 |
| 61. | Mirrormont | 0.41% | 0.19%(+0.225)#61 | 0.19%(+0.227)#3,123 |
| 62. | Country Homes | 0.39% | 0.19%(+0.200)#62 | 0.19%(+0.202)#3,241 |
| 63. | Lake Stevens | 0.39% | 0.19%(+0.198)#63 | 0.19%(+0.200)#3,255 |
| 64. | West Richland | 0.38% | 0.19%(+0.193)#64 | 0.19%(+0.195)#3,280 |
| 65. | Hobart | 0.37% | 0.19%(+0.180)#65 | 0.19%(+0.182)#3,343 |
| 66. | Spokane Valley | 0.36% | 0.19%(+0.172)#66 | 0.19%(+0.174)#3,394 |
| 67. | White Center | 0.35% | 0.19%(+0.163)#67 | 0.19%(+0.165)#3,443 |
| 68. | Otis Orchards East Farms | 0.35% | 0.19%(+0.156)#68 | 0.19%(+0.158)#3,477 |
| 69. | Hazel Dell | 0.34% | 0.19%(+0.151)#69 | 0.19%(+0.153)#3,508 |
| 70. | Yarrow Point | 0.33% | 0.19%(+0.144)#70 | 0.19%(+0.146)#3,536 |
| 71. | Renton | 0.33% | 0.19%(+0.137)#71 | 0.19%(+0.139)#3,578 |
| 72. | Summit View | 0.33% | 0.19%(+0.136)#72 | 0.19%(+0.138)#3,584 |
| 73. | Gig Harbor | 0.32% | 0.19%(+0.133)#73 | 0.19%(+0.135)#3,601 |
| 74. | Auburn | 0.32% | 0.19%(+0.133)#74 | 0.19%(+0.135)#3,608 |
| 75. | Selah | 0.31% | 0.19%(+0.126)#75 | 0.19%(+0.128)#3,652 |
| 76. | Meadowdale | 0.31% | 0.19%(+0.124)#76 | 0.19%(+0.126)#3,658 |
| 77. | Graham | 0.31% | 0.19%(+0.124)#77 | 0.19%(+0.126)#3,659 |
| 78. | Tenino | 0.31% | 0.19%(+0.116)#78 | 0.19%(+0.118)#3,707 |
| 79. | Indianola | 0.29% | 0.19%(+0.106)#79 | 0.19%(+0.108)#3,771 |
| 80. | Port Gamble Tribal Community | 0.29% | 0.19%(+0.100)#80 | 0.19%(+0.102)#3,799 |
| 81. | Covington | 0.27% | 0.19%(+0.085)#81 | 0.19%(+0.087)#3,896 |
| 82. | Yakima | 0.27% | 0.19%(+0.085)#82 | 0.19%(+0.087)#3,898 |
| 83. | Camas | 0.27% | 0.19%(+0.079)#83 | 0.19%(+0.081)#3,932 |
| 84. | Union Hill Novelty Hill | 0.25% | 0.19%(+0.061)#84 | 0.19%(+0.063)#4,063 |
| 85. | Fife | 0.24% | 0.19%(+0.049)#85 | 0.19%(+0.051)#4,160 |
| 86. | Lake Stickney | 0.22% | 0.19%(+0.035)#86 | 0.19%(+0.037)#4,250 |
| 87. | Bellevue | 0.22% | 0.19%(+0.033)#87 | 0.19%(+0.035)#4,265 |
| 88. | Spokane | 0.22% | 0.19%(+0.031)#88 | 0.19%(+0.033)#4,280 |
| 89. | Shelton | 0.22% | 0.19%(+0.030)#89 | 0.19%(+0.032)#4,291 |
| 90. | Camano | 0.22% | 0.19%(+0.027)#90 | 0.19%(+0.029)#4,317 |
| 91. | Lakewood | 0.21% | 0.19%(+0.020)#91 | 0.19%(+0.022)#4,372 |
| 92. | Arlington | 0.21% | 0.19%(+0.016)#92 | 0.19%(+0.018)#4,405 |
| 93. | Longview | 0.20% | 0.19%(+0.016)#93 | 0.19%(+0.018)#4,408 |
| 94. | Everett | 0.20% | 0.19%(+0.014)#94 | 0.19%(+0.016)#4,428 |
| 95. | Lake Shore | 0.20% | 0.19%(+0.011)#95 | 0.19%(+0.013)#4,449 |
| 96. | Vancouver | 0.20% | 0.19%(+0.007)#96 | 0.19%(+0.009)#4,492 |
| 97. | Kent | 0.20% | 0.19%(+0.007)#97 | 0.19%(+0.009)#4,493 |
| 98. | Picnic Point | 0.19% | 0.19%(+0.006)#98 | 0.19%(+0.008)#4,501 |
| 99. | Lake Morton Berrydale | 0.19% | 0.19%(+0.005)#99 | 0.19%(+0.007)#4,503 |
| 100. | East Wenatchee | 0.19% | 0.19%(+0.004)#100 | 0.19%(+0.006)#4,522 |
Common Questions
What are the Top 10 Cities with the Highest Percentage of Unpaid Family Workers in Washington?
Top 10 Cities with the Highest Percentage of Unpaid Family Workers in Washington are:
#1
37.9%
#2
29.8%
#3
22.1%
#4
12.2%
#5
8.6%
#6
6.8%
#7
4.3%
#8
2.8%
#9
2.5%
#10
2.2%
What city has the Highest Percentage of Unpaid Family Workers in Washington?
Oso has the Highest Percentage of Unpaid Family Workers in Washington with 37.9%.
What is the Percentage of Unpaid Family Workers in the State of Washington?
Percentage of Unpaid Family Workers in Washington is 0.19%.
What is the Percentage of Unpaid Family Workers in the United States?
Percentage of Unpaid Family Workers in the United States is 0.19%.