Cities with the Highest Percentage of Immigrants from Guatemala in Washington
RELATED REPORTS & OPTIONS
Guatemala
Washington
Compare Cities
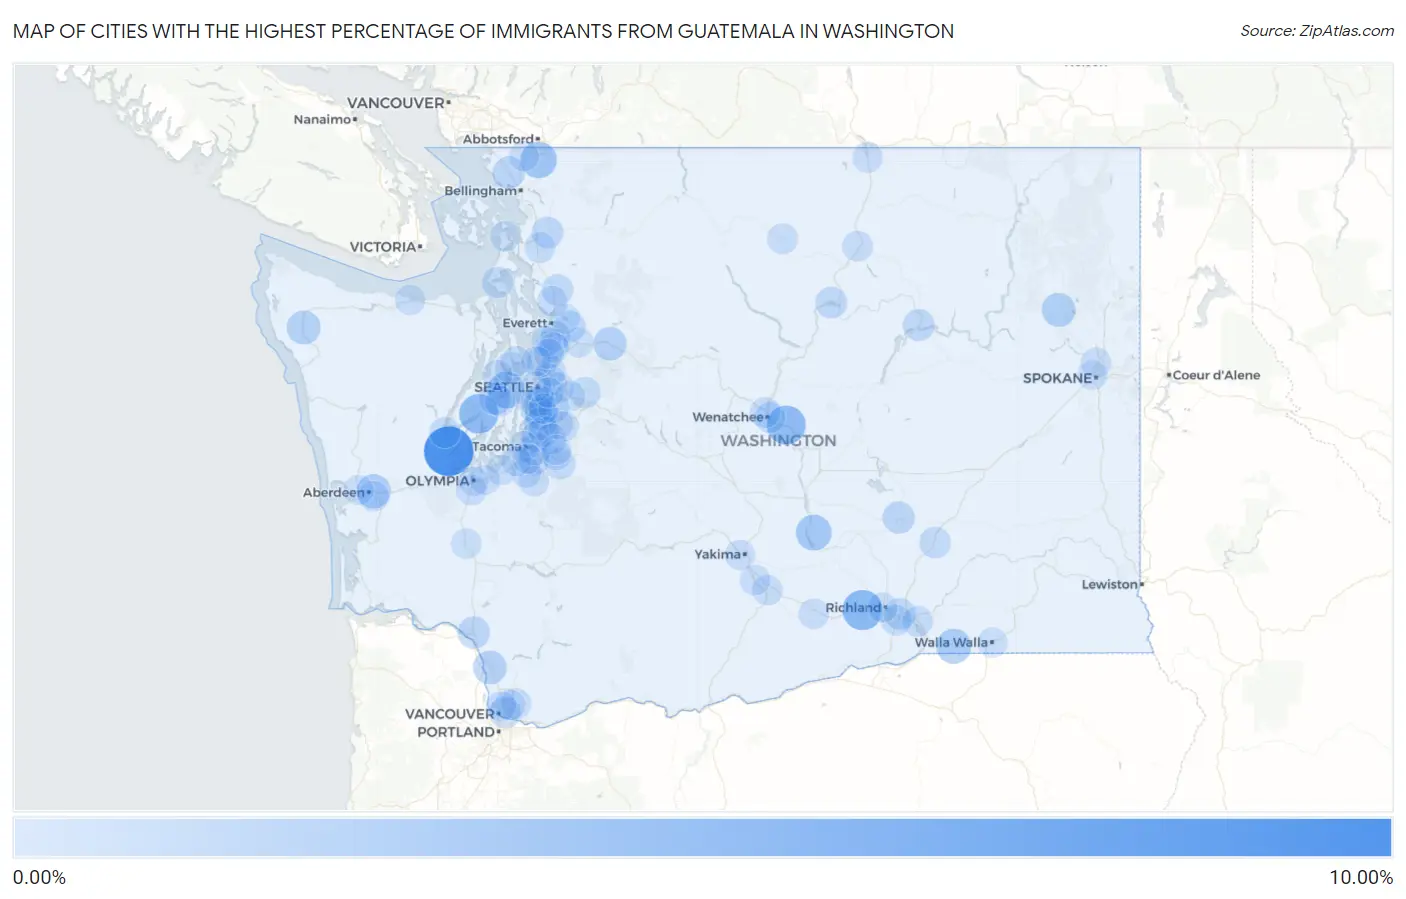
Map of Cities with the Highest Percentage of Immigrants from Guatemala in Washington
0.00%
10.00%
Cities with the Highest Percentage of Immigrants from Guatemala in Washington
| City | Guatemala | vs State | vs National | |
| 1. | Shelton | 9.42% | 0.18%(+9.24)#-1 | 0.32%(+9.11)#0 |
| 2. | Benton City | 4.72% | 0.18%(+4.54)#0 | 0.32%(+4.40)#1 |
| 3. | Belfair | 4.31% | 0.18%(+4.13)#1 | 0.32%(+3.99)#2 |
| 4. | Rock Island | 4.21% | 0.18%(+4.03)#2 | 0.32%(+3.89)#3 |
| 5. | Enetai | 3.16% | 0.18%(+2.98)#3 | 0.32%(+2.84)#4 |
| 6. | Nooksack | 2.94% | 0.18%(+2.76)#4 | 0.32%(+2.62)#5 |
| 7. | Mattawa | 2.62% | 0.18%(+2.44)#5 | 0.32%(+2.31)#6 |
| 8. | Touchet | 2.27% | 0.18%(+2.09)#6 | 0.32%(+1.95)#7 |
| 9. | Aberdeen | 1.94% | 0.18%(+1.76)#7 | 0.32%(+1.63)#8 |
| 10. | Springdale | 1.75% | 0.18%(+1.57)#8 | 0.32%(+1.44)#9 |
| 11. | Forks | 1.75% | 0.18%(+1.57)#9 | 0.32%(+1.43)#10 |
| 12. | Woodland | 1.61% | 0.18%(+1.43)#10 | 0.32%(+1.29)#11 |
| 13. | Gold Bar | 1.58% | 0.18%(+1.40)#11 | 0.32%(+1.26)#12 |
| 14. | Fife | 1.10% | 0.18%(+0.922)#12 | 0.32%(+0.785)#13 |
| 15. | Ferndale | 1.04% | 0.18%(+0.857)#13 | 0.32%(+0.720)#14 |
| 16. | Seatac | 0.99% | 0.18%(+0.812)#65 | 0.32%(+0.675)#3,005 |
| 17. | Kelso | 0.98% | 0.18%(+0.799)#66 | 0.32%(+0.662)#3,006 |
| 18. | Bremerton | 0.95% | 0.18%(+0.775)#67 | 0.32%(+0.637)#3,007 |
| 19. | Othello | 0.94% | 0.18%(+0.764)#68 | 0.32%(+0.626)#3,008 |
| 20. | Burien | 0.88% | 0.18%(+0.703)#69 | 0.32%(+0.566)#3,009 |
| 21. | Des Moines | 0.81% | 0.18%(+0.631)#70 | 0.32%(+0.493)#3,010 |
| 22. | Brewster | 0.76% | 0.18%(+0.578)#71 | 0.32%(+0.441)#3,011 |
| 23. | Coulee Dam | 0.75% | 0.18%(+0.569)#72 | 0.32%(+0.432)#3,012 |
| 24. | Sedro Woolley | 0.75% | 0.18%(+0.566)#73 | 0.32%(+0.428)#3,013 |
| 25. | Pasco | 0.71% | 0.18%(+0.526)#74 | 0.32%(+0.389)#3,014 |
| 26. | Everett | 0.68% | 0.18%(+0.505)#75 | 0.32%(+0.367)#3,015 |
| 27. | Connell | 0.68% | 0.18%(+0.496)#76 | 0.32%(+0.359)#3,016 |
| 28. | Vancouver | 0.64% | 0.18%(+0.462)#77 | 0.32%(+0.324)#3,017 |
| 29. | Arlington | 0.64% | 0.18%(+0.456)#78 | 0.32%(+0.319)#3,018 |
| 30. | Hunts Point | 0.62% | 0.18%(+0.439)#79 | 0.32%(+0.301)#3,019 |
| 31. | Coupeville | 0.54% | 0.18%(+0.359)#80 | 0.32%(+0.221)#3,020 |
| 32. | Lake Forest Park | 0.51% | 0.18%(+0.332)#81 | 0.32%(+0.195)#3,021 |
| 33. | Fall City | 0.50% | 0.18%(+0.315)#82 | 0.32%(+0.178)#3,022 |
| 34. | Federal Way | 0.47% | 0.18%(+0.292)#83 | 0.32%(+0.154)#3,023 |
| 35. | Mill Creek | 0.47% | 0.18%(+0.286)#84 | 0.32%(+0.149)#3,024 |
| 36. | Prairie Ridge | 0.47% | 0.18%(+0.286)#85 | 0.32%(+0.148)#3,025 |
| 37. | Skokomish | 0.47% | 0.18%(+0.286)#86 | 0.32%(+0.148)#3,026 |
| 38. | Kent | 0.45% | 0.18%(+0.270)#87 | 0.32%(+0.132)#3,027 |
| 39. | East Wenatchee | 0.45% | 0.18%(+0.268)#88 | 0.32%(+0.130)#3,028 |
| 40. | Boulevard Park | 0.41% | 0.18%(+0.228)#89 | 0.32%(+0.090)#3,029 |
| 41. | Kennewick | 0.41% | 0.18%(+0.227)#90 | 0.32%(+0.089)#3,030 |
| 42. | Mount Vernon | 0.39% | 0.18%(+0.210)#91 | 0.32%(+0.072)#3,031 |
| 43. | White Center | 0.38% | 0.18%(+0.201)#92 | 0.32%(+0.063)#3,032 |
| 44. | Summit | 0.36% | 0.18%(+0.183)#93 | 0.32%(+0.045)#3,033 |
| 45. | Burbank | 0.35% | 0.18%(+0.175)#94 | 0.32%(+0.037)#3,034 |
| 46. | Wenatchee | 0.32% | 0.18%(+0.139)#95 | 0.32%(+0.002)#3,035 |
| 47. | Lakeland North | 0.31% | 0.18%(+0.127)#96 | 0.32%(-0.010)#3,036 |
| 48. | Renton | 0.30% | 0.18%(+0.120)#97 | 0.32%(-0.018)#3,037 |
| 49. | Toppenish | 0.25% | 0.18%(+0.069)#98 | 0.32%(-0.068)#3,038 |
| 50. | Omak | 0.25% | 0.18%(+0.066)#99 | 0.32%(-0.072)#3,039 |
| 51. | Winthrop | 0.25% | 0.18%(+0.065)#100 | 0.32%(-0.073)#3,040 |
| 52. | Auburn | 0.23% | 0.18%(+0.051)#101 | 0.32%(-0.086)#3,041 |
| 53. | Oroville | 0.23% | 0.18%(+0.048)#102 | 0.32%(-0.090)#3,042 |
| 54. | Cosmopolis | 0.22% | 0.18%(+0.042)#103 | 0.32%(-0.096)#3,043 |
| 55. | Bellevue | 0.21% | 0.18%(+0.030)#104 | 0.32%(-0.107)#3,044 |
| 56. | Elk Plain | 0.20% | 0.18%(+0.024)#105 | 0.32%(-0.114)#3,045 |
| 57. | Marysville | 0.20% | 0.18%(+0.023)#106 | 0.32%(-0.114)#3,046 |
| 58. | Tumwater | 0.20% | 0.18%(+0.023)#107 | 0.32%(-0.115)#3,047 |
| 59. | Orchards | 0.20% | 0.18%(+0.018)#108 | 0.32%(-0.119)#3,048 |
| 60. | Wapato | 0.20% | 0.18%(+0.015)#109 | 0.32%(-0.122)#3,049 |
| 61. | Suquamish | 0.18% | 0.18%(+0.005)#110 | 0.32%(-0.133)#3,050 |
| 62. | Dupont | 0.18% | 0.18%(+0.001)#111 | 0.32%(-0.137)#3,051 |
| 63. | Yakima | 0.18% | 0.18%(-0.001)#112 | 0.32%(-0.139)#3,052 |
| 64. | Grandview | 0.17% | 0.18%(-0.006)#113 | 0.32%(-0.144)#3,053 |
| 65. | Kirkland | 0.17% | 0.18%(-0.010)#114 | 0.32%(-0.147)#3,054 |
| 66. | Port Orchard | 0.16% | 0.18%(-0.022)#115 | 0.32%(-0.160)#3,055 |
| 67. | Chehalis | 0.15% | 0.18%(-0.034)#116 | 0.32%(-0.171)#3,056 |
| 68. | Seattle | 0.12% | 0.18%(-0.061)#117 | 0.32%(-0.198)#3,057 |
| 69. | Tacoma | 0.12% | 0.18%(-0.064)#118 | 0.32%(-0.202)#3,058 |
| 70. | Covington | 0.12% | 0.18%(-0.065)#119 | 0.32%(-0.202)#3,059 |
| 71. | Five Corners | 0.11% | 0.18%(-0.065)#120 | 0.32%(-0.203)#3,060 |
| 72. | Indianola | 0.11% | 0.18%(-0.068)#121 | 0.32%(-0.205)#3,061 |
| 73. | Eastmont | 0.11% | 0.18%(-0.072)#122 | 0.32%(-0.210)#3,062 |
| 74. | Spanaway | 0.11% | 0.18%(-0.074)#123 | 0.32%(-0.212)#3,063 |
| 75. | Port Angeles | 0.095% | 0.18%(-0.085)#124 | 0.32%(-0.223)#3,064 |
| 76. | Bonney Lake | 0.089% | 0.18%(-0.092)#125 | 0.32%(-0.229)#3,065 |
| 77. | Mill Creek East | 0.083% | 0.18%(-0.097)#126 | 0.32%(-0.235)#3,066 |
| 78. | Country Homes | 0.080% | 0.18%(-0.100)#127 | 0.32%(-0.238)#3,067 |
| 79. | Lakewood | 0.079% | 0.18%(-0.101)#128 | 0.32%(-0.239)#3,068 |
| 80. | Lynden | 0.076% | 0.18%(-0.104)#129 | 0.32%(-0.241)#3,069 |
| 81. | Lake Stickney | 0.075% | 0.18%(-0.105)#130 | 0.32%(-0.243)#3,070 |
| 82. | Shoreline | 0.075% | 0.18%(-0.105)#131 | 0.32%(-0.243)#3,071 |
| 83. | Hoquiam | 0.069% | 0.18%(-0.112)#132 | 0.32%(-0.249)#3,072 |
| 84. | Monroe | 0.066% | 0.18%(-0.114)#133 | 0.32%(-0.252)#3,073 |
| 85. | Lake Tapps | 0.066% | 0.18%(-0.115)#134 | 0.32%(-0.252)#3,074 |
| 86. | Lake Stevens | 0.062% | 0.18%(-0.118)#135 | 0.32%(-0.256)#3,075 |
| 87. | Tukwila | 0.060% | 0.18%(-0.120)#136 | 0.32%(-0.257)#3,076 |
| 88. | Walla Walla | 0.056% | 0.18%(-0.124)#137 | 0.32%(-0.262)#3,077 |
| 89. | Richland | 0.056% | 0.18%(-0.124)#138 | 0.32%(-0.262)#3,078 |
| 90. | Midland | 0.055% | 0.18%(-0.125)#139 | 0.32%(-0.263)#3,079 |
| 91. | Fairwood Cdp King County | 0.054% | 0.18%(-0.126)#140 | 0.32%(-0.264)#3,080 |
| 92. | Lacey | 0.052% | 0.18%(-0.129)#141 | 0.32%(-0.266)#3,081 |
| 93. | Silverdale | 0.051% | 0.18%(-0.130)#142 | 0.32%(-0.267)#3,082 |
| 94. | Hazel Dell | 0.048% | 0.18%(-0.132)#143 | 0.32%(-0.269)#3,083 |
| 95. | Bothell West | 0.044% | 0.18%(-0.136)#144 | 0.32%(-0.274)#3,084 |
| 96. | Anacortes | 0.040% | 0.18%(-0.141)#145 | 0.32%(-0.278)#3,085 |
| 97. | Mercer Island | 0.039% | 0.18%(-0.141)#146 | 0.32%(-0.278)#3,086 |
| 98. | Spokane | 0.029% | 0.18%(-0.152)#147 | 0.32%(-0.289)#3,087 |
| 99. | Issaquah | 0.028% | 0.18%(-0.152)#148 | 0.32%(-0.290)#3,088 |
| 100. | Olympia | 0.022% | 0.18%(-0.158)#149 | 0.32%(-0.296)#3,089 |
Common Questions
What are the Top 10 Cities with the Highest Percentage of Immigrants from Guatemala in Washington?
Top 10 Cities with the Highest Percentage of Immigrants from Guatemala in Washington are:
#1
9.42%
#2
4.72%
#3
4.31%
#4
4.21%
#5
3.16%
#6
2.94%
#7
2.62%
#8
2.27%
#9
1.94%
#10
1.75%
What city has the Highest Percentage of Immigrants from Guatemala in Washington?
Shelton has the Highest Percentage of Immigrants from Guatemala in Washington with 9.42%.
What is the Percentage of Immigrants from Guatemala in the State of Washington?
Percentage of Immigrants from Guatemala in Washington is 0.18%.
What is the Percentage of Immigrants from Guatemala in the United States?
Percentage of Immigrants from Guatemala in the United States is 0.32%.