Cities with the Highest Percentage of Immigrants from Latvia in Washington
RELATED REPORTS & OPTIONS
Latvia
Washington
Compare Cities
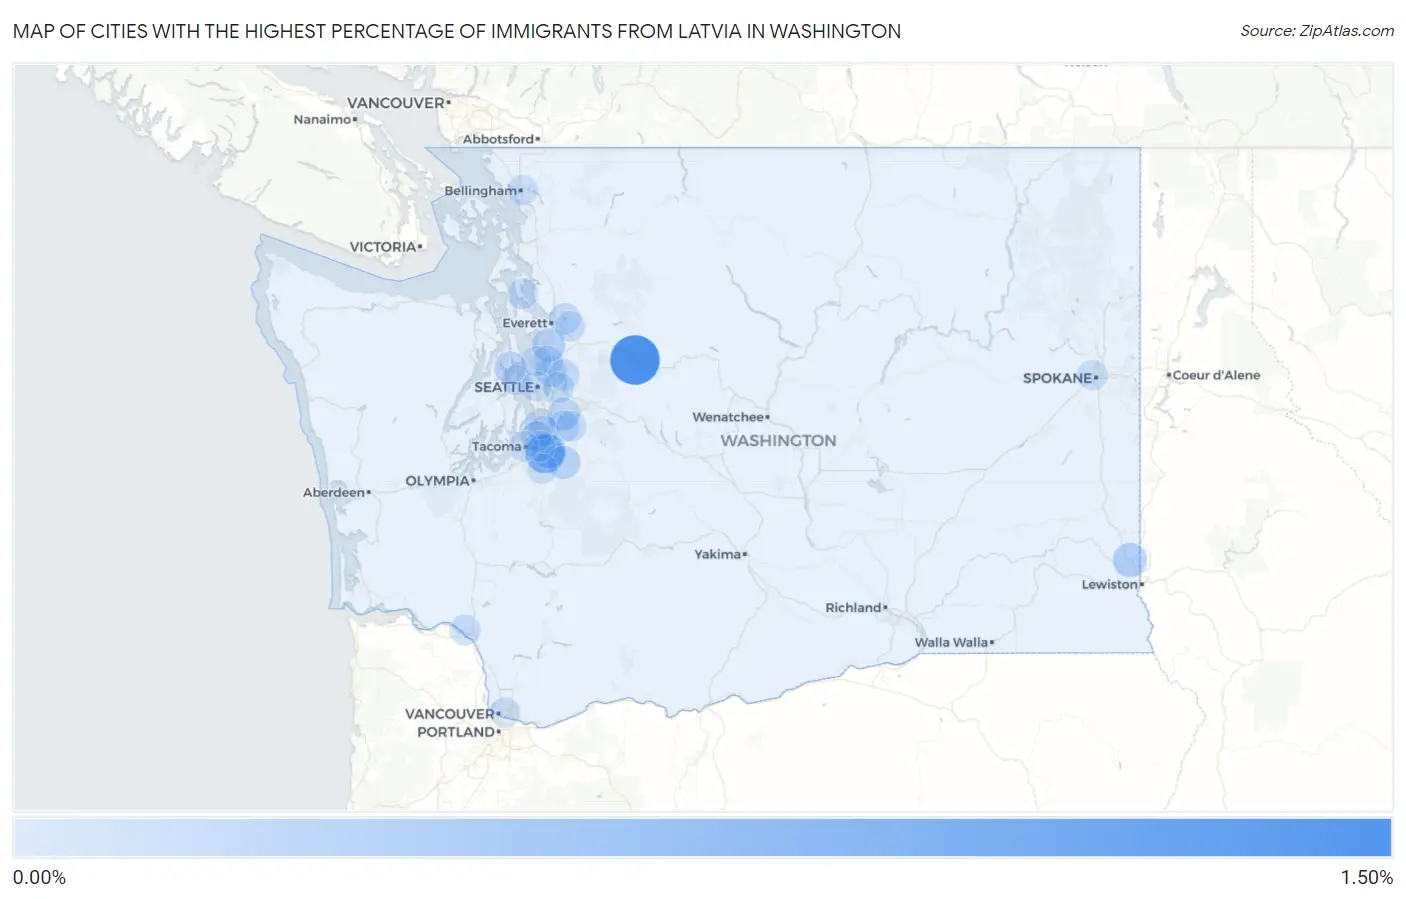
Map of Cities with the Highest Percentage of Immigrants from Latvia in Washington
0.00%
1.50%
Cities with the Highest Percentage of Immigrants from Latvia in Washington
| City | Latvia | vs State | vs National | |
| 1. | Baring | 1.46% | 0.012%(+1.44)#1 | 0.0071%(+1.45)#10 |
| 2. | North Puyallup | 0.65% | 0.012%(+0.636)#2 | 0.0071%(+0.641)#27 |
| 3. | Colton | 0.29% | 0.012%(+0.282)#3 | 0.0071%(+0.287)#86 |
| 4. | Sumner | 0.29% | 0.012%(+0.281)#4 | 0.0071%(+0.286)#87 |
| 5. | Martha Lake | 0.23% | 0.012%(+0.216)#5 | 0.0071%(+0.221)#118 |
| 6. | Prairie Heights | 0.21% | 0.012%(+0.195)#6 | 0.0071%(+0.199)#130 |
| 7. | Maple Heights Lake Desire | 0.15% | 0.012%(+0.134)#7 | 0.0071%(+0.138)#172 |
| 8. | Suquamish | 0.14% | 0.012%(+0.127)#8 | 0.0071%(+0.131)#176 |
| 9. | Lake Stevens | 0.085% | 0.012%(+0.073)#9 | 0.0071%(+0.078)#247 |
| 10. | Kirkland | 0.082% | 0.012%(+0.070)#10 | 0.0071%(+0.074)#254 |
| 11. | Kenmore | 0.076% | 0.012%(+0.065)#11 | 0.0071%(+0.069)#264 |
| 12. | Redmond | 0.073% | 0.012%(+0.062)#12 | 0.0071%(+0.066)#266 |
| 13. | Covington | 0.072% | 0.012%(+0.060)#13 | 0.0071%(+0.065)#270 |
| 14. | Longview | 0.066% | 0.012%(+0.055)#14 | 0.0071%(+0.059)#288 |
| 15. | Bellevue | 0.057% | 0.012%(+0.045)#15 | 0.0071%(+0.050)#311 |
| 16. | Lakeland North | 0.053% | 0.012%(+0.042)#16 | 0.0071%(+0.046)#320 |
| 17. | Camano | 0.051% | 0.012%(+0.039)#17 | 0.0071%(+0.044)#333 |
| 18. | Des Moines | 0.040% | 0.012%(+0.028)#18 | 0.0071%(+0.033)#364 |
| 19. | Federal Way | 0.039% | 0.012%(+0.028)#19 | 0.0071%(+0.032)#369 |
| 20. | Spokane | 0.036% | 0.012%(+0.024)#20 | 0.0071%(+0.029)#385 |
| 21. | Milton | 0.035% | 0.012%(+0.023)#21 | 0.0071%(+0.028)#390 |
| 22. | Maple Valley | 0.022% | 0.012%(+0.010)#22 | 0.0071%(+0.014)#462 |
| 23. | Bainbridge Island | 0.020% | 0.012%(+0.009)#23 | 0.0071%(+0.013)#469 |
| 24. | Everett | 0.016% | 0.012%(+0.005)#24 | 0.0071%(+0.009)#501 |
| 25. | Seattle | 0.014% | 0.012%(+0.002)#25 | 0.0071%(+0.007)#525 |
| 26. | Bellingham | 0.013% | 0.012%(+0.001)#26 | 0.0071%(+0.006)#534 |
| 27. | South Hill | 0.012% | 0.012%(+0.000)#27 | 0.0071%(+0.005)#554 |
| 28. | Tacoma | 0.010% | 0.012%(-0.001)#28 | 0.0071%(+0.003)#568 |
| 29. | Shoreline | 0.010% | 0.012%(-0.001)#29 | 0.0071%(+0.003)#570 |
| 30. | Vancouver | 0.0042% | 0.012%(-0.007)#30 | 0.0071%(-0.003)#627 |
Common Questions
What are the Top 10 Cities with the Highest Percentage of Immigrants from Latvia in Washington?
Top 10 Cities with the Highest Percentage of Immigrants from Latvia in Washington are:
#1
1.46%
#2
0.65%
#3
0.29%
#4
0.29%
#5
0.23%
#6
0.21%
#7
0.15%
#8
0.14%
#9
0.085%
#10
0.082%
What city has the Highest Percentage of Immigrants from Latvia in Washington?
Baring has the Highest Percentage of Immigrants from Latvia in Washington with 1.46%.
What is the Percentage of Immigrants from Latvia in the State of Washington?
Percentage of Immigrants from Latvia in Washington is 0.012%.
What is the Percentage of Immigrants from Latvia in the United States?
Percentage of Immigrants from Latvia in the United States is 0.0071%.