Cities with the Highest Percentage of Immigrants from South Eastern Asia in Washington
RELATED REPORTS & OPTIONS
South Eastern Asia
Washington
Compare Cities
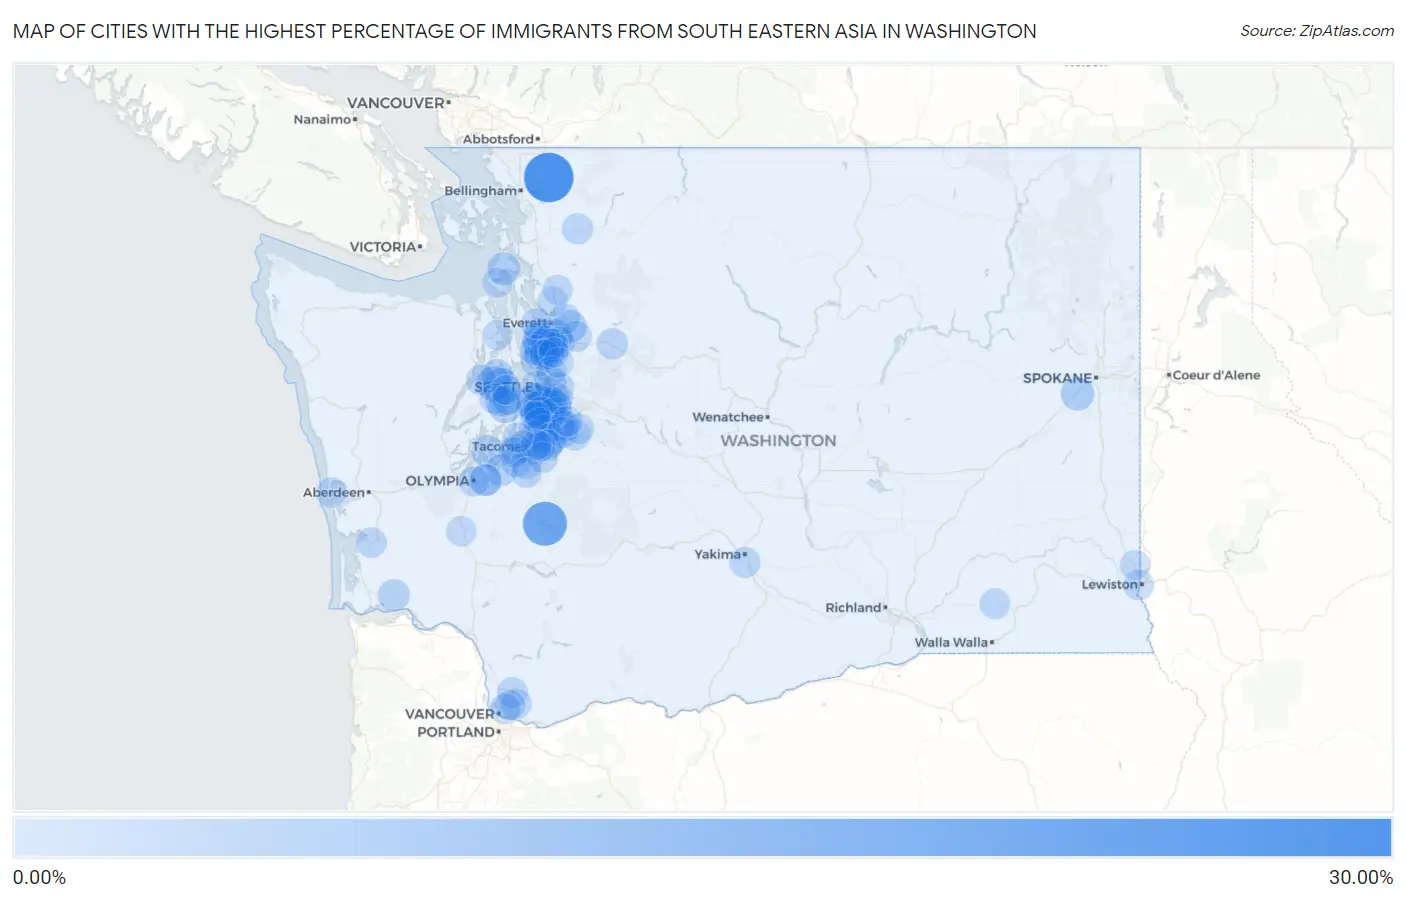
Map of Cities with the Highest Percentage of Immigrants from South Eastern Asia in Washington
0.00%
30.00%
Cities with the Highest Percentage of Immigrants from South Eastern Asia in Washington
| City | South Eastern Asia | vs State | vs National | |
| 1. | Deming | 26.46% | 2.24%(+24.2)#-1 | 1.30%(+25.2)#0 |
| 2. | Alder | 19.35% | 2.24%(+17.1)#0 | 1.30%(+18.1)#1 |
| 3. | Tukwila | 13.92% | 2.24%(+11.7)#1 | 1.30%(+12.6)#2 |
| 4. | Bryn Mawr Skyway | 13.65% | 2.24%(+11.4)#2 | 1.30%(+12.4)#3 |
| 5. | White Center | 13.44% | 2.24%(+11.2)#3 | 1.30%(+12.1)#4 |
| 6. | Renton | 9.58% | 2.24%(+7.34)#23 | 1.30%(+8.29)#206 |
| 7. | Larch Way | 9.50% | 2.24%(+7.26)#24 | 1.30%(+8.21)#207 |
| 8. | Tracyton | 9.39% | 2.24%(+7.15)#25 | 1.30%(+8.09)#208 |
| 9. | Chico | 8.13% | 2.24%(+5.89)#26 | 1.30%(+6.83)#209 |
| 10. | Kent | 8.11% | 2.24%(+5.87)#30 | 1.30%(+6.82)#320 |
| 11. | Picnic Point | 7.83% | 2.24%(+5.59)#31 | 1.30%(+6.53)#321 |
| 12. | Burien | 7.42% | 2.24%(+5.17)#32 | 1.30%(+6.12)#322 |
| 13. | Eastmont | 7.33% | 2.24%(+5.09)#33 | 1.30%(+6.04)#323 |
| 14. | Seatac | 6.96% | 2.24%(+4.72)#34 | 1.30%(+5.67)#324 |
| 15. | Algona | 6.80% | 2.24%(+4.56)#35 | 1.30%(+5.51)#325 |
| 16. | Martha Lake | 6.32% | 2.24%(+4.08)#36 | 1.30%(+5.03)#326 |
| 17. | Bethel | 6.26% | 2.24%(+4.01)#37 | 1.30%(+4.96)#327 |
| 18. | Lynnwood | 6.18% | 2.24%(+3.94)#38 | 1.30%(+4.88)#328 |
| 19. | Lakeland North | 6.14% | 2.24%(+3.90)#39 | 1.30%(+4.85)#329 |
| 20. | Four Lakes | 6.03% | 2.24%(+3.79)#40 | 1.30%(+4.73)#330 |
| 21. | Meadowdale | 5.31% | 2.24%(+3.07)#41 | 1.30%(+4.01)#331 |
| 22. | Everett | 5.29% | 2.24%(+3.05)#42 | 1.30%(+4.00)#332 |
| 23. | Oak Harbor | 5.20% | 2.24%(+2.96)#43 | 1.30%(+3.91)#333 |
| 24. | Fairwood Cdp King County | 5.20% | 2.24%(+2.96)#44 | 1.30%(+3.90)#334 |
| 25. | Federal Way | 4.94% | 2.24%(+2.69)#45 | 1.30%(+3.64)#335 |
| 26. | Longbranch | 4.61% | 2.24%(+2.36)#46 | 1.30%(+3.31)#336 |
| 27. | Alderwood Manor | 4.43% | 2.24%(+2.19)#47 | 1.30%(+3.13)#337 |
| 28. | North Lynnwood | 4.33% | 2.24%(+2.09)#48 | 1.30%(+3.04)#338 |
| 29. | Fife | 4.23% | 2.24%(+1.99)#49 | 1.30%(+2.94)#339 |
| 30. | Dupont | 4.19% | 2.24%(+1.95)#50 | 1.30%(+2.89)#340 |
| 31. | Silverdale | 4.18% | 2.24%(+1.94)#51 | 1.30%(+2.88)#341 |
| 32. | Covington | 4.17% | 2.24%(+1.92)#52 | 1.30%(+2.87)#342 |
| 33. | Lacey | 4.07% | 2.24%(+1.82)#53 | 1.30%(+2.77)#343 |
| 34. | Mountlake Terrace | 4.00% | 2.24%(+1.75)#54 | 1.30%(+2.70)#344 |
| 35. | Clyde Hill | 3.99% | 2.24%(+1.75)#55 | 1.30%(+2.69)#345 |
| 36. | Mukilteo | 3.97% | 2.24%(+1.73)#56 | 1.30%(+2.67)#346 |
| 37. | Des Moines | 3.96% | 2.24%(+1.72)#57 | 1.30%(+2.67)#347 |
| 38. | Grays River | 3.89% | 2.24%(+1.65)#58 | 1.30%(+2.59)#348 |
| 39. | Auburn | 3.88% | 2.24%(+1.64)#59 | 1.30%(+2.58)#349 |
| 40. | Erlands Point | 3.86% | 2.24%(+1.62)#60 | 1.30%(+2.56)#350 |
| 41. | Silver Firs | 3.85% | 2.24%(+1.61)#61 | 1.30%(+2.55)#351 |
| 42. | Tanglewilde | 3.76% | 2.24%(+1.52)#62 | 1.30%(+2.47)#352 |
| 43. | Lakewood | 3.65% | 2.24%(+1.41)#63 | 1.30%(+2.35)#353 |
| 44. | Tacoma | 3.55% | 2.24%(+1.31)#64 | 1.30%(+2.25)#391 |
| 45. | Shoreline | 3.51% | 2.24%(+1.27)#65 | 1.30%(+2.21)#392 |
| 46. | May Creek | 3.32% | 2.24%(+1.08)#66 | 1.30%(+2.03)#393 |
| 47. | Fircrest | 3.30% | 2.24%(+1.05)#67 | 1.30%(+2.00)#394 |
| 48. | Bellevue | 3.25% | 2.24%(+1.01)#68 | 1.30%(+1.95)#395 |
| 49. | Newcastle | 3.24% | 2.24%(+0.998)#69 | 1.30%(+1.94)#396 |
| 50. | Hamilton | 3.19% | 2.24%(+0.950)#70 | 1.30%(+1.90)#397 |
| 51. | Lake Morton Berrydale | 3.18% | 2.24%(+0.943)#71 | 1.30%(+1.89)#398 |
| 52. | Pacific | 3.02% | 2.24%(+0.773)#72 | 1.30%(+1.72)#399 |
| 53. | Union Gap | 3.01% | 2.24%(+0.768)#73 | 1.30%(+1.71)#400 |
| 54. | Seattle | 3.00% | 2.24%(+0.755)#74 | 1.30%(+1.70)#401 |
| 55. | Black Diamond | 2.99% | 2.24%(+0.750)#75 | 1.30%(+1.70)#402 |
| 56. | Kitsap Lake | 2.97% | 2.24%(+0.728)#76 | 1.30%(+1.67)#403 |
| 57. | Chain Lake | 2.97% | 2.24%(+0.726)#77 | 1.30%(+1.67)#404 |
| 58. | Normandy Park | 2.90% | 2.24%(+0.655)#78 | 1.30%(+1.60)#405 |
| 59. | University Place | 2.81% | 2.24%(+0.571)#79 | 1.30%(+1.52)#406 |
| 60. | Bothell West | 2.81% | 2.24%(+0.569)#80 | 1.30%(+1.51)#407 |
| 61. | Seabeck | 2.78% | 2.24%(+0.542)#81 | 1.30%(+1.49)#408 |
| 62. | Parkland | 2.74% | 2.24%(+0.494)#82 | 1.30%(+1.44)#409 |
| 63. | Mill Creek East | 2.72% | 2.24%(+0.481)#83 | 1.30%(+1.43)#410 |
| 64. | Meadow Glade | 2.72% | 2.24%(+0.478)#84 | 1.30%(+1.42)#411 |
| 65. | Puyallup | 2.69% | 2.24%(+0.448)#85 | 1.30%(+1.39)#412 |
| 66. | Bremerton | 2.69% | 2.24%(+0.446)#86 | 1.30%(+1.39)#413 |
| 67. | Lake Stickney | 2.68% | 2.24%(+0.437)#87 | 1.30%(+1.38)#414 |
| 68. | Port Orchard | 2.67% | 2.24%(+0.432)#88 | 1.30%(+1.38)#415 |
| 69. | Lake Stevens | 2.65% | 2.24%(+0.412)#89 | 1.30%(+1.36)#416 |
| 70. | Prescott | 2.64% | 2.24%(+0.398)#90 | 1.30%(+1.34)#417 |
| 71. | Milton | 2.63% | 2.24%(+0.392)#91 | 1.30%(+1.34)#418 |
| 72. | Fife Heights | 2.61% | 2.24%(+0.365)#92 | 1.30%(+1.31)#419 |
| 73. | Clarkston | 2.60% | 2.24%(+0.361)#93 | 1.30%(+1.31)#420 |
| 74. | South Bend | 2.58% | 2.24%(+0.340)#94 | 1.30%(+1.29)#421 |
| 75. | Edmonds | 2.56% | 2.24%(+0.315)#95 | 1.30%(+1.26)#422 |
| 76. | Mill Creek | 2.55% | 2.24%(+0.311)#96 | 1.30%(+1.26)#423 |
| 77. | Ruston | 2.52% | 2.24%(+0.278)#97 | 1.30%(+1.22)#424 |
| 78. | Orchards | 2.50% | 2.24%(+0.253)#98 | 1.30%(+1.20)#425 |
| 79. | Clinton | 2.49% | 2.24%(+0.247)#99 | 1.30%(+1.19)#426 |
| 80. | Olympia | 2.47% | 2.24%(+0.226)#100 | 1.30%(+1.17)#427 |
| 81. | Spanaway | 2.45% | 2.24%(+0.210)#101 | 1.30%(+1.16)#428 |
| 82. | Minnehaha | 2.43% | 2.24%(+0.193)#102 | 1.30%(+1.14)#429 |
| 83. | Ravensdale | 2.43% | 2.24%(+0.191)#103 | 1.30%(+1.14)#430 |
| 84. | Marysville | 2.42% | 2.24%(+0.177)#104 | 1.30%(+1.12)#431 |
| 85. | Shadow Lake | 2.41% | 2.24%(+0.169)#105 | 1.30%(+1.12)#432 |
| 86. | Arlington | 2.39% | 2.24%(+0.147)#106 | 1.30%(+1.09)#433 |
| 87. | East Port Orchard | 2.33% | 2.24%(+0.085)#107 | 1.30%(+1.03)#434 |
| 88. | Brier | 2.32% | 2.24%(+0.083)#108 | 1.30%(+1.03)#435 |
| 89. | Five Corners | 2.32% | 2.24%(+0.082)#109 | 1.30%(+1.03)#436 |
| 90. | Fords Prairie | 2.32% | 2.24%(+0.080)#110 | 1.30%(+1.03)#437 |
| 91. | Kirkland | 2.24% | 2.24%(+0.002)#111 | 1.30%(+0.948)#438 |
| 92. | Woodinville | 2.11% | 2.24%(-0.129)#112 | 1.30%(+0.816)#439 |
| 93. | Lexington | 2.11% | 2.24%(-0.132)#113 | 1.30%(+0.814)#440 |
| 94. | Coupeville | 2.11% | 2.24%(-0.134)#114 | 1.30%(+0.812)#441 |
| 95. | Bothell East | 2.10% | 2.24%(-0.141)#115 | 1.30%(+0.804)#442 |
| 96. | Port Ludlow | 2.10% | 2.24%(-0.142)#116 | 1.30%(+0.803)#443 |
| 97. | Parkwood | 2.10% | 2.24%(-0.147)#117 | 1.30%(+0.799)#444 |
| 98. | Enetai | 2.09% | 2.24%(-0.155)#118 | 1.30%(+0.790)#445 |
| 99. | Uniontown | 2.07% | 2.24%(-0.175)#119 | 1.30%(+0.771)#446 |
| 100. | Ocean Shores | 2.02% | 2.24%(-0.224)#120 | 1.30%(+0.722)#447 |
Common Questions
What are the Top 10 Cities with the Highest Percentage of Immigrants from South Eastern Asia in Washington?
Top 10 Cities with the Highest Percentage of Immigrants from South Eastern Asia in Washington are:
#1
26.46%
#2
19.35%
#3
13.92%
#4
13.65%
#5
13.44%
#6
9.58%
#7
9.50%
#8
9.39%
#9
8.13%
#10
8.11%
What city has the Highest Percentage of Immigrants from South Eastern Asia in Washington?
Deming has the Highest Percentage of Immigrants from South Eastern Asia in Washington with 26.46%.
What is the Percentage of Immigrants from South Eastern Asia in the State of Washington?
Percentage of Immigrants from South Eastern Asia in Washington is 2.24%.
What is the Percentage of Immigrants from South Eastern Asia in the United States?
Percentage of Immigrants from South Eastern Asia in the United States is 1.30%.