Zip Codes with the Highest Percentage of Population Employed in Food Preparation & Serving in Auburn, WA
RELATED REPORTS & OPTIONS
Food Preparation & Serving
Auburn
Compare Zip Codes
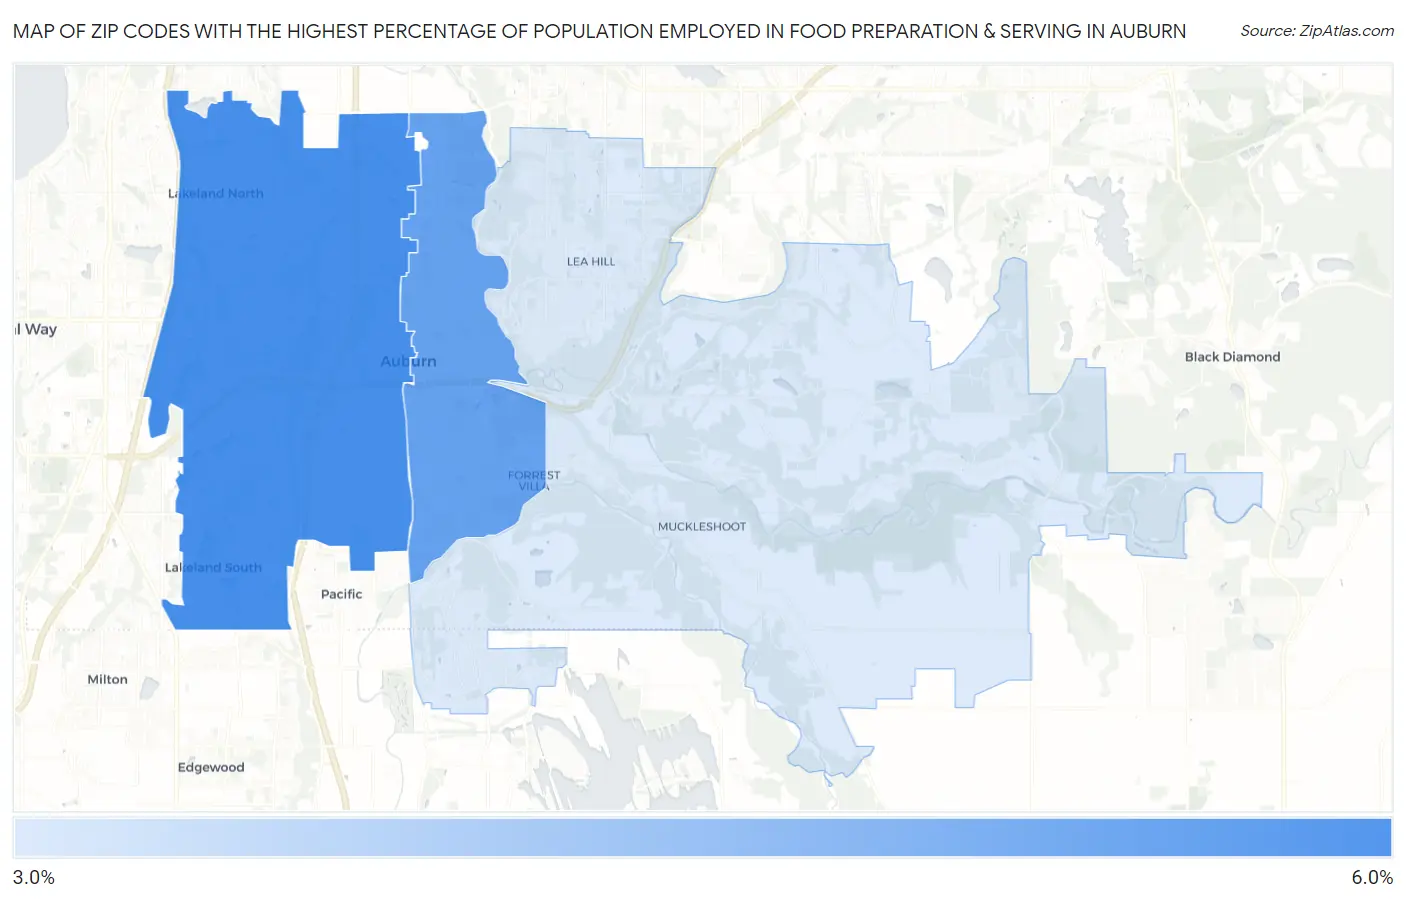
Map of Zip Codes with the Highest Percentage of Population Employed in Food Preparation & Serving in Auburn
3.7%
5.4%
Zip Codes with the Highest Percentage of Population Employed in Food Preparation & Serving in Auburn, WA
| Zip Code | % Employed | vs State | vs National | |
| 1. | 98001 | 5.4% | 5.1%(+0.250)#205 | 5.3%(+0.107)#11,431 |
| 2. | 98002 | 5.0% | 5.1%(-0.094)#236 | 5.3%(-0.237)#12,744 |
| 3. | 98092 | 3.7% | 5.1%(-1.45)#340 | 5.3%(-1.59)#18,383 |
1
Common Questions
What are the Top Zip Codes with the Highest Percentage of Population Employed in Food Preparation & Serving in Auburn, WA?
Top Zip Codes with the Highest Percentage of Population Employed in Food Preparation & Serving in Auburn, WA are:
What zip code has the Highest Percentage of Population Employed in Food Preparation & Serving in Auburn, WA?
98001 has the Highest Percentage of Population Employed in Food Preparation & Serving in Auburn, WA with 5.4%.
What is the Percentage of Population Employed in Food Preparation & Serving in Auburn, WA?
Percentage of Population Employed in Food Preparation & Serving in Auburn is 4.3%.
What is the Percentage of Population Employed in Food Preparation & Serving in Washington?
Percentage of Population Employed in Food Preparation & Serving in Washington is 5.1%.
What is the Percentage of Population Employed in Food Preparation & Serving in the United States?
Percentage of Population Employed in Food Preparation & Serving in the United States is 5.3%.