Cities with the Highest Percentage of Population Taking Public Transit to Work in Washington
RELATED REPORTS & OPTIONS
Public Transit
Washington
Compare Cities
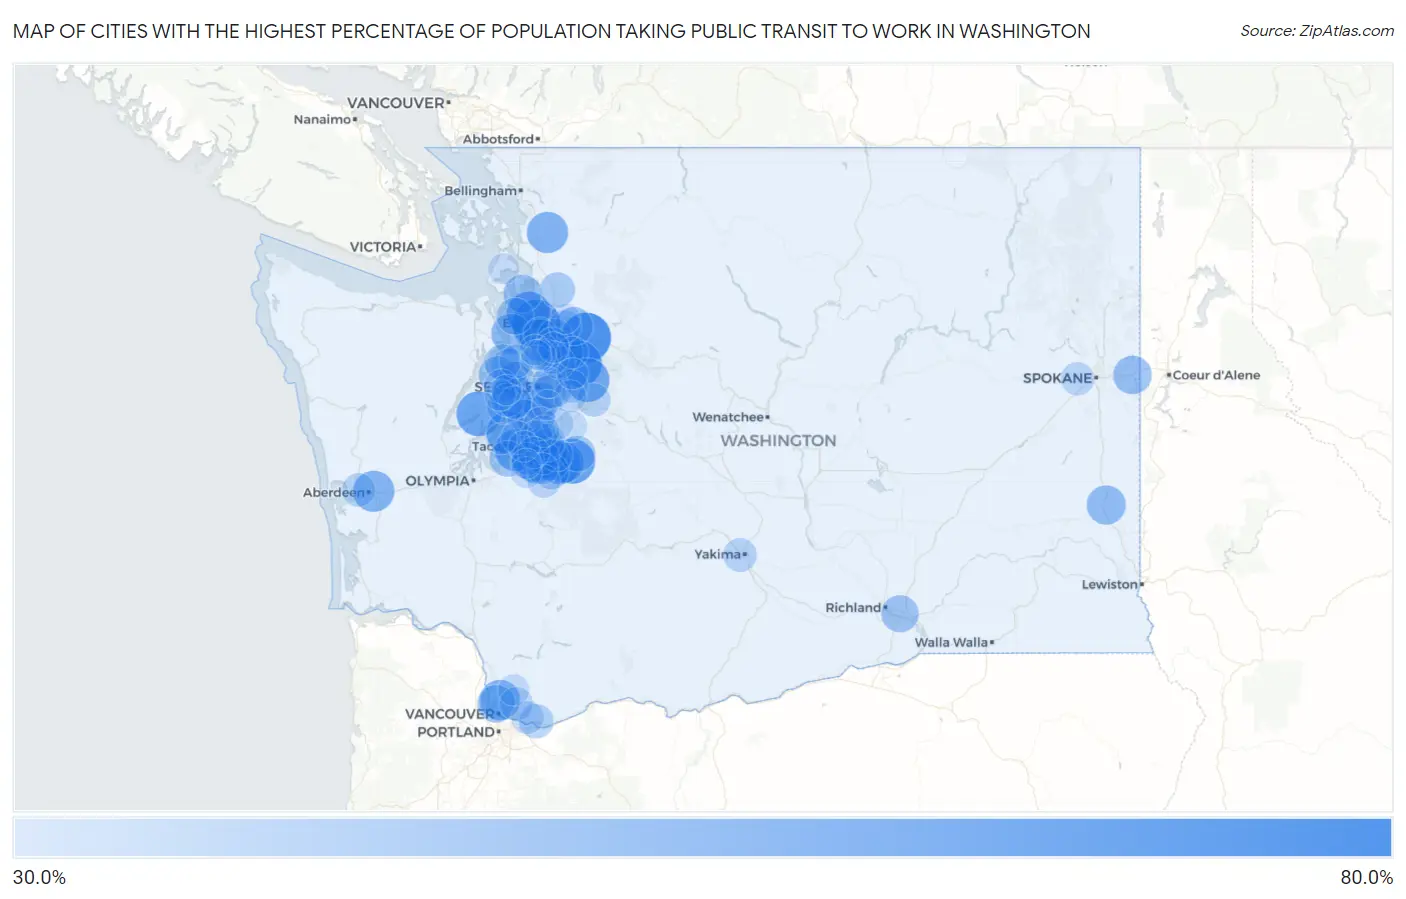
Map of Cities with the Highest Percentage of Population Taking Public Transit to Work in Washington
0.0%
80.0%
Cities with the Highest Percentage of Population Taking Public Transit to Work in Washington
| City | % Public Transit | vs State | vs National | |
| 1. | Woods Creek | 69.4% | 35.2%(+34.2)#1 | 38.5%(+30.9)#16 |
| 2. | Clinton | 67.3% | 35.2%(+32.1)#2 | 38.5%(+28.8)#25 |
| 3. | Duvall | 64.2% | 35.2%(+29.0)#3 | 38.5%(+25.7)#68 |
| 4. | Buckley | 62.2% | 35.2%(+27.0)#4 | 38.5%(+23.7)#102 |
| 5. | Belfair | 61.5% | 35.2%(+26.3)#5 | 38.5%(+23.0)#118 |
| 6. | Langley | 60.8% | 35.2%(+25.6)#6 | 38.5%(+22.3)#138 |
| 7. | Carnation | 60.2% | 35.2%(+25.0)#7 | 38.5%(+21.7)#165 |
| 8. | Summit | 59.1% | 35.2%(+23.9)#8 | 38.5%(+20.6)#200 |
| 9. | Gig Harbor | 58.2% | 35.2%(+23.0)#9 | 38.5%(+19.7)#243 |
| 10. | Fircrest | 58.2% | 35.2%(+23.0)#10 | 38.5%(+19.7)#244 |
| 11. | Manchester | 57.6% | 35.2%(+22.4)#11 | 38.5%(+19.1)#276 |
| 12. | Picnic Point | 56.6% | 35.2%(+21.4)#12 | 38.5%(+18.1)#330 |
| 13. | Sedro Woolley | 56.0% | 35.2%(+20.8)#13 | 38.5%(+17.5)#378 |
| 14. | Maltby | 55.9% | 35.2%(+20.7)#14 | 38.5%(+17.4)#383 |
| 15. | Aberdeen | 55.8% | 35.2%(+20.6)#15 | 38.5%(+17.3)#388 |
| 16. | Prairie Ridge | 55.7% | 35.2%(+20.5)#16 | 38.5%(+17.2)#398 |
| 17. | Prairie Heights | 55.3% | 35.2%(+20.1)#17 | 38.5%(+16.8)#428 |
| 18. | Alderton | 55.1% | 35.2%(+19.9)#18 | 38.5%(+16.6)#447 |
| 19. | Salmon Creek | 54.4% | 35.2%(+19.2)#19 | 38.5%(+15.9)#484 |
| 20. | Hansville | 53.9% | 35.2%(+18.7)#20 | 38.5%(+15.4)#531 |
| 21. | Colfax | 52.6% | 35.2%(+17.4)#21 | 38.5%(+14.1)#640 |
| 22. | Normandy Park | 52.3% | 35.2%(+17.1)#22 | 38.5%(+13.8)#663 |
| 23. | Liberty Lake | 51.5% | 35.2%(+16.3)#23 | 38.5%(+13.0)#719 |
| 24. | Snohomish | 51.3% | 35.2%(+16.1)#24 | 38.5%(+12.8)#747 |
| 25. | Camano | 50.7% | 35.2%(+15.5)#25 | 38.5%(+12.2)#802 |
| 26. | Suquamish | 50.5% | 35.2%(+15.3)#26 | 38.5%(+12.0)#830 |
| 27. | Boulevard Park | 50.4% | 35.2%(+15.2)#27 | 38.5%(+11.9)#837 |
| 28. | Lake Shore | 50.2% | 35.2%(+15.0)#28 | 38.5%(+11.7)#872 |
| 29. | Silverdale | 49.9% | 35.2%(+14.7)#29 | 38.5%(+11.4)#899 |
| 30. | Summit View | 49.6% | 35.2%(+14.4)#30 | 38.5%(+11.1)#939 |
| 31. | Pasco | 49.5% | 35.2%(+14.3)#31 | 38.5%(+11.0)#947 |
| 32. | Beaux Arts Village | 49.5% | 35.2%(+14.3)#32 | 38.5%(+11.0)#968 |
| 33. | Freeland | 49.0% | 35.2%(+13.8)#33 | 38.5%(+10.5)#1,055 |
| 34. | Bainbridge Island | 48.8% | 35.2%(+13.6)#34 | 38.5%(+10.3)#1,063 |
| 35. | Sumner | 48.6% | 35.2%(+13.4)#35 | 38.5%(+10.1)#1,092 |
| 36. | Poulsbo | 48.2% | 35.2%(+13.0)#36 | 38.5%(+9.70)#1,158 |
| 37. | Bethel | 47.8% | 35.2%(+12.6)#37 | 38.5%(+9.30)#1,209 |
| 38. | Steilacoom | 47.6% | 35.2%(+12.4)#38 | 38.5%(+9.10)#1,239 |
| 39. | Enumclaw | 47.3% | 35.2%(+12.1)#39 | 38.5%(+8.80)#1,294 |
| 40. | Lakeland South | 47.3% | 35.2%(+12.1)#40 | 38.5%(+8.80)#1,295 |
| 41. | Orting | 47.1% | 35.2%(+11.9)#41 | 38.5%(+8.60)#1,331 |
| 42. | Vashon | 46.9% | 35.2%(+11.7)#42 | 38.5%(+8.40)#1,359 |
| 43. | Milton | 46.8% | 35.2%(+11.6)#43 | 38.5%(+8.30)#1,376 |
| 44. | Arlington | 46.4% | 35.2%(+11.2)#44 | 38.5%(+7.90)#1,440 |
| 45. | Algona | 45.8% | 35.2%(+10.6)#45 | 38.5%(+7.30)#1,525 |
| 46. | Eastmont | 45.5% | 35.2%(+10.3)#46 | 38.5%(+7.00)#1,570 |
| 47. | Bothell West | 45.5% | 35.2%(+10.3)#47 | 38.5%(+7.00)#1,572 |
| 48. | Mercer Island | 45.4% | 35.2%(+10.2)#48 | 38.5%(+6.90)#1,592 |
| 49. | Washougal | 45.1% | 35.2%(+9.90)#49 | 38.5%(+6.60)#1,653 |
| 50. | Tracyton | 44.2% | 35.2%(+9.00)#50 | 38.5%(+5.70)#1,804 |
| 51. | Puyallup | 44.0% | 35.2%(+8.80)#51 | 38.5%(+5.50)#1,837 |
| 52. | Yakima | 43.9% | 35.2%(+8.70)#52 | 38.5%(+5.40)#1,844 |
| 53. | Clyde Hill | 43.8% | 35.2%(+8.60)#53 | 38.5%(+5.30)#1,871 |
| 54. | Indianola | 43.6% | 35.2%(+8.40)#54 | 38.5%(+5.10)#1,895 |
| 55. | Snoqualmie | 43.5% | 35.2%(+8.30)#55 | 38.5%(+5.00)#1,912 |
| 56. | Hoquiam | 43.5% | 35.2%(+8.30)#56 | 38.5%(+5.00)#1,915 |
| 57. | Parkwood | 43.5% | 35.2%(+8.30)#57 | 38.5%(+5.00)#1,917 |
| 58. | Orchards | 43.4% | 35.2%(+8.20)#58 | 38.5%(+4.90)#1,922 |
| 59. | Pacific | 43.4% | 35.2%(+8.20)#59 | 38.5%(+4.90)#1,928 |
| 60. | Airway Heights | 43.3% | 35.2%(+8.10)#60 | 38.5%(+4.80)#1,951 |
| 61. | Des Moines | 43.1% | 35.2%(+7.90)#61 | 38.5%(+4.60)#1,984 |
| 62. | Bonney Lake | 43.0% | 35.2%(+7.80)#62 | 38.5%(+4.50)#2,004 |
| 63. | Sammamish | 42.9% | 35.2%(+7.70)#63 | 38.5%(+4.40)#2,019 |
| 64. | Camas | 42.8% | 35.2%(+7.60)#64 | 38.5%(+4.30)#2,048 |
| 65. | Graham | 42.7% | 35.2%(+7.50)#65 | 38.5%(+4.20)#2,068 |
| 66. | Woodinville | 42.6% | 35.2%(+7.40)#66 | 38.5%(+4.10)#2,092 |
| 67. | Southworth | 42.5% | 35.2%(+7.30)#67 | 38.5%(+4.00)#2,118 |
| 68. | Ruston | 42.5% | 35.2%(+7.30)#68 | 38.5%(+4.00)#2,119 |
| 69. | Mukilteo | 42.3% | 35.2%(+7.10)#69 | 38.5%(+3.80)#2,148 |
| 70. | Mill Creek | 42.3% | 35.2%(+7.10)#70 | 38.5%(+3.80)#2,149 |
| 71. | Bothell | 42.2% | 35.2%(+7.00)#71 | 38.5%(+3.70)#2,160 |
| 72. | Bunk Foss | 42.2% | 35.2%(+7.00)#72 | 38.5%(+3.70)#2,168 |
| 73. | Midland | 42.0% | 35.2%(+6.80)#73 | 38.5%(+3.50)#2,197 |
| 74. | Issaquah | 41.7% | 35.2%(+6.50)#74 | 38.5%(+3.20)#2,225 |
| 75. | Federal Way | 41.3% | 35.2%(+6.10)#75 | 38.5%(+2.80)#2,292 |
| 76. | Fairwood Cdp Spokane County | 41.2% | 35.2%(+6.00)#76 | 38.5%(+2.70)#2,312 |
| 77. | Brier | 41.1% | 35.2%(+5.90)#77 | 38.5%(+2.60)#2,329 |
| 78. | Shoreline | 40.8% | 35.2%(+5.60)#78 | 38.5%(+2.30)#2,371 |
| 79. | High Bridge | 40.8% | 35.2%(+5.60)#79 | 38.5%(+2.30)#2,384 |
| 80. | Maple Valley | 40.7% | 35.2%(+5.50)#80 | 38.5%(+2.20)#2,393 |
| 81. | Kent | 40.5% | 35.2%(+5.30)#81 | 38.5%(+2.00)#2,426 |
| 82. | South Hill | 40.5% | 35.2%(+5.30)#82 | 38.5%(+2.00)#2,431 |
| 83. | Battle Ground | 40.5% | 35.2%(+5.30)#83 | 38.5%(+2.00)#2,439 |
| 84. | Lakeland North | 40.4% | 35.2%(+5.20)#84 | 38.5%(+1.90)#2,468 |
| 85. | Artondale | 40.3% | 35.2%(+5.10)#85 | 38.5%(+1.80)#2,491 |
| 86. | Waller | 40.3% | 35.2%(+5.10)#86 | 38.5%(+1.80)#2,494 |
| 87. | Spanaway | 40.1% | 35.2%(+4.90)#87 | 38.5%(+1.60)#2,518 |
| 88. | Medina | 40.1% | 35.2%(+4.90)#88 | 38.5%(+1.60)#2,528 |
| 89. | Union Hill Novelty Hill | 40.0% | 35.2%(+4.80)#89 | 38.5%(+1.50)#2,538 |
| 90. | Navy Yard City | 39.9% | 35.2%(+4.70)#90 | 38.5%(+1.40)#2,566 |
| 91. | Mountlake Terrace | 39.8% | 35.2%(+4.60)#91 | 38.5%(+1.30)#2,575 |
| 92. | Tacoma | 39.6% | 35.2%(+4.40)#92 | 38.5%(+1.10)#2,601 |
| 93. | Oak Harbor | 39.6% | 35.2%(+4.40)#93 | 38.5%(+1.10)#2,609 |
| 94. | Edmonds | 39.3% | 35.2%(+4.10)#94 | 38.5%(+0.800)#2,660 |
| 95. | Mill Creek East | 39.3% | 35.2%(+4.10)#95 | 38.5%(+0.800)#2,663 |
| 96. | Enetai | 38.9% | 35.2%(+3.70)#96 | 38.5%(+0.400)#2,730 |
| 97. | Lake Stevens | 38.8% | 35.2%(+3.60)#97 | 38.5%(+0.300)#2,738 |
| 98. | Bryn Mawr Skyway | 38.7% | 35.2%(+3.50)#98 | 38.5%(+0.200)#2,769 |
| 99. | Parkland | 38.5% | 35.2%(+3.30)#99 | 38.5%(=0.000)#2,798 |
| 100. | Esperance | 38.5% | 35.2%(+3.30)#100 | 38.5%(=0.000)#2,810 |
Common Questions
What are the Top 10 Cities with the Highest Percentage of Population Taking Public Transit to Work in Washington?
Top 10 Cities with the Highest Percentage of Population Taking Public Transit to Work in Washington are:
#1
69.4%
#2
67.3%
#3
64.2%
#4
62.2%
#5
61.5%
#6
60.8%
#7
60.2%
#8
59.1%
#9
58.2%
#10
58.2%
What city has the Highest Percentage of Population Taking Public Transit to Work in Washington?
Woods Creek has the Highest Percentage of Population Taking Public Transit to Work in Washington with 69.4%.
What is the Percentage of Population Taking Public Transit to Work in the State of Washington?
Percentage of Population Taking Public Transit to Work in Washington is 35.2%.
What is the Percentage of Population Taking Public Transit to Work in the United States?
Percentage of Population Taking Public Transit to Work in the United States is 38.5%.