Cities with the Highest Percentage of Population Employed in Management in Washington
RELATED REPORTS & OPTIONS
Management
Washington
Compare Cities
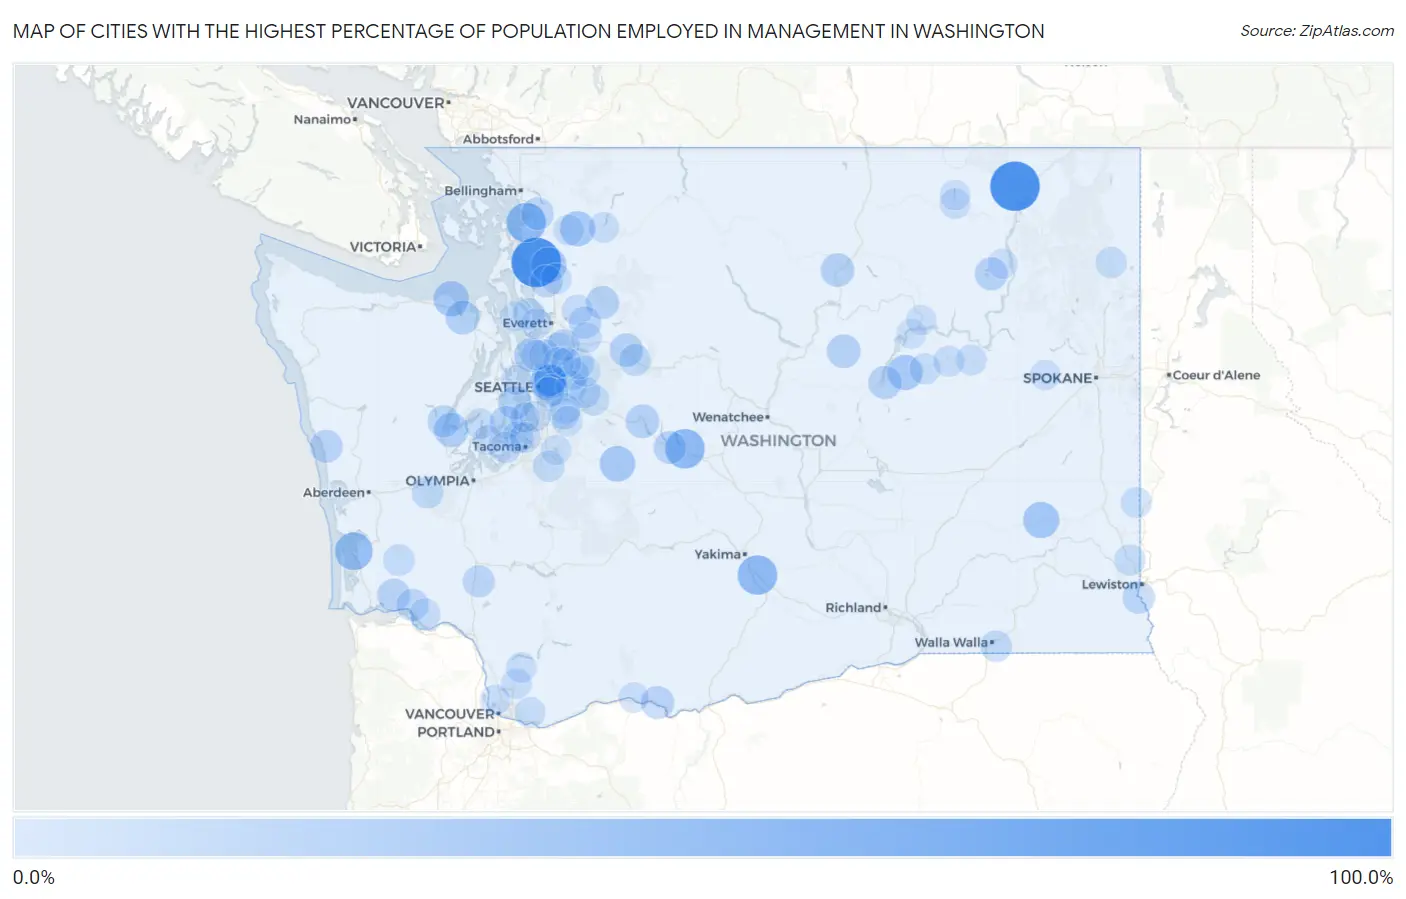
Map of Cities with the Highest Percentage of Population Employed in Management in Washington
0.0%
100.0%
Cities with the Highest Percentage of Population Employed in Management in Washington
| City | % Employed | vs State | vs National | |
| 1. | Barstow | 100.0% | 12.0%(+88.0)#1 | 11.0%(+89.0)#31 |
| 2. | Conway | 100.0% | 12.0%(+88.0)#2 | 11.0%(+89.0)#37 |
| 3. | Crescent Bar | 57.3% | 12.0%(+45.3)#3 | 11.0%(+46.3)#171 |
| 4. | Ronald | 56.8% | 12.0%(+44.8)#4 | 11.0%(+45.8)#175 |
| 5. | Donald | 56.7% | 12.0%(+44.7)#5 | 11.0%(+45.7)#176 |
| 6. | Edison | 56.5% | 12.0%(+44.5)#6 | 11.0%(+45.5)#178 |
| 7. | Bay Center | 49.3% | 12.0%(+37.3)#7 | 11.0%(+38.3)#267 |
| 8. | Lacrosse | 42.6% | 12.0%(+30.6)#8 | 11.0%(+31.6)#377 |
| 9. | Greenwater | 40.0% | 12.0%(+28.0)#9 | 11.0%(+29.0)#434 |
| 10. | Lake Mcmurray | 39.8% | 12.0%(+27.8)#10 | 11.0%(+28.8)#446 |
| 11. | Jamestown | 39.2% | 12.0%(+27.2)#11 | 11.0%(+28.2)#460 |
| 12. | Hartline | 39.0% | 12.0%(+27.1)#12 | 11.0%(+28.0)#464 |
| 13. | Hamilton | 38.7% | 12.0%(+26.7)#13 | 11.0%(+27.7)#470 |
| 14. | Hunts Point | 37.7% | 12.0%(+25.7)#14 | 11.0%(+26.7)#494 |
| 15. | Medina | 37.0% | 12.0%(+25.0)#15 | 11.0%(+26.0)#522 |
| 16. | Union | 35.1% | 12.0%(+23.1)#16 | 11.0%(+24.1)#608 |
| 17. | Woodway | 33.9% | 12.0%(+21.9)#17 | 11.0%(+22.9)#653 |
| 18. | Blyn | 32.8% | 12.0%(+20.8)#18 | 11.0%(+21.8)#730 |
| 19. | Snoqualmie Pass | 32.1% | 12.0%(+20.1)#19 | 11.0%(+21.1)#765 |
| 20. | Southworth | 32.0% | 12.0%(+20.0)#20 | 11.0%(+21.0)#770 |
| 21. | Malott | 31.8% | 12.0%(+19.8)#21 | 11.0%(+20.8)#784 |
| 22. | Mansfield | 31.6% | 12.0%(+19.6)#22 | 11.0%(+20.6)#794 |
| 23. | Index | 30.8% | 12.0%(+18.8)#23 | 11.0%(+19.7)#845 |
| 24. | Banks Lake South | 30.7% | 12.0%(+18.7)#24 | 11.0%(+19.6)#852 |
| 25. | Purdy | 30.3% | 12.0%(+18.3)#25 | 11.0%(+19.3)#877 |
| 26. | Verlot | 29.7% | 12.0%(+17.7)#26 | 11.0%(+18.7)#920 |
| 27. | Clyde Hill | 29.7% | 12.0%(+17.7)#27 | 11.0%(+18.7)#922 |
| 28. | Twin Lakes | 29.4% | 12.0%(+17.4)#28 | 11.0%(+18.4)#946 |
| 29. | Lyle | 29.2% | 12.0%(+17.2)#29 | 11.0%(+18.2)#965 |
| 30. | Grays River | 29.1% | 12.0%(+17.2)#30 | 11.0%(+18.1)#976 |
| 31. | Qui Nai Elt Village | 28.6% | 12.0%(+16.6)#31 | 11.0%(+17.6)#1,026 |
| 32. | Easton | 28.4% | 12.0%(+16.4)#32 | 11.0%(+17.4)#1,047 |
| 33. | Marine View | 27.9% | 12.0%(+15.9)#33 | 11.0%(+16.9)#1,097 |
| 34. | Alger | 27.4% | 12.0%(+15.5)#34 | 11.0%(+16.4)#1,144 |
| 35. | Hoodsport | 27.0% | 12.0%(+15.0)#35 | 11.0%(+16.0)#1,192 |
| 36. | Asotin | 26.9% | 12.0%(+15.0)#36 | 11.0%(+15.9)#1,204 |
| 37. | Union Hill Novelty Hill | 26.5% | 12.0%(+14.5)#37 | 11.0%(+15.5)#1,268 |
| 38. | Skamokawa Valley | 26.5% | 12.0%(+14.5)#38 | 11.0%(+15.5)#1,276 |
| 39. | Lake Roesiger | 26.4% | 12.0%(+14.4)#39 | 11.0%(+15.3)#1,293 |
| 40. | Clearview | 26.3% | 12.0%(+14.4)#40 | 11.0%(+15.3)#1,296 |
| 41. | Sunday Lake | 26.3% | 12.0%(+14.3)#41 | 11.0%(+15.3)#1,307 |
| 42. | Yarrow Point | 26.1% | 12.0%(+14.1)#42 | 11.0%(+15.1)#1,327 |
| 43. | Toledo | 25.3% | 12.0%(+13.3)#43 | 11.0%(+14.3)#1,456 |
| 44. | Ruston | 24.8% | 12.0%(+12.8)#44 | 11.0%(+13.8)#1,549 |
| 45. | Cathcart | 24.8% | 12.0%(+12.8)#45 | 11.0%(+13.7)#1,563 |
| 46. | Beaux Arts Village | 24.6% | 12.0%(+12.7)#46 | 11.0%(+13.6)#1,581 |
| 47. | Baring | 24.5% | 12.0%(+12.6)#47 | 11.0%(+13.5)#1,594 |
| 48. | Malone | 24.3% | 12.0%(+12.3)#48 | 11.0%(+13.3)#1,636 |
| 49. | Walla Walla East | 24.1% | 12.0%(+12.1)#49 | 11.0%(+13.1)#1,691 |
| 50. | Lebam | 23.5% | 12.0%(+11.5)#50 | 11.0%(+12.5)#1,804 |
| 51. | Langley | 22.9% | 12.0%(+10.9)#51 | 11.0%(+11.8)#1,941 |
| 52. | Mcmillin | 22.8% | 12.0%(+10.8)#52 | 11.0%(+11.8)#1,966 |
| 53. | Pataha | 22.5% | 12.0%(+10.5)#53 | 11.0%(+11.5)#2,028 |
| 54. | Sammamish | 22.5% | 12.0%(+10.5)#54 | 11.0%(+11.4)#2,033 |
| 55. | Snoqualmie | 22.4% | 12.0%(+10.4)#55 | 11.0%(+11.4)#2,049 |
| 56. | Fall City | 22.0% | 12.0%(+9.99)#56 | 11.0%(+11.0)#2,135 |
| 57. | Brier | 22.0% | 12.0%(+9.98)#57 | 11.0%(+10.9)#2,137 |
| 58. | Almira | 21.9% | 12.0%(+9.89)#58 | 11.0%(+10.9)#2,168 |
| 59. | Maple Heights Lake Desire | 21.9% | 12.0%(+9.88)#59 | 11.0%(+10.8)#2,171 |
| 60. | Cusick | 21.8% | 12.0%(+9.83)#60 | 11.0%(+10.8)#2,182 |
| 61. | Lake Marcel Stillwater | 21.8% | 12.0%(+9.83)#61 | 11.0%(+10.8)#2,187 |
| 62. | Palouse | 21.8% | 12.0%(+9.82)#62 | 11.0%(+10.8)#2,189 |
| 63. | East Renton Highlands | 21.6% | 12.0%(+9.60)#63 | 11.0%(+10.6)#2,250 |
| 64. | Fox Island | 21.5% | 12.0%(+9.56)#64 | 11.0%(+10.5)#2,256 |
| 65. | Colton | 21.4% | 12.0%(+9.40)#65 | 11.0%(+10.4)#2,297 |
| 66. | Wilbur | 21.1% | 12.0%(+9.09)#66 | 11.0%(+10.1)#2,395 |
| 67. | Duvall | 21.1% | 12.0%(+9.07)#67 | 11.0%(+10.0)#2,399 |
| 68. | Mercer Island | 20.7% | 12.0%(+8.69)#68 | 11.0%(+9.65)#2,527 |
| 69. | Lake Bosworth | 20.7% | 12.0%(+8.67)#69 | 11.0%(+9.63)#2,532 |
| 70. | Upper Elochoman | 20.6% | 12.0%(+8.65)#70 | 11.0%(+9.62)#2,541 |
| 71. | Bryant | 20.4% | 12.0%(+8.42)#71 | 11.0%(+9.39)#2,606 |
| 72. | Allyn | 20.3% | 12.0%(+8.32)#72 | 11.0%(+9.28)#2,635 |
| 73. | Normandy Park | 20.3% | 12.0%(+8.31)#73 | 11.0%(+9.28)#2,637 |
| 74. | Lyman | 20.3% | 12.0%(+8.30)#74 | 11.0%(+9.26)#2,645 |
| 75. | Fern Prairie | 20.3% | 12.0%(+8.29)#75 | 11.0%(+9.26)#2,650 |
| 76. | Creston | 20.3% | 12.0%(+8.28)#76 | 11.0%(+9.25)#2,654 |
| 77. | Clinton | 20.2% | 12.0%(+8.20)#77 | 11.0%(+9.16)#2,681 |
| 78. | Woodinville | 20.0% | 12.0%(+7.98)#78 | 11.0%(+8.94)#2,785 |
| 79. | Concrete | 19.9% | 12.0%(+7.95)#79 | 11.0%(+8.91)#2,793 |
| 80. | Woods Creek | 19.8% | 12.0%(+7.86)#80 | 11.0%(+8.82)#2,819 |
| 81. | Lewisville | 19.8% | 12.0%(+7.81)#81 | 11.0%(+8.77)#2,840 |
| 82. | Amboy | 19.7% | 12.0%(+7.73)#82 | 11.0%(+8.69)#2,867 |
| 83. | Browns Point | 19.7% | 12.0%(+7.67)#83 | 11.0%(+8.63)#2,883 |
| 84. | Esperance | 19.5% | 12.0%(+7.55)#84 | 11.0%(+8.52)#2,924 |
| 85. | White Salmon | 19.3% | 12.0%(+7.35)#85 | 11.0%(+8.31)#3,008 |
| 86. | Felida | 19.2% | 12.0%(+7.23)#86 | 11.0%(+8.19)#3,063 |
| 87. | Torboy | 19.1% | 12.0%(+7.10)#87 | 11.0%(+8.06)#3,112 |
| 88. | Reardan | 18.9% | 12.0%(+6.89)#88 | 11.0%(+7.85)#3,187 |
| 89. | Lake Tapps | 18.8% | 12.0%(+6.83)#89 | 11.0%(+7.79)#3,215 |
| 90. | Curlew Lake | 18.8% | 12.0%(+6.82)#90 | 11.0%(+7.78)#3,217 |
| 91. | Bainbridge Island | 18.5% | 12.0%(+6.48)#91 | 11.0%(+7.44)#3,366 |
| 92. | Shadow Lake | 18.5% | 12.0%(+6.47)#92 | 11.0%(+7.44)#3,372 |
| 93. | Riverpoint | 18.4% | 12.0%(+6.41)#93 | 11.0%(+7.37)#3,413 |
| 94. | Electric City | 18.3% | 12.0%(+6.27)#94 | 11.0%(+7.24)#3,496 |
| 95. | Inchelium | 17.9% | 12.0%(+5.96)#95 | 11.0%(+6.93)#3,643 |
| 96. | Home | 17.9% | 12.0%(+5.90)#96 | 11.0%(+6.86)#3,689 |
| 97. | Freeland | 17.8% | 12.0%(+5.79)#97 | 11.0%(+6.76)#3,736 |
| 98. | Elmer City | 17.8% | 12.0%(+5.79)#98 | 11.0%(+6.76)#3,740 |
| 99. | Vashon | 17.7% | 12.0%(+5.76)#99 | 11.0%(+6.72)#3,757 |
| 100. | Cottage Lake | 17.7% | 12.0%(+5.74)#100 | 11.0%(+6.71)#3,769 |
Common Questions
What are the Top 10 Cities with the Highest Percentage of Population Employed in Management in Washington?
Top 10 Cities with the Highest Percentage of Population Employed in Management in Washington are:
#1
100.0%
#2
100.0%
#3
56.8%
#4
56.7%
#5
56.5%
#6
49.3%
#7
42.6%
#8
40.0%
#9
39.8%
#10
39.2%
What city has the Highest Percentage of Population Employed in Management in Washington?
Barstow has the Highest Percentage of Population Employed in Management in Washington with 100.0%.
What is the Percentage of Population Employed in Management in the State of Washington?
Percentage of Population Employed in Management in Washington is 12.0%.
What is the Percentage of Population Employed in Management in the United States?
Percentage of Population Employed in Management in the United States is 11.0%.