Cities with the Largest Burmese Community in Washington
RELATED REPORTS & OPTIONS
Burmese
Washington
Compare Cities
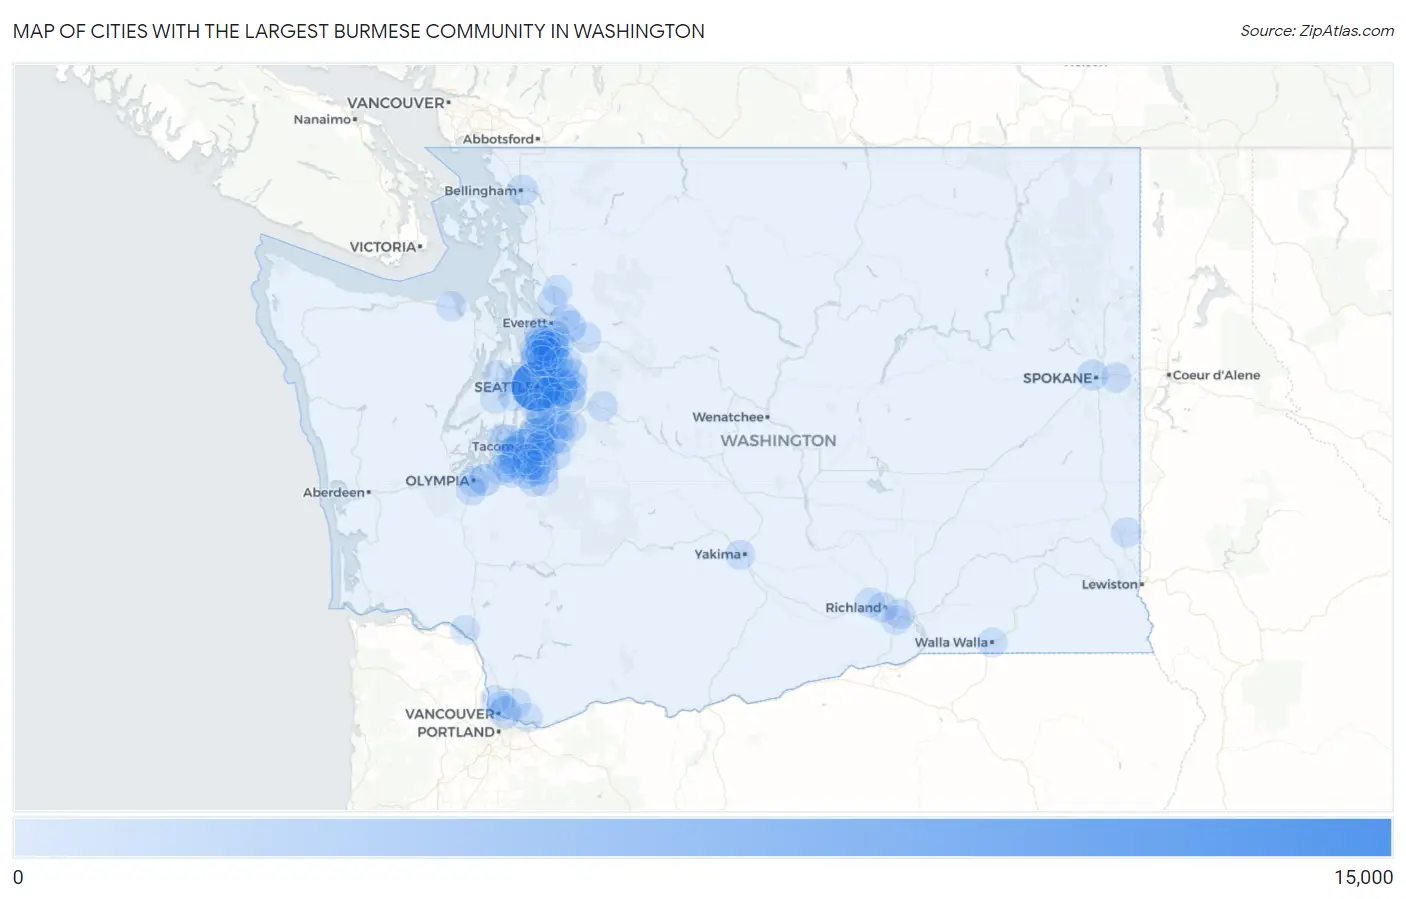
Map of Cities with the Largest Burmese Community in Washington
0
15,000
Cities with the Largest Burmese Community in Washington
| City | Burmese | vs State | vs National | |
| 1. | Seattle | 14,448 | 100,159(14.43%)#1 | 1,977,441(0.73%)#10 |
| 2. | Bellevue | 5,617 | 100,159(5.61%)#2 | 1,977,441(0.28%)#25 |
| 3. | Federal Way | 4,479 | 100,159(4.47%)#3 | 1,977,441(0.23%)#37 |
| 4. | Tacoma | 3,676 | 100,159(3.67%)#4 | 1,977,441(0.19%)#53 |
| 5. | Renton | 2,457 | 100,159(2.45%)#5 | 1,977,441(0.12%)#101 |
| 6. | Lakewood | 2,315 | 100,159(2.31%)#6 | 1,977,441(0.12%)#111 |
| 7. | Vancouver | 1,924 | 100,159(1.92%)#7 | 1,977,441(0.10%)#143 |
| 8. | Kirkland | 1,883 | 100,159(1.88%)#8 | 1,977,441(0.10%)#151 |
| 9. | Auburn | 1,774 | 100,159(1.77%)#9 | 1,977,441(0.09%)#163 |
| 10. | Mukilteo | 1,697 | 100,159(1.69%)#10 | 1,977,441(0.09%)#168 |
| 11. | Lynnwood | 1,691 | 100,159(1.69%)#11 | 1,977,441(0.09%)#170 |
| 12. | Sammamish | 1,675 | 100,159(1.67%)#12 | 1,977,441(0.08%)#171 |
| 13. | University Place | 1,654 | 100,159(1.65%)#13 | 1,977,441(0.08%)#173 |
| 14. | South Hill | 1,582 | 100,159(1.58%)#14 | 1,977,441(0.08%)#184 |
| 15. | Lacey | 1,552 | 100,159(1.55%)#15 | 1,977,441(0.08%)#189 |
| 16. | Shoreline | 1,544 | 100,159(1.54%)#16 | 1,977,441(0.08%)#190 |
| 17. | Issaquah | 1,515 | 100,159(1.51%)#17 | 1,977,441(0.08%)#192 |
| 18. | Spanaway | 1,512 | 100,159(1.51%)#18 | 1,977,441(0.08%)#193 |
| 19. | North Lynnwood | 1,471 | 100,159(1.47%)#19 | 1,977,441(0.07%)#196 |
| 20. | Everett | 1,452 | 100,159(1.45%)#20 | 1,977,441(0.07%)#202 |
| 21. | Parkland | 1,393 | 100,159(1.39%)#21 | 1,977,441(0.07%)#213 |
| 22. | Mercer Island | 1,110 | 100,159(1.11%)#22 | 1,977,441(0.06%)#278 |
| 23. | Redmond | 1,059 | 100,159(1.06%)#23 | 1,977,441(0.05%)#292 |
| 24. | Mill Creek | 942 | 100,159(0.94%)#24 | 1,977,441(0.05%)#326 |
| 25. | Kent | 911 | 100,159(0.91%)#25 | 1,977,441(0.05%)#334 |
| 26. | Eastmont | 870 | 100,159(0.87%)#26 | 1,977,441(0.04%)#351 |
| 27. | Olympia | 847 | 100,159(0.85%)#27 | 1,977,441(0.04%)#358 |
| 28. | Lake Stickney | 834 | 100,159(0.83%)#28 | 1,977,441(0.04%)#364 |
| 29. | Spokane | 744 | 100,159(0.74%)#29 | 1,977,441(0.04%)#403 |
| 30. | Kenmore | 734 | 100,159(0.73%)#30 | 1,977,441(0.04%)#409 |
| 31. | Martha Lake | 731 | 100,159(0.73%)#31 | 1,977,441(0.04%)#412 |
| 32. | Bellingham | 680 | 100,159(0.68%)#32 | 1,977,441(0.03%)#444 |
| 33. | Lakeland North | 642 | 100,159(0.64%)#33 | 1,977,441(0.03%)#462 |
| 34. | Maple Valley | 616 | 100,159(0.62%)#34 | 1,977,441(0.03%)#476 |
| 35. | Mill Creek East | 614 | 100,159(0.61%)#35 | 1,977,441(0.03%)#477 |
| 36. | Bothell | 574 | 100,159(0.57%)#36 | 1,977,441(0.03%)#507 |
| 37. | Lakeland South | 573 | 100,159(0.57%)#37 | 1,977,441(0.03%)#510 |
| 38. | Newcastle | 567 | 100,159(0.57%)#38 | 1,977,441(0.03%)#515 |
| 39. | Bothell East | 540 | 100,159(0.54%)#39 | 1,977,441(0.03%)#535 |
| 40. | Bothell West | 535 | 100,159(0.53%)#40 | 1,977,441(0.03%)#544 |
| 41. | Union Hill Novelty Hill | 531 | 100,159(0.53%)#41 | 1,977,441(0.03%)#547 |
| 42. | Elk Plain | 530 | 100,159(0.53%)#42 | 1,977,441(0.03%)#548 |
| 43. | Edmonds | 527 | 100,159(0.53%)#43 | 1,977,441(0.03%)#552 |
| 44. | Silver Firs | 517 | 100,159(0.52%)#44 | 1,977,441(0.03%)#563 |
| 45. | Esperance | 510 | 100,159(0.51%)#45 | 1,977,441(0.03%)#568 |
| 46. | Burien | 505 | 100,159(0.50%)#46 | 1,977,441(0.03%)#574 |
| 47. | Richland | 486 | 100,159(0.49%)#47 | 1,977,441(0.02%)#603 |
| 48. | Fife | 468 | 100,159(0.47%)#48 | 1,977,441(0.02%)#630 |
| 49. | Fircrest | 468 | 100,159(0.47%)#49 | 1,977,441(0.02%)#631 |
| 50. | Edgewood | 457 | 100,159(0.46%)#50 | 1,977,441(0.02%)#642 |
| 51. | Larch Way | 442 | 100,159(0.44%)#51 | 1,977,441(0.02%)#659 |
| 52. | Puyallup | 416 | 100,159(0.42%)#52 | 1,977,441(0.02%)#695 |
| 53. | Picnic Point | 416 | 100,159(0.42%)#53 | 1,977,441(0.02%)#696 |
| 54. | Fairwood Cdp King County | 408 | 100,159(0.41%)#54 | 1,977,441(0.02%)#713 |
| 55. | Tumwater | 370 | 100,159(0.37%)#55 | 1,977,441(0.02%)#786 |
| 56. | North Bend | 368 | 100,159(0.37%)#56 | 1,977,441(0.02%)#796 |
| 57. | Pasco | 364 | 100,159(0.36%)#57 | 1,977,441(0.02%)#799 |
| 58. | Pullman | 364 | 100,159(0.36%)#58 | 1,977,441(0.02%)#802 |
| 59. | Dupont | 350 | 100,159(0.35%)#59 | 1,977,441(0.02%)#833 |
| 60. | Alderwood Manor | 347 | 100,159(0.35%)#60 | 1,977,441(0.02%)#842 |
| 61. | Frederickson | 307 | 100,159(0.31%)#61 | 1,977,441(0.02%)#939 |
| 62. | Spokane Valley | 301 | 100,159(0.30%)#62 | 1,977,441(0.02%)#955 |
| 63. | Marysville | 299 | 100,159(0.30%)#63 | 1,977,441(0.02%)#958 |
| 64. | Cottage Lake | 297 | 100,159(0.30%)#64 | 1,977,441(0.02%)#962 |
| 65. | Tehaleh | 297 | 100,159(0.30%)#65 | 1,977,441(0.02%)#964 |
| 66. | Mountlake Terrace | 293 | 100,159(0.29%)#66 | 1,977,441(0.01%)#975 |
| 67. | Lake Forest Park | 291 | 100,159(0.29%)#67 | 1,977,441(0.01%)#980 |
| 68. | Lake Holm | 291 | 100,159(0.29%)#68 | 1,977,441(0.01%)#982 |
| 69. | Bonney Lake | 271 | 100,159(0.27%)#69 | 1,977,441(0.01%)#1,042 |
| 70. | Summit View | 261 | 100,159(0.26%)#70 | 1,977,441(0.01%)#1,067 |
| 71. | Artondale | 257 | 100,159(0.26%)#71 | 1,977,441(0.01%)#1,080 |
| 72. | Yakima | 253 | 100,159(0.25%)#72 | 1,977,441(0.01%)#1,090 |
| 73. | Clover Creek | 252 | 100,159(0.25%)#73 | 1,977,441(0.01%)#1,096 |
| 74. | Woods Creek | 246 | 100,159(0.25%)#74 | 1,977,441(0.01%)#1,122 |
| 75. | Lake Stevens | 244 | 100,159(0.24%)#75 | 1,977,441(0.01%)#1,126 |
| 76. | Kennewick | 238 | 100,159(0.24%)#76 | 1,977,441(0.01%)#1,141 |
| 77. | Orchards | 238 | 100,159(0.24%)#77 | 1,977,441(0.01%)#1,142 |
| 78. | Graham | 237 | 100,159(0.24%)#78 | 1,977,441(0.01%)#1,148 |
| 79. | Fort Lewis | 237 | 100,159(0.24%)#79 | 1,977,441(0.01%)#1,149 |
| 80. | Des Moines | 228 | 100,159(0.23%)#80 | 1,977,441(0.01%)#1,186 |
| 81. | Woodinville | 216 | 100,159(0.22%)#81 | 1,977,441(0.01%)#1,230 |
| 82. | Manchester | 195 | 100,159(0.19%)#82 | 1,977,441(0.01%)#1,316 |
| 83. | Seatac | 187 | 100,159(0.19%)#83 | 1,977,441(0.01%)#1,354 |
| 84. | Silverdale | 186 | 100,159(0.19%)#84 | 1,977,441(0.01%)#1,360 |
| 85. | Covington | 179 | 100,159(0.18%)#85 | 1,977,441(0.01%)#1,404 |
| 86. | Felida | 170 | 100,159(0.17%)#86 | 1,977,441(0.01%)#1,455 |
| 87. | Steilacoom | 168 | 100,159(0.17%)#87 | 1,977,441(0.01%)#1,464 |
| 88. | Camas | 164 | 100,159(0.16%)#88 | 1,977,441(0.01%)#1,487 |
| 89. | Wollochet | 159 | 100,159(0.16%)#89 | 1,977,441(0.01%)#1,521 |
| 90. | Bremerton | 156 | 100,159(0.16%)#90 | 1,977,441(0.01%)#1,537 |
| 91. | West Richland | 154 | 100,159(0.15%)#91 | 1,977,441(0.01%)#1,558 |
| 92. | Milton | 150 | 100,159(0.15%)#92 | 1,977,441(0.01%)#1,584 |
| 93. | Longview | 142 | 100,159(0.14%)#93 | 1,977,441(0.01%)#1,640 |
| 94. | Sequim | 140 | 100,159(0.14%)#94 | 1,977,441(0.01%)#1,656 |
| 95. | Bainbridge Island | 138 | 100,159(0.14%)#95 | 1,977,441(0.01%)#1,669 |
| 96. | Hazel Dell | 138 | 100,159(0.14%)#96 | 1,977,441(0.01%)#1,670 |
| 97. | Arlington | 134 | 100,159(0.13%)#97 | 1,977,441(0.01%)#1,702 |
| 98. | Midland | 134 | 100,159(0.13%)#98 | 1,977,441(0.01%)#1,706 |
| 99. | North Fort Lewis | 121 | 100,159(0.12%)#99 | 1,977,441(0.01%)#1,812 |
| 100. | Walla Walla | 120 | 100,159(0.12%)#100 | 1,977,441(0.01%)#1,813 |
Common Questions
What are the Top 10 Cities with the Largest Burmese Community in Washington?
Top 10 Cities with the Largest Burmese Community in Washington are:
What city has the Largest Burmese Community in Washington?
Seattle has the Largest Burmese Community in Washington with 14,448.
What is the Total Burmese Population in the State of Washington?
Total Burmese Population in Washington is 100,159.
What is the Total Burmese Population in the United States?
Total Burmese Population in the United States is 1,977,441.