Cities with the Highest Percentage of Births to Unmarried Women under the Age of 20 in Washington

RELATED REPORTS & OPTIONS

Highest Illegitimacy | Women 15-19
Population
Families and Households
Female Fertility
Female Fertility (Unmarried)
Race (Community Size)
Race (Percentage)
Ancestry (Community Size)
AfghanAfricanAlaska NativeAlaskan AthabascanAlbanianAleutAlsatianAmericanApacheArabArapahoArgentineanArmenianAssyrian / Chaldean / SyriacAustralianAustrianBahamianBangladeshiBarbadianBasqueBelgianBelizeanBermudanBhutaneseBlackfeetBolivianBrazilianBritishBritish West IndianBulgarianBurmeseCajunCambodianCanadianCape VerdeanCarpatho RusynCelticCentral AmericanCentral American IndianCherokeeCheyenneChickasawChileanChineseChippewaChoctawColombianColvilleComancheCosta RicanCreeCreekCroatianCrowCubanCypriotCzechCzechoslovakianDanishDelawareDominicanDutchDutch West IndianEastern EuropeanEcuadorianEgyptianEnglishEstonianEthiopianEuropeanFijianFilipinoFinnishFrenchFrench American IndianFrench CanadianGermanGerman RussianGhanaianGreekGuamanian / ChamorroGuatemalanGuyaneseHaitianHmongHonduranHopiHoumaHungarianIcelanderIndian (Asian)IndonesianInupiatIranianIraqiIrishIroquoisIsraeliItalianJamaicanJapaneseJordanianKenyanKiowaKoreanLaotianLatvianLebaneseLiberianLithuanianLumbeeLuxembourgerMacedonianMalaysianMalteseMarshalleseMenomineeMexicanMexican American IndianMongolianMoroccanNative HawaiianNavajoNepaleseNew ZealanderNicaraguanNigerianNorthern EuropeanNorwegianOkinawanOsageOttawaPaiutePakistaniPalestinianPanamanianParaguayanPennsylvania GermanPeruvianPimaPolishPortuguesePotawatomiPuebloPuerto RicanPuget Sound SalishRomanianRussianSalvadoranSamoanScandinavianScotch-IrishScottishSeminoleSenegaleseSerbianShoshoneSierra LeoneanSiouxSlavicSlovakSloveneSomaliSouth AfricanSouth AmericanSouth American IndianSoviet UnionSpaniardSpanishSpanish AmericanSpanish American IndianSri LankanSubsaharan AfricanSudaneseSwedishSwissSyrianTaiwaneseThaiTlingit-HaidaTohono O'OdhamTonganTrinidadian and TobagonianTsimshianTurkishU.S. Virgin IslanderUgandanUkrainianUruguayanUteVenezuelanVietnameseWelshWest IndianYakamaYaquiYugoslavianYumanYup'ikZimbabwean
Ancestry (Percentage)
AfghanAfricanAlaska NativeAlaskan AthabascanAlbanianAleutAlsatianAmericanApacheArabArapahoArgentineanArmenianAssyrian / Chaldean / SyriacAustralianAustrianBahamianBangladeshiBarbadianBasqueBelgianBelizeanBermudanBhutaneseBlackfeetBolivianBrazilianBritishBritish West IndianBulgarianBurmeseCajunCambodianCanadianCape VerdeanCarpatho RusynCelticCentral AmericanCentral American IndianCherokeeCheyenneChickasawChileanChineseChippewaChoctawColombianColvilleComancheCosta RicanCreeCreekCroatianCrowCubanCypriotCzechCzechoslovakianDanishDelawareDominicanDutchDutch West IndianEastern EuropeanEcuadorianEgyptianEnglishEstonianEthiopianEuropeanFijianFilipinoFinnishFrenchFrench American IndianFrench CanadianGermanGerman RussianGhanaianGreekGuamanian / ChamorroGuatemalanGuyaneseHaitianHmongHonduranHopiHoumaHungarianIcelanderIndian (Asian)IndonesianInupiatIranianIraqiIrishIroquoisIsraeliItalianJamaicanJapaneseJordanianKenyanKiowaKoreanLaotianLatvianLebaneseLiberianLithuanianLumbeeLuxembourgerMacedonianMalaysianMalteseMarshalleseMenomineeMexicanMexican American IndianMongolianMoroccanNative HawaiianNavajoNepaleseNew ZealanderNicaraguanNigerianNorthern EuropeanNorwegianOkinawanOsageOttawaPaiutePakistaniPalestinianPanamanianParaguayanPennsylvania GermanPeruvianPimaPolishPortuguesePotawatomiPuebloPuerto RicanPuget Sound SalishRomanianRussianSalvadoranSamoanScandinavianScotch-IrishScottishSeminoleSenegaleseSerbianShoshoneSierra LeoneanSiouxSlavicSlovakSloveneSomaliSouth AfricanSouth AmericanSouth American IndianSoviet UnionSpaniardSpanishSpanish AmericanSpanish American IndianSri LankanSubsaharan AfricanSudaneseSwedishSwissSyrianTaiwaneseThaiTlingit-HaidaTohono O'OdhamTonganTrinidadian and TobagonianTsimshianTurkishU.S. Virgin IslanderUgandanUkrainianUruguayanUteVenezuelanVietnameseWelshWest IndianYakamaYaquiYugoslavianYumanYup'ikZimbabwean
Immigrant Origin (Total)
AfghanistanAfricaAlbaniaArgentinaArmeniaAsiaAustraliaAustriaAzoresBahamasBangladeshBarbadosBelarusBelgiumBelizeBoliviaBosnia and HerzegovinaBrazilBulgariaBurma / MyanmarCabo VerdeCambodiaCameroonCanadaCaribbeanCentral AmericaChileChinaColombiaCongoCosta RicaCroatiaCubaCzechoslovakiaDenmarkDominicaDominican RepublicEastern AfricaEastern AsiaEastern EuropeEcuadorEgyptEl SalvadorEnglandEritreaEthiopiaEuropeFijiFranceGermanyGhanaGreeceGrenadaGuatemalaGuyanaHaitiHondurasHong KongHungaryIndiaIndonesiaIranIraqIrelandIsraelItalyJamaicaJapanJordanKazakhstanKenyaKoreaKuwaitLaosLatin AmericaLatviaLebanonLiberiaLithuaniaMalaysiaMexicoMicronesiaMiddle AfricaMoldovaMoroccoNepalNetherlandsNicaraguaNigeriaNorth MacedoniaNorthern AfricaNorthern EuropeNorwayOceaniaPakistanPanamaPeruPhilippinesPolandPortugalRomaniaRussiaSaudi ArabiaScotlandSenegalSerbiaSierra LeoneSingaporeSomaliaSouth AfricaSouth AmericaSouth Central AsiaSouth Eastern AsiaSouthern EuropeSpainSri LankaSt. Vincent and the GrenadinesSudanSwedenSwitzerlandSyriaTaiwanThailandTrinidad and TobagoTurkeyUgandaUkraineUruguayUzbekistanVenezuelaVietnamWest IndiesWestern AfricaWestern AsiaWestern EuropeYemenZaireZimbabwe
Immigrant Origin (Percentage)
AfghanistanAfricaAlbaniaArgentinaArmeniaAsiaAustraliaAustriaAzoresBahamasBangladeshBarbadosBelarusBelgiumBelizeBoliviaBosnia and HerzegovinaBrazilBulgariaBurma / MyanmarCabo VerdeCambodiaCameroonCanadaCaribbeanCentral AmericaChileChinaColombiaCongoCosta RicaCroatiaCubaCzechoslovakiaDenmarkDominicaDominican RepublicEastern AfricaEastern AsiaEastern EuropeEcuadorEgyptEl SalvadorEnglandEritreaEthiopiaEuropeFijiFranceGermanyGhanaGreeceGrenadaGuatemalaGuyanaHaitiHondurasHong KongHungaryIndiaIndonesiaIranIraqIrelandIsraelItalyJamaicaJapanJordanKazakhstanKenyaKoreaKuwaitLaosLatin AmericaLatviaLebanonLiberiaLithuaniaMalaysiaMexicoMicronesiaMiddle AfricaMoldovaMoroccoNepalNetherlandsNicaraguaNigeriaNorth MacedoniaNorthern AfricaNorthern EuropeNorwayOceaniaPakistanPanamaPeruPhilippinesPolandPortugalRomaniaRussiaSaudi ArabiaScotlandSenegalSerbiaSierra LeoneSingaporeSomaliaSouth AfricaSouth AmericaSouth Central AsiaSouth Eastern AsiaSouthern EuropeSpainSri LankaSt. Vincent and the GrenadinesSudanSwedenSwitzerlandSyriaTaiwanThailandTrinidad and TobagoTurkeyUgandaUkraineUruguayUzbekistanVenezuelaVietnamWest IndiesWestern AfricaWestern AsiaWestern EuropeYemenZaireZimbabwe
Income
Income (Families)
Income (Households)
Poverty
Poverty (Families)
Unemployment
Employment Occupations
Employment Industries
Employer Class
Commute Time
Commute Means
School Enrollment
Education by Degree Field
Occupancy
Finances
Physical Characteristics
Washington
Compare Cities
Comparison Subject

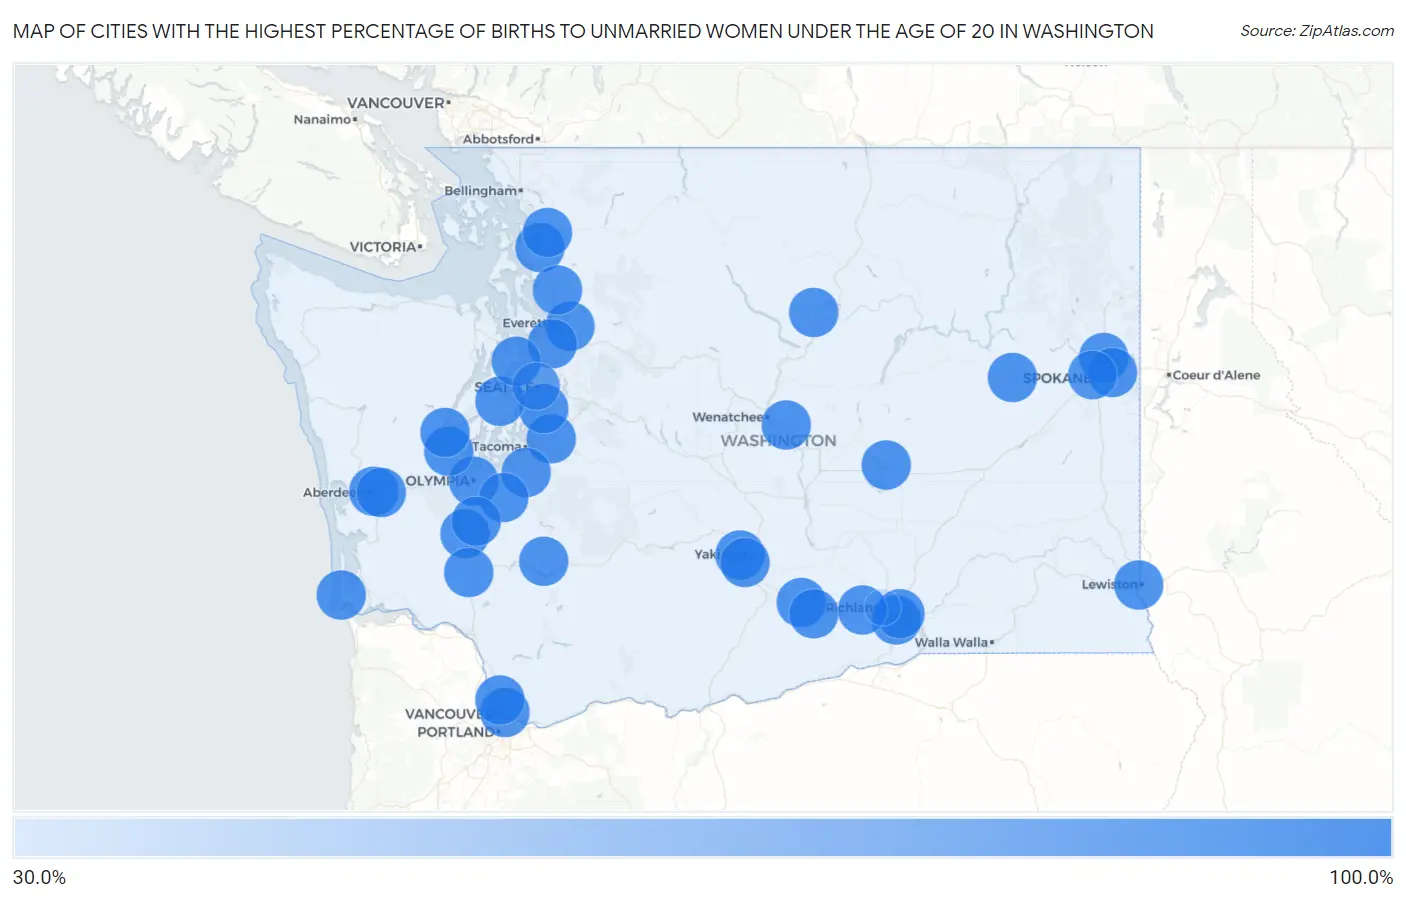
Map of Cities with the Highest Percentage of Births to Unmarried Women under the Age of 20 in Washington

0.0%
100.0%
Cities with the Highest Percentage of Births to Unmarried Women under the Age of 20 in Washington Map

Cities with the Highest Percentage of Births to Unmarried Women under the Age of 20 in Washington

City % Unmarried vs State vs National
1.Vancouver100.0%82.8%(+17.2)#186.9%(+13.1)#64
2.Everett100.0%82.8%(+17.2)#286.9%(+13.1)#141
3.Yakima100.0%82.8%(+17.2)#386.9%(+13.1)#173
4.Auburn100.0%82.8%(+17.2)#486.9%(+13.1)#206
5.Kennewick100.0%82.8%(+17.2)#586.9%(+13.1)#210
6.Pasco100.0%82.8%(+17.2)#686.9%(+13.1)#230
7.Olympia100.0%82.8%(+17.2)#786.9%(+13.1)#329
8.Mount Vernon100.0%82.8%(+17.2)#886.9%(+13.1)#475
9.Spanaway100.0%82.8%(+17.2)#986.9%(+13.1)#486
10.Moses Lake100.0%82.8%(+17.2)#1086.9%(+13.1)#587
11.Tukwila100.0%82.8%(+17.2)#1186.9%(+13.1)#645
12.Mill Creek100.0%82.8%(+17.2)#1286.9%(+13.1)#660
13.Salmon Creek100.0%82.8%(+17.2)#1386.9%(+13.1)#673
14.Arlington100.0%82.8%(+17.2)#1486.9%(+13.1)#674
15.Centralia100.0%82.8%(+17.2)#1586.9%(+13.1)#710
16.Aberdeen100.0%82.8%(+17.2)#1686.9%(+13.1)#732
17.Sunnyside100.0%82.8%(+17.2)#1786.9%(+13.1)#757
18.Port Orchard100.0%82.8%(+17.2)#1886.9%(+13.1)#771
19.Sedro Woolley100.0%82.8%(+17.2)#1986.9%(+13.1)#871
20.Grandview100.0%82.8%(+17.2)#2086.9%(+13.1)#911
21.Shelton100.0%82.8%(+17.2)#2186.9%(+13.1)#926
22.Yelm100.0%82.8%(+17.2)#2286.9%(+13.1)#929
23.Clarkston100.0%82.8%(+17.2)#2386.9%(+13.1)#1,053
24.Mead100.0%82.8%(+17.2)#2486.9%(+13.1)#1,054
25.Union Gap100.0%82.8%(+17.2)#2586.9%(+13.1)#1,072
26.Indianola100.0%82.8%(+17.2)#2686.9%(+13.1)#1,226
27.Benton City100.0%82.8%(+17.2)#2786.9%(+13.1)#1,233
28.Central Park100.0%82.8%(+17.2)#2886.9%(+13.1)#1,239
29.Winlock100.0%82.8%(+17.2)#2986.9%(+13.1)#1,409
30.Millwood100.0%82.8%(+17.2)#3086.9%(+13.1)#1,417
31.Davenport100.0%82.8%(+17.2)#3186.9%(+13.1)#1,430
32.Long Beach100.0%82.8%(+17.2)#3286.9%(+13.1)#1,434
33.Morton100.0%82.8%(+17.2)#3386.9%(+13.1)#1,534
34.Rock Island100.0%82.8%(+17.2)#3486.9%(+13.1)#1,552
35.Pateros100.0%82.8%(+17.2)#3586.9%(+13.1)#1,723
36.Skokomish100.0%82.8%(+17.2)#3686.9%(+13.1)#1,732
37.Bucoda100.0%82.8%(+17.2)#3786.9%(+13.1)#1,762
38.Spokane96.9%82.8%(+14.1)#3886.9%(+10.00)#1,952
39.Seattle89.6%82.8%(+6.80)#3986.9%(+2.70)#1,974
40.Richland33.9%82.8%(-48.9)#4086.9%(-53.0)#2,110

Common Questions

What are the Top 10 Cities with the Highest Percentage of Births to Unmarried Women under the Age of 20 in Washington?
Top 10 Cities with the Highest Percentage of Births to Unmarried Women under the Age of 20 in Washington are:
#1
100.0%
#2
100.0%
#3
100.0%
#4
100.0%
#5
100.0%
#6
100.0%
#7
100.0%
#8
100.0%
#9
100.0%
#10
100.0%
What city has the Highest Percentage of Births to Unmarried Women under the Age of 20 in Washington?
Vancouver has the Highest Percentage of Births to Unmarried Women under the Age of 20 in Washington with 100.0%.
What is the Percentage of Births to Unmarried Women under the Age of 20 in the State of Washington?
Percentage of Births to Unmarried Women under the Age of 20 in Washington is 82.8%.
What is the Percentage of Births to Unmarried Women under the Age of 20 in the United States?
Percentage of Births to Unmarried Women under the Age of 20 in the United States is 86.9%.