Cities with the Highest Percentage of Spaniard Population in Washington
RELATED REPORTS & OPTIONS
Spaniard
Washington
Compare Cities
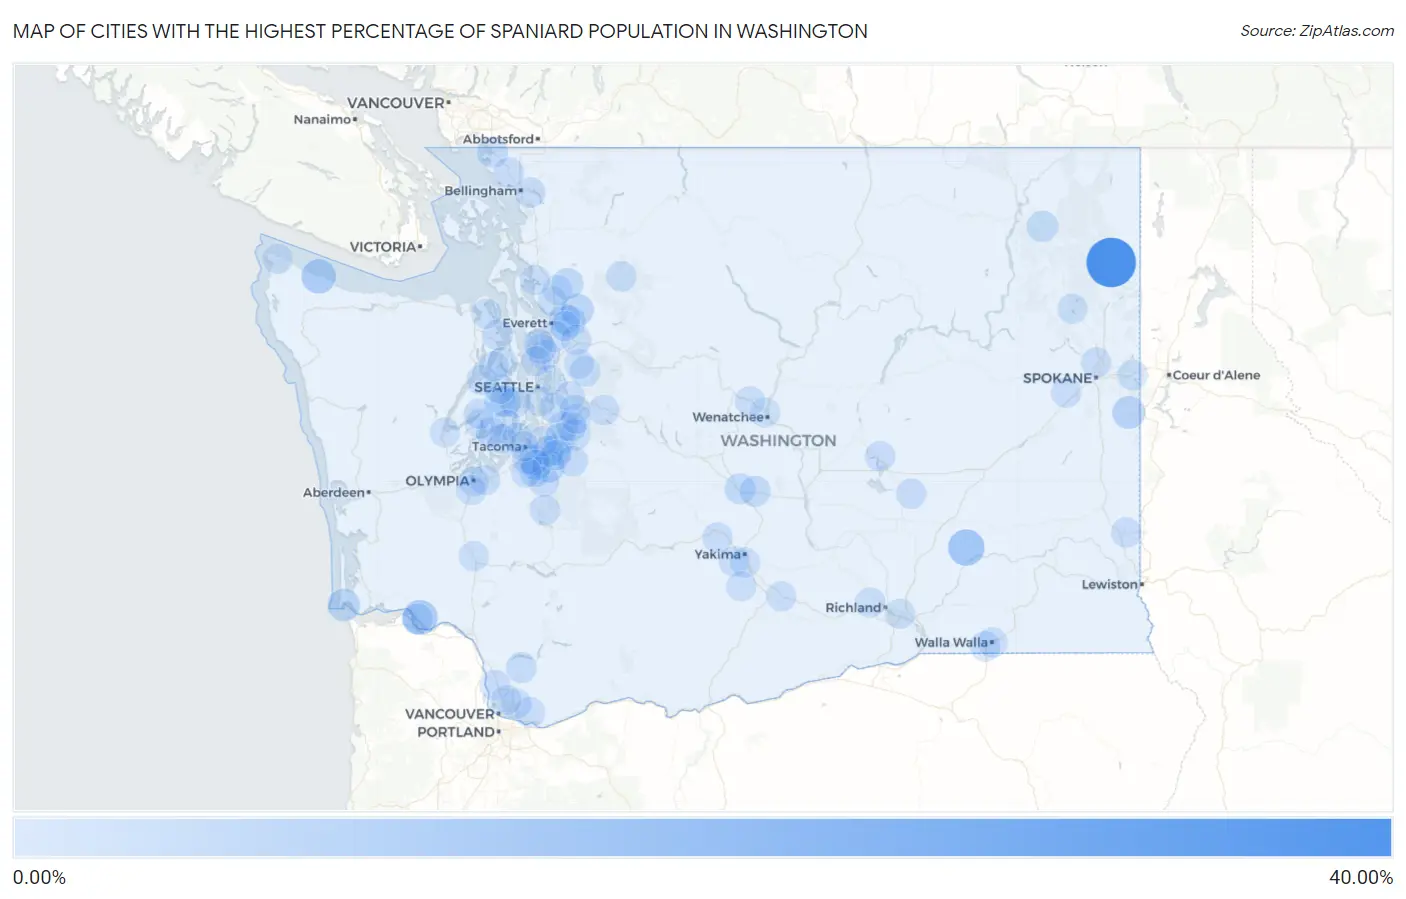
Map of Cities with the Highest Percentage of Spaniard Population in Washington
0.00%
40.00%
Cities with the Highest Percentage of Spaniard Population in Washington
| City | Spaniard | vs State | vs National | |
| 1. | Cusick | 32.97% | 0.35%(+32.6)#1 | 0.29%(+32.7)#19 |
| 2. | Kahlotus | 10.45% | 0.35%(+10.1)#2 | 0.29%(+10.2)#107 |
| 3. | Lower Elochoman | 8.09% | 0.35%(+7.74)#3 | 0.29%(+7.80)#145 |
| 4. | Clallam Bay | 7.36% | 0.35%(+7.01)#4 | 0.29%(+7.07)#171 |
| 5. | Rockford | 4.65% | 0.35%(+4.30)#5 | 0.29%(+4.37)#299 |
| 6. | Ilwaco | 4.47% | 0.35%(+4.12)#6 | 0.29%(+4.18)#315 |
| 7. | Lake Bosworth | 4.15% | 0.35%(+3.80)#7 | 0.29%(+3.87)#344 |
| 8. | Mcmillin | 4.02% | 0.35%(+3.67)#8 | 0.29%(+3.73)#360 |
| 9. | Port Orchard | 2.75% | 0.35%(+2.40)#9 | 0.29%(+2.46)#545 |
| 10. | Arlington Heights | 2.72% | 0.35%(+2.37)#10 | 0.29%(+2.44)#555 |
| 11. | Machias | 2.70% | 0.35%(+2.35)#11 | 0.29%(+2.41)#561 |
| 12. | Colville | 2.33% | 0.35%(+1.98)#12 | 0.29%(+2.05)#633 |
| 13. | Frederickson | 2.02% | 0.35%(+1.67)#13 | 0.29%(+1.74)#747 |
| 14. | Tehaleh | 2.00% | 0.35%(+1.65)#14 | 0.29%(+1.72)#756 |
| 15. | Ellensburg | 1.99% | 0.35%(+1.64)#15 | 0.29%(+1.70)#762 |
| 16. | Kittitas | 1.95% | 0.35%(+1.60)#16 | 0.29%(+1.67)#776 |
| 17. | East Port Orchard | 1.95% | 0.35%(+1.59)#17 | 0.29%(+1.66)#782 |
| 18. | Lake Holm | 1.94% | 0.35%(+1.59)#18 | 0.29%(+1.66)#783 |
| 19. | Lake Marcel Stillwater | 1.79% | 0.35%(+1.44)#19 | 0.29%(+1.51)#845 |
| 20. | Amboy | 1.79% | 0.35%(+1.44)#20 | 0.29%(+1.50)#853 |
| 21. | Blaine | 1.71% | 0.35%(+1.35)#21 | 0.29%(+1.42)#890 |
| 22. | Lake Tapps | 1.63% | 0.35%(+1.28)#22 | 0.29%(+1.35)#923 |
| 23. | Graham | 1.63% | 0.35%(+1.28)#23 | 0.29%(+1.34)#927 |
| 24. | Port Ludlow | 1.61% | 0.35%(+1.26)#24 | 0.29%(+1.33)#932 |
| 25. | Southworth | 1.59% | 0.35%(+1.24)#25 | 0.29%(+1.30)#951 |
| 26. | Summit | 1.58% | 0.35%(+1.23)#26 | 0.29%(+1.29)#965 |
| 27. | Sumner | 1.56% | 0.35%(+1.21)#27 | 0.29%(+1.27)#976 |
| 28. | Black Diamond | 1.49% | 0.35%(+1.14)#28 | 0.29%(+1.20)#1,012 |
| 29. | Buckley | 1.37% | 0.35%(+1.02)#29 | 0.29%(+1.08)#1,092 |
| 30. | Cathlamet | 1.28% | 0.35%(+0.931)#30 | 0.29%(+0.996)#1,167 |
| 31. | Lake Stevens | 1.25% | 0.35%(+0.901)#31 | 0.29%(+0.966)#1,191 |
| 32. | Eastmont | 1.25% | 0.35%(+0.896)#32 | 0.29%(+0.961)#1,194 |
| 33. | Geneva | 1.19% | 0.35%(+0.842)#33 | 0.29%(+0.907)#1,258 |
| 34. | Fern Prairie | 1.13% | 0.35%(+0.780)#34 | 0.29%(+0.845)#1,324 |
| 35. | Brier | 1.12% | 0.35%(+0.766)#35 | 0.29%(+0.831)#1,346 |
| 36. | Midland | 1.11% | 0.35%(+0.762)#36 | 0.29%(+0.826)#1,355 |
| 37. | Canterwood | 1.10% | 0.35%(+0.753)#37 | 0.29%(+0.818)#1,367 |
| 38. | College Place | 1.10% | 0.35%(+0.752)#38 | 0.29%(+0.817)#1,369 |
| 39. | Eatonville | 1.09% | 0.35%(+0.739)#39 | 0.29%(+0.804)#1,387 |
| 40. | Ferndale | 1.07% | 0.35%(+0.720)#40 | 0.29%(+0.785)#1,410 |
| 41. | Darrington | 1.05% | 0.35%(+0.704)#41 | 0.29%(+0.769)#1,430 |
| 42. | Riverbend | 1.03% | 0.35%(+0.678)#42 | 0.29%(+0.743)#1,476 |
| 43. | Lakeland South | 1.02% | 0.35%(+0.673)#43 | 0.29%(+0.738)#1,482 |
| 44. | Key Center | 1.01% | 0.35%(+0.662)#44 | 0.29%(+0.726)#1,492 |
| 45. | Warden | 1.01% | 0.35%(+0.656)#45 | 0.29%(+0.721)#1,499 |
| 46. | Covington | 1.00% | 0.35%(+0.653)#46 | 0.29%(+0.718)#1,505 |
| 47. | Tieton | 0.97% | 0.35%(+0.620)#47 | 0.29%(+0.684)#1,552 |
| 48. | Ridgefield | 0.93% | 0.35%(+0.581)#48 | 0.29%(+0.646)#1,611 |
| 49. | Orchards | 0.90% | 0.35%(+0.550)#49 | 0.29%(+0.614)#1,667 |
| 50. | Medical Lake | 0.88% | 0.35%(+0.525)#50 | 0.29%(+0.590)#1,709 |
| 51. | Summit View | 0.85% | 0.35%(+0.495)#51 | 0.29%(+0.560)#1,765 |
| 52. | Bonney Lake | 0.85% | 0.35%(+0.495)#52 | 0.29%(+0.560)#1,767 |
| 53. | Pullman | 0.83% | 0.35%(+0.481)#53 | 0.29%(+0.546)#1,795 |
| 54. | Lynnwood | 0.82% | 0.35%(+0.472)#54 | 0.29%(+0.537)#1,807 |
| 55. | Country Homes | 0.82% | 0.35%(+0.466)#55 | 0.29%(+0.530)#1,824 |
| 56. | Monroe North | 0.80% | 0.35%(+0.447)#56 | 0.29%(+0.512)#1,860 |
| 57. | Liberty Lake | 0.79% | 0.35%(+0.439)#57 | 0.29%(+0.504)#1,875 |
| 58. | Mirrormont | 0.78% | 0.35%(+0.429)#58 | 0.29%(+0.494)#1,901 |
| 59. | Spanaway | 0.78% | 0.35%(+0.425)#59 | 0.29%(+0.490)#1,912 |
| 60. | Moses Lake North | 0.75% | 0.35%(+0.396)#60 | 0.29%(+0.460)#1,972 |
| 61. | Lacey | 0.74% | 0.35%(+0.389)#61 | 0.29%(+0.454)#1,987 |
| 62. | Port Hadlock Irondale | 0.72% | 0.35%(+0.371)#62 | 0.29%(+0.436)#2,034 |
| 63. | Maple Valley | 0.72% | 0.35%(+0.366)#63 | 0.29%(+0.431)#2,051 |
| 64. | Meadowdale | 0.70% | 0.35%(+0.350)#64 | 0.29%(+0.415)#2,085 |
| 65. | West Richland | 0.67% | 0.35%(+0.320)#65 | 0.29%(+0.385)#2,181 |
| 66. | Neah Bay | 0.65% | 0.35%(+0.297)#66 | 0.29%(+0.362)#2,246 |
| 67. | Napavine | 0.65% | 0.35%(+0.296)#67 | 0.29%(+0.361)#2,248 |
| 68. | Rocky Point | 0.65% | 0.35%(+0.296)#68 | 0.29%(+0.361)#2,249 |
| 69. | Ruston | 0.63% | 0.35%(+0.279)#69 | 0.29%(+0.344)#2,296 |
| 70. | Yarrow Point | 0.63% | 0.35%(+0.274)#70 | 0.29%(+0.339)#2,314 |
| 71. | Olympia | 0.62% | 0.35%(+0.268)#71 | 0.29%(+0.333)#2,329 |
| 72. | Marysville | 0.62% | 0.35%(+0.268)#72 | 0.29%(+0.332)#2,330 |
| 73. | Artondale | 0.61% | 0.35%(+0.255)#73 | 0.29%(+0.320)#2,366 |
| 74. | Wenatchee | 0.60% | 0.35%(+0.246)#74 | 0.29%(+0.311)#2,403 |
| 75. | Walla Walla | 0.59% | 0.35%(+0.240)#75 | 0.29%(+0.305)#2,423 |
| 76. | Granger | 0.58% | 0.35%(+0.228)#76 | 0.29%(+0.292)#2,465 |
| 77. | Allyn | 0.58% | 0.35%(+0.227)#77 | 0.29%(+0.292)#2,467 |
| 78. | Hobart | 0.57% | 0.35%(+0.222)#78 | 0.29%(+0.287)#2,481 |
| 79. | Loon Lake | 0.57% | 0.35%(+0.219)#79 | 0.29%(+0.284)#2,491 |
| 80. | Seabeck | 0.56% | 0.35%(+0.206)#80 | 0.29%(+0.271)#2,530 |
| 81. | Boulevard Park | 0.54% | 0.35%(+0.193)#81 | 0.29%(+0.258)#2,574 |
| 82. | Duvall | 0.54% | 0.35%(+0.191)#82 | 0.29%(+0.256)#2,586 |
| 83. | Ahtanum | 0.54% | 0.35%(+0.186)#83 | 0.29%(+0.251)#2,600 |
| 84. | Renton | 0.54% | 0.35%(+0.186)#84 | 0.29%(+0.250)#2,601 |
| 85. | Pasco | 0.53% | 0.35%(+0.182)#85 | 0.29%(+0.247)#2,614 |
| 86. | Barberton | 0.52% | 0.35%(+0.165)#86 | 0.29%(+0.230)#2,691 |
| 87. | Union Gap | 0.51% | 0.35%(+0.156)#87 | 0.29%(+0.221)#2,716 |
| 88. | Tumwater | 0.50% | 0.35%(+0.153)#88 | 0.29%(+0.218)#2,731 |
| 89. | Arlington | 0.50% | 0.35%(+0.153)#89 | 0.29%(+0.218)#2,733 |
| 90. | Belfair | 0.50% | 0.35%(+0.152)#90 | 0.29%(+0.217)#2,735 |
| 91. | Bunk Foss | 0.49% | 0.35%(+0.144)#91 | 0.29%(+0.209)#2,774 |
| 92. | Poulsbo | 0.49% | 0.35%(+0.140)#92 | 0.29%(+0.205)#2,798 |
| 93. | Bangor Base | 0.48% | 0.35%(+0.129)#93 | 0.29%(+0.194)#2,838 |
| 94. | Tacoma | 0.48% | 0.35%(+0.127)#94 | 0.29%(+0.192)#2,850 |
| 95. | Stanwood | 0.47% | 0.35%(+0.121)#95 | 0.29%(+0.186)#2,882 |
| 96. | Harrah | 0.47% | 0.35%(+0.118)#96 | 0.29%(+0.183)#2,896 |
| 97. | Skokomish | 0.47% | 0.35%(+0.115)#97 | 0.29%(+0.180)#2,914 |
| 98. | Shoreline | 0.47% | 0.35%(+0.115)#98 | 0.29%(+0.180)#2,917 |
| 99. | Cashmere | 0.46% | 0.35%(+0.112)#99 | 0.29%(+0.177)#2,935 |
| 100. | Issaquah | 0.46% | 0.35%(+0.106)#100 | 0.29%(+0.171)#2,960 |
Common Questions
What are the Top 10 Cities with the Highest Percentage of Spaniard Population in Washington?
Top 10 Cities with the Highest Percentage of Spaniard Population in Washington are:
#1
32.97%
#2
10.45%
#3
8.09%
#4
7.36%
#5
4.65%
#6
4.47%
#7
4.15%
#8
4.02%
#9
2.75%
#10
2.72%
What city has the Highest Percentage of Spaniard Population in Washington?
Cusick has the Highest Percentage of Spaniard Population in Washington with 32.97%.
What is the Percentage of Spaniard Population in the State of Washington?
Percentage of Spaniard Population in Washington is 0.35%.
What is the Percentage of Spaniard Population in the United States?
Percentage of Spaniard Population in the United States is 0.29%.