Cities with the Highest Percentage of Immigrants from Chile in Washington
RELATED REPORTS & OPTIONS
Chile
Washington
Compare Cities
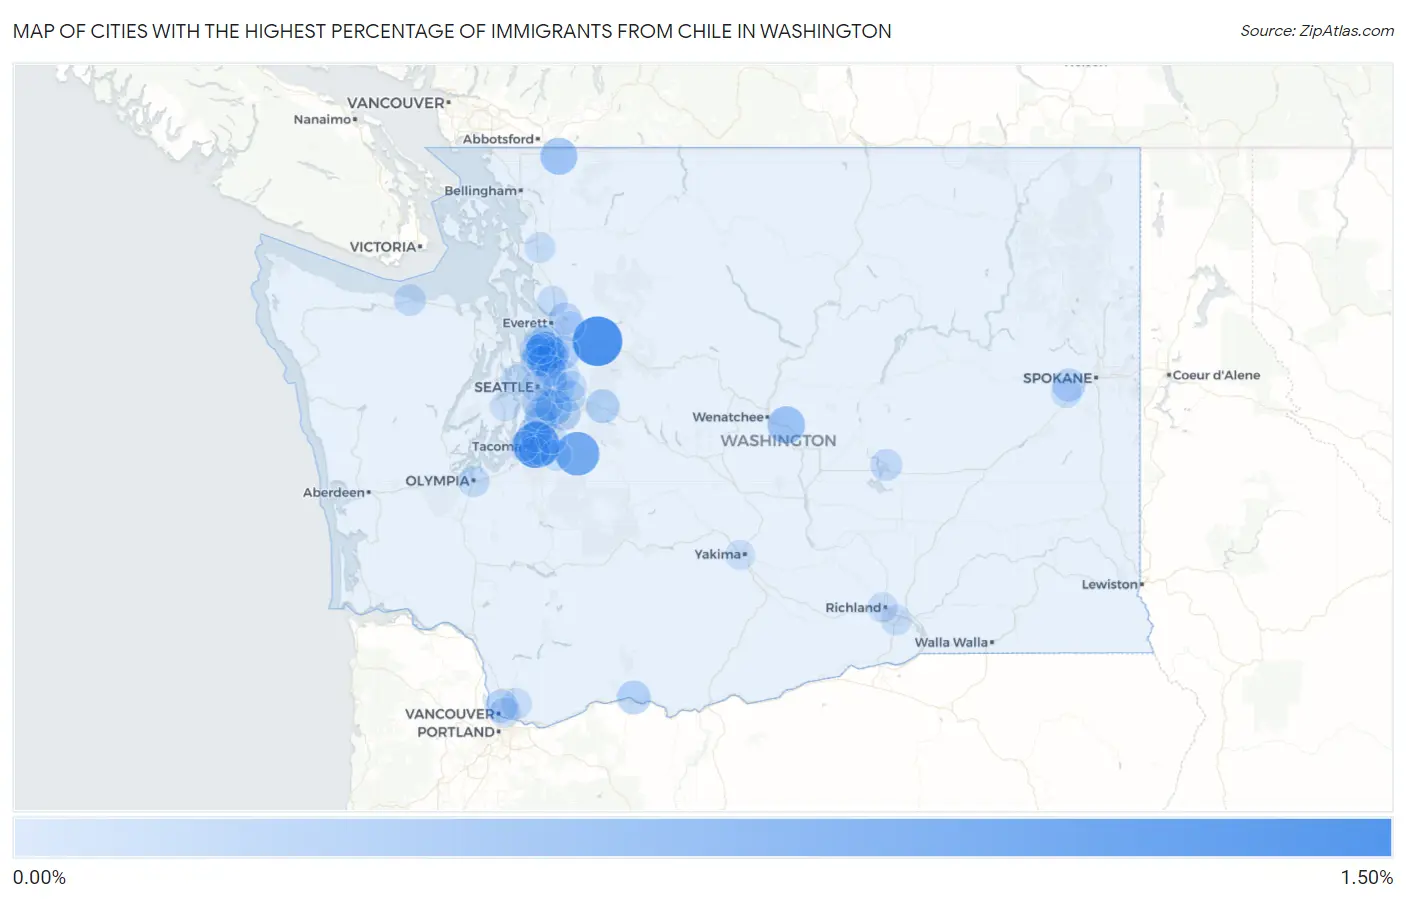
Map of Cities with the Highest Percentage of Immigrants from Chile in Washington
0.00%
1.50%
Cities with the Highest Percentage of Immigrants from Chile in Washington
| City | Chile | vs State | vs National | |
| 1. | Sultan | 1.08% | 0.029%(+1.05)#-1 | 0.032%(+1.05)#0 |
| 2. | Fife Heights | 0.89% | 0.029%(+0.861)#0 | 0.032%(+0.858)#1 |
| 3. | Enumclaw | 0.74% | 0.029%(+0.715)#1 | 0.032%(+0.712)#2 |
| 4. | Alderwood Manor | 0.51% | 0.029%(+0.484)#2 | 0.032%(+0.481)#3 |
| 5. | Roche Harbor | 0.40% | 0.029%(+0.370)#3 | 0.032%(+0.366)#4 |
| 6. | Rock Island | 0.40% | 0.029%(+0.368)#4 | 0.032%(+0.365)#227 |
| 7. | Peaceful Valley | 0.37% | 0.029%(+0.339)#5 | 0.032%(+0.336)#228 |
| 8. | Renton | 0.31% | 0.029%(+0.285)#48 | 0.032%(+0.282)#2,298 |
| 9. | Kenmore | 0.26% | 0.029%(+0.234)#104 | 0.032%(+0.230)#4,363 |
| 10. | Mountlake Terrace | 0.25% | 0.029%(+0.219)#105 | 0.032%(+0.216)#4,364 |
| 11. | Maltby | 0.22% | 0.029%(+0.191)#106 | 0.032%(+0.188)#4,365 |
| 12. | White Salmon | 0.20% | 0.029%(+0.171)#107 | 0.032%(+0.167)#4,366 |
| 13. | North Bend | 0.20% | 0.029%(+0.170)#108 | 0.032%(+0.167)#4,367 |
| 14. | Des Moines | 0.18% | 0.029%(+0.155)#109 | 0.032%(+0.151)#4,368 |
| 15. | Maple Heights Lake Desire | 0.17% | 0.029%(+0.146)#110 | 0.032%(+0.142)#4,369 |
| 16. | Hazel Dell | 0.16% | 0.029%(+0.134)#111 | 0.032%(+0.131)#4,370 |
| 17. | Fairchild Afb | 0.16% | 0.029%(+0.128)#112 | 0.032%(+0.125)#4,371 |
| 18. | Yarrow Point | 0.16% | 0.029%(+0.127)#113 | 0.032%(+0.124)#4,372 |
| 19. | Bothell | 0.13% | 0.029%(+0.101)#114 | 0.032%(+0.097)#4,373 |
| 20. | Fife | 0.13% | 0.029%(+0.100)#115 | 0.032%(+0.096)#4,374 |
| 21. | Lake Stevens | 0.12% | 0.029%(+0.092)#116 | 0.032%(+0.089)#4,375 |
| 22. | Seatac | 0.12% | 0.029%(+0.088)#117 | 0.032%(+0.084)#4,376 |
| 23. | Lake Stickney | 0.11% | 0.029%(+0.080)#118 | 0.032%(+0.077)#4,377 |
| 24. | Bryn Mawr Skyway | 0.11% | 0.029%(+0.076)#119 | 0.032%(+0.073)#4,378 |
| 25. | Edgewood | 0.097% | 0.029%(+0.068)#120 | 0.032%(+0.065)#4,379 |
| 26. | Bothell East | 0.093% | 0.029%(+0.064)#121 | 0.032%(+0.061)#4,380 |
| 27. | Shoreline | 0.089% | 0.029%(+0.060)#122 | 0.032%(+0.056)#4,381 |
| 28. | Port Angeles | 0.085% | 0.029%(+0.056)#123 | 0.032%(+0.053)#4,382 |
| 29. | Moses Lake | 0.083% | 0.029%(+0.055)#124 | 0.032%(+0.051)#4,383 |
| 30. | Federal Way | 0.083% | 0.029%(+0.054)#125 | 0.032%(+0.051)#4,384 |
| 31. | Olympia | 0.074% | 0.029%(+0.045)#126 | 0.032%(+0.042)#4,385 |
| 32. | Bellevue | 0.073% | 0.029%(+0.044)#127 | 0.032%(+0.041)#4,386 |
| 33. | Edmonds | 0.073% | 0.029%(+0.044)#128 | 0.032%(+0.040)#4,387 |
| 34. | Picnic Point | 0.070% | 0.029%(+0.041)#129 | 0.032%(+0.038)#4,388 |
| 35. | Waller | 0.063% | 0.029%(+0.034)#130 | 0.032%(+0.030)#4,389 |
| 36. | Lake Forest Park | 0.059% | 0.029%(+0.031)#131 | 0.032%(+0.027)#4,390 |
| 37. | Bonney Lake | 0.058% | 0.029%(+0.029)#132 | 0.032%(+0.025)#4,391 |
| 38. | Issaquah | 0.056% | 0.029%(+0.027)#133 | 0.032%(+0.024)#4,392 |
| 39. | Bainbridge Island | 0.053% | 0.029%(+0.024)#134 | 0.032%(+0.020)#4,393 |
| 40. | Vancouver | 0.045% | 0.029%(+0.016)#135 | 0.032%(+0.012)#4,394 |
| 41. | Orchards | 0.044% | 0.029%(+0.016)#136 | 0.032%(+0.012)#4,395 |
| 42. | Kennewick | 0.043% | 0.029%(+0.014)#137 | 0.032%(+0.011)#4,396 |
| 43. | Mount Vernon | 0.043% | 0.029%(+0.014)#138 | 0.032%(+0.011)#4,397 |
| 44. | Medical Lake | 0.041% | 0.029%(+0.012)#139 | 0.032%(+0.009)#4,398 |
| 45. | Redmond | 0.039% | 0.029%(+0.010)#140 | 0.032%(+0.007)#4,399 |
| 46. | Kirkland | 0.037% | 0.029%(+0.008)#141 | 0.032%(+0.005)#4,400 |
| 47. | Marysville | 0.037% | 0.029%(+0.008)#142 | 0.032%(+0.005)#4,401 |
| 48. | Seattle | 0.033% | 0.029%(+0.004)#143 | 0.032%(+0.000)#4,402 |
| 49. | Sammamish | 0.032% | 0.029%(+0.003)#144 | 0.032%(-0.001)#4,403 |
| 50. | Auburn | 0.028% | 0.029%(-0.001)#145 | 0.032%(-0.004)#4,404 |
| 51. | Richland | 0.026% | 0.029%(-0.003)#146 | 0.032%(-0.006)#4,405 |
| 52. | Bethel | 0.024% | 0.029%(-0.005)#147 | 0.032%(-0.008)#4,406 |
| 53. | Lynnwood | 0.020% | 0.029%(-0.009)#148 | 0.032%(-0.012)#4,407 |
| 54. | White Center | 0.013% | 0.029%(-0.016)#149 | 0.032%(-0.019)#4,408 |
| 55. | Everett | 0.012% | 0.029%(-0.017)#150 | 0.032%(-0.020)#4,409 |
| 56. | Tacoma | 0.010% | 0.029%(-0.018)#151 | 0.032%(-0.022)#4,410 |
| 57. | Yakima | 0.0062% | 0.029%(-0.023)#152 | 0.032%(-0.026)#4,411 |
Common Questions
What are the Top 10 Cities with the Highest Percentage of Immigrants from Chile in Washington?
Top 10 Cities with the Highest Percentage of Immigrants from Chile in Washington are:
#1
1.08%
#2
0.89%
#3
0.74%
#4
0.51%
#5
0.40%
#6
0.37%
#7
0.31%
#8
0.26%
#9
0.25%
#10
0.22%
What city has the Highest Percentage of Immigrants from Chile in Washington?
Sultan has the Highest Percentage of Immigrants from Chile in Washington with 1.08%.
What is the Percentage of Immigrants from Chile in the State of Washington?
Percentage of Immigrants from Chile in Washington is 0.029%.
What is the Percentage of Immigrants from Chile in the United States?
Percentage of Immigrants from Chile in the United States is 0.032%.