Cities with the Highest Percentage of Immigrants from Russia in Washington
RELATED REPORTS & OPTIONS
Russia
Washington
Compare Cities
Map of Cities with the Highest Percentage of Immigrants from Russia in Washington
0.00%
15.00%
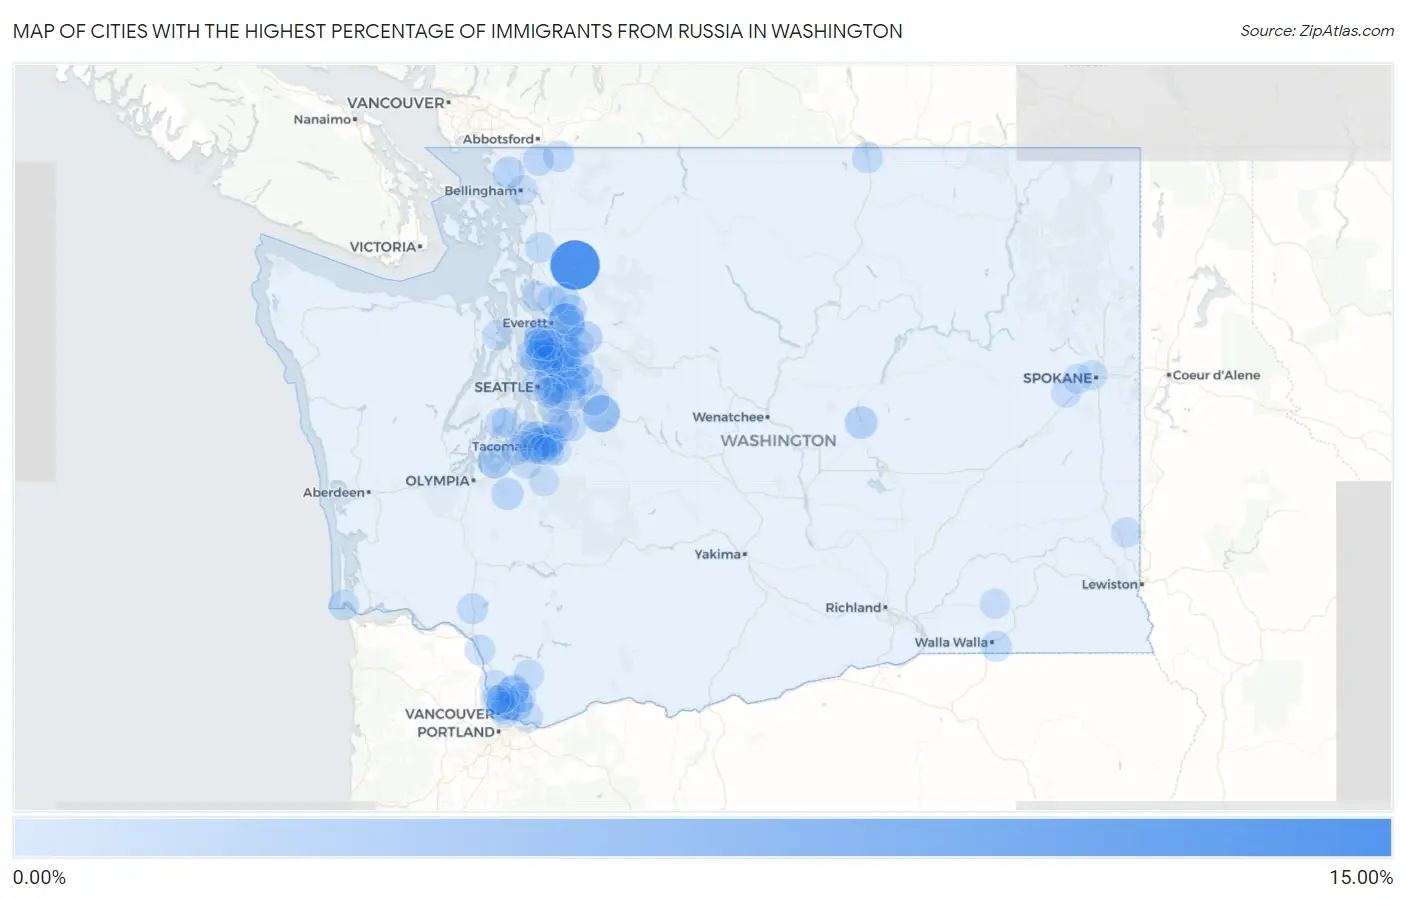
Cities with the Highest Percentage of Immigrants from Russia in Washington
| City | Russia | vs State | vs National | |
| 1. | Lake Cavanaugh | 11.73% | 0.28%(+11.5)#1 | 0.12%(+11.6)#8 |
| 2. | Wilderness Rim | 4.22% | 0.28%(+3.94)#2 | 0.12%(+4.10)#27 |
| 3. | Cavalero | 3.91% | 0.28%(+3.63)#3 | 0.12%(+3.79)#36 |
| 4. | Anderson Island | 2.78% | 0.28%(+2.50)#4 | 0.12%(+2.65)#64 |
| 5. | Maltby | 2.59% | 0.28%(+2.31)#5 | 0.12%(+2.47)#72 |
| 6. | Fife Heights | 2.48% | 0.28%(+2.20)#6 | 0.12%(+2.36)#79 |
| 7. | Orchards | 2.34% | 0.28%(+2.06)#7 | 0.12%(+2.22)#90 |
| 8. | Algona | 1.81% | 0.28%(+1.53)#8 | 0.12%(+1.68)#138 |
| 9. | Soap Lake | 1.67% | 0.28%(+1.39)#9 | 0.12%(+1.55)#159 |
| 10. | Issaquah | 1.66% | 0.28%(+1.38)#10 | 0.12%(+1.54)#161 |
| 11. | Meadow Glade | 1.59% | 0.28%(+1.31)#11 | 0.12%(+1.47)#175 |
| 12. | Clyde Hill | 1.51% | 0.28%(+1.23)#12 | 0.12%(+1.39)#188 |
| 13. | Woods Creek | 1.48% | 0.28%(+1.20)#13 | 0.12%(+1.35)#198 |
| 14. | Picnic Point | 1.42% | 0.28%(+1.14)#14 | 0.12%(+1.29)#211 |
| 15. | North Yelm | 1.36% | 0.28%(+1.08)#15 | 0.12%(+1.24)#231 |
| 16. | Woodinville | 1.28% | 0.28%(+0.998)#16 | 0.12%(+1.16)#267 |
| 17. | Ferndale | 1.26% | 0.28%(+0.976)#17 | 0.12%(+1.13)#276 |
| 18. | Lake Stickney | 1.12% | 0.28%(+0.838)#18 | 0.12%(+0.995)#315 |
| 19. | Redmond | 1.02% | 0.28%(+0.740)#19 | 0.12%(+0.897)#358 |
| 20. | Snoqualmie | 1.01% | 0.28%(+0.730)#20 | 0.12%(+0.887)#361 |
| 21. | Cathcart | 0.95% | 0.28%(+0.670)#21 | 0.12%(+0.827)#392 |
| 22. | Mukilteo | 0.92% | 0.28%(+0.642)#22 | 0.12%(+0.799)#405 |
| 23. | Peaceful Valley | 0.92% | 0.28%(+0.641)#23 | 0.12%(+0.798)#407 |
| 24. | Sisco Heights | 0.91% | 0.28%(+0.628)#24 | 0.12%(+0.786)#416 |
| 25. | Pacific | 0.90% | 0.28%(+0.622)#25 | 0.12%(+0.779)#419 |
| 26. | Nooksack | 0.90% | 0.28%(+0.615)#26 | 0.12%(+0.772)#422 |
| 27. | Union Hill Novelty Hill | 0.87% | 0.28%(+0.592)#27 | 0.12%(+0.749)#437 |
| 28. | Lakeland South | 0.86% | 0.28%(+0.577)#28 | 0.12%(+0.734)#446 |
| 29. | Oroville | 0.86% | 0.28%(+0.576)#29 | 0.12%(+0.733)#447 |
| 30. | Battle Ground | 0.84% | 0.28%(+0.558)#30 | 0.12%(+0.715)#458 |
| 31. | Carnation | 0.80% | 0.28%(+0.515)#31 | 0.12%(+0.672)#495 |
| 32. | Bellevue | 0.78% | 0.28%(+0.505)#32 | 0.12%(+0.662)#502 |
| 33. | Walla Walla East | 0.77% | 0.28%(+0.487)#33 | 0.12%(+0.644)#511 |
| 34. | Brier | 0.76% | 0.28%(+0.484)#34 | 0.12%(+0.642)#513 |
| 35. | Shoreline | 0.72% | 0.28%(+0.444)#35 | 0.12%(+0.602)#547 |
| 36. | Bothell West | 0.72% | 0.28%(+0.441)#36 | 0.12%(+0.598)#553 |
| 37. | Castle Rock | 0.69% | 0.28%(+0.406)#37 | 0.12%(+0.563)#592 |
| 38. | Everett | 0.68% | 0.28%(+0.404)#38 | 0.12%(+0.561)#596 |
| 39. | Lochsloy | 0.67% | 0.28%(+0.392)#39 | 0.12%(+0.549)#608 |
| 40. | Vancouver | 0.67% | 0.28%(+0.389)#40 | 0.12%(+0.546)#612 |
| 41. | Bothell | 0.66% | 0.28%(+0.379)#41 | 0.12%(+0.537)#624 |
| 42. | Minnehaha | 0.66% | 0.28%(+0.376)#42 | 0.12%(+0.533)#627 |
| 43. | Yacolt | 0.64% | 0.28%(+0.360)#43 | 0.12%(+0.517)#641 |
| 44. | Duvall | 0.64% | 0.28%(+0.360)#44 | 0.12%(+0.517)#642 |
| 45. | Ames Lake | 0.63% | 0.28%(+0.352)#45 | 0.12%(+0.509)#658 |
| 46. | Ilwaco | 0.63% | 0.28%(+0.348)#46 | 0.12%(+0.505)#662 |
| 47. | Kirkland | 0.61% | 0.28%(+0.332)#47 | 0.12%(+0.489)#684 |
| 48. | Bothell East | 0.61% | 0.28%(+0.329)#48 | 0.12%(+0.487)#687 |
| 49. | Mount Vernon | 0.61% | 0.28%(+0.329)#49 | 0.12%(+0.486)#688 |
| 50. | Kalama | 0.58% | 0.28%(+0.296)#50 | 0.12%(+0.453)#736 |
| 51. | Wauna | 0.58% | 0.28%(+0.296)#51 | 0.12%(+0.453)#737 |
| 52. | Marysville | 0.55% | 0.28%(+0.273)#52 | 0.12%(+0.430)#772 |
| 53. | Lynnwood | 0.54% | 0.28%(+0.262)#53 | 0.12%(+0.419)#788 |
| 54. | Federal Way | 0.54% | 0.28%(+0.259)#54 | 0.12%(+0.416)#793 |
| 55. | Renton | 0.54% | 0.28%(+0.258)#55 | 0.12%(+0.415)#794 |
| 56. | Woodway | 0.54% | 0.28%(+0.257)#56 | 0.12%(+0.414)#797 |
| 57. | Lake Stevens | 0.53% | 0.28%(+0.251)#57 | 0.12%(+0.408)#809 |
| 58. | Auburn | 0.51% | 0.28%(+0.228)#58 | 0.12%(+0.385)#836 |
| 59. | Five Corners | 0.51% | 0.28%(+0.227)#59 | 0.12%(+0.384)#841 |
| 60. | Cottage Lake | 0.50% | 0.28%(+0.219)#60 | 0.12%(+0.376)#852 |
| 61. | Hazel Dell | 0.49% | 0.28%(+0.213)#61 | 0.12%(+0.370)#865 |
| 62. | Sammamish | 0.49% | 0.28%(+0.211)#62 | 0.12%(+0.368)#871 |
| 63. | Kayak Point | 0.48% | 0.28%(+0.201)#63 | 0.12%(+0.359)#886 |
| 64. | Ridgefield | 0.47% | 0.28%(+0.190)#64 | 0.12%(+0.347)#913 |
| 65. | Maple Valley | 0.44% | 0.28%(+0.161)#65 | 0.12%(+0.318)#956 |
| 66. | Camas | 0.44% | 0.28%(+0.156)#66 | 0.12%(+0.313)#967 |
| 67. | Dash Point | 0.43% | 0.28%(+0.153)#67 | 0.12%(+0.311)#976 |
| 68. | Port Ludlow | 0.42% | 0.28%(+0.140)#68 | 0.12%(+0.297)#1,006 |
| 69. | High Bridge | 0.42% | 0.28%(+0.138)#69 | 0.12%(+0.295)#1,016 |
| 70. | Hockinson | 0.41% | 0.28%(+0.131)#70 | 0.12%(+0.289)#1,027 |
| 71. | Lake Tapps | 0.41% | 0.28%(+0.130)#71 | 0.12%(+0.287)#1,033 |
| 72. | Monroe | 0.41% | 0.28%(+0.127)#72 | 0.12%(+0.285)#1,039 |
| 73. | Mountlake Terrace | 0.40% | 0.28%(+0.123)#73 | 0.12%(+0.280)#1,053 |
| 74. | Covington | 0.40% | 0.28%(+0.119)#74 | 0.12%(+0.276)#1,067 |
| 75. | Beaux Arts Village | 0.39% | 0.28%(+0.107)#75 | 0.12%(+0.265)#1,098 |
| 76. | North Lynnwood | 0.38% | 0.28%(+0.104)#76 | 0.12%(+0.261)#1,108 |
| 77. | Kenmore | 0.38% | 0.28%(+0.097)#77 | 0.12%(+0.254)#1,124 |
| 78. | Martha Lake | 0.37% | 0.28%(+0.094)#78 | 0.12%(+0.251)#1,130 |
| 79. | Tacoma | 0.37% | 0.28%(+0.090)#79 | 0.12%(+0.247)#1,138 |
| 80. | Fife | 0.37% | 0.28%(+0.087)#80 | 0.12%(+0.245)#1,147 |
| 81. | Meadowdale | 0.37% | 0.28%(+0.087)#81 | 0.12%(+0.244)#1,148 |
| 82. | Fircrest | 0.35% | 0.28%(+0.072)#82 | 0.12%(+0.229)#1,187 |
| 83. | Purdy | 0.35% | 0.28%(+0.071)#83 | 0.12%(+0.229)#1,189 |
| 84. | Mount Vista | 0.35% | 0.28%(+0.066)#84 | 0.12%(+0.223)#1,205 |
| 85. | Mercer Island | 0.35% | 0.28%(+0.065)#85 | 0.12%(+0.223)#1,208 |
| 86. | Graham | 0.34% | 0.28%(+0.062)#86 | 0.12%(+0.219)#1,214 |
| 87. | Sumner | 0.34% | 0.28%(+0.060)#87 | 0.12%(+0.217)#1,222 |
| 88. | Prescott | 0.33% | 0.28%(+0.050)#88 | 0.12%(+0.207)#1,255 |
| 89. | Salmon Creek | 0.32% | 0.28%(+0.040)#89 | 0.12%(+0.197)#1,289 |
| 90. | Pullman | 0.31% | 0.28%(+0.033)#90 | 0.12%(+0.190)#1,311 |
| 91. | Newcastle | 0.31% | 0.28%(+0.029)#91 | 0.12%(+0.186)#1,321 |
| 92. | Parkland | 0.31% | 0.28%(+0.027)#92 | 0.12%(+0.184)#1,334 |
| 93. | Medical Lake | 0.31% | 0.28%(+0.025)#93 | 0.12%(+0.183)#1,341 |
| 94. | Kent | 0.29% | 0.28%(+0.006)#94 | 0.12%(+0.163)#1,411 |
| 95. | Felida | 0.27% | 0.28%(-0.014)#95 | 0.12%(+0.143)#1,483 |
| 96. | Seattle | 0.26% | 0.28%(-0.020)#96 | 0.12%(+0.137)#1,509 |
| 97. | Spokane | 0.26% | 0.28%(-0.021)#97 | 0.12%(+0.136)#1,512 |
| 98. | Edgewood | 0.26% | 0.28%(-0.022)#98 | 0.12%(+0.135)#1,516 |
| 99. | Bellingham | 0.24% | 0.28%(-0.043)#99 | 0.12%(+0.115)#1,616 |
| 100. | Airway Heights | 0.24% | 0.28%(-0.044)#100 | 0.12%(+0.114)#1,619 |
Common Questions
What are the Top 10 Cities with the Highest Percentage of Immigrants from Russia in Washington?
Top 10 Cities with the Highest Percentage of Immigrants from Russia in Washington are:
#1
11.73%
#2
4.22%
#3
3.91%
#4
2.78%
#5
2.59%
#6
2.48%
#7
2.34%
#8
1.81%
#9
1.67%
#10
1.66%
What city has the Highest Percentage of Immigrants from Russia in Washington?
Lake Cavanaugh has the Highest Percentage of Immigrants from Russia in Washington with 11.73%.
What is the Percentage of Immigrants from Russia in the State of Washington?
Percentage of Immigrants from Russia in Washington is 0.28%.
What is the Percentage of Immigrants from Russia in the United States?
Percentage of Immigrants from Russia in the United States is 0.12%.