Cities with the Highest Percentage of Immigrants from Eastern Asia in Washington
RELATED REPORTS & OPTIONS
Eastern Asia
Washington
Compare Cities
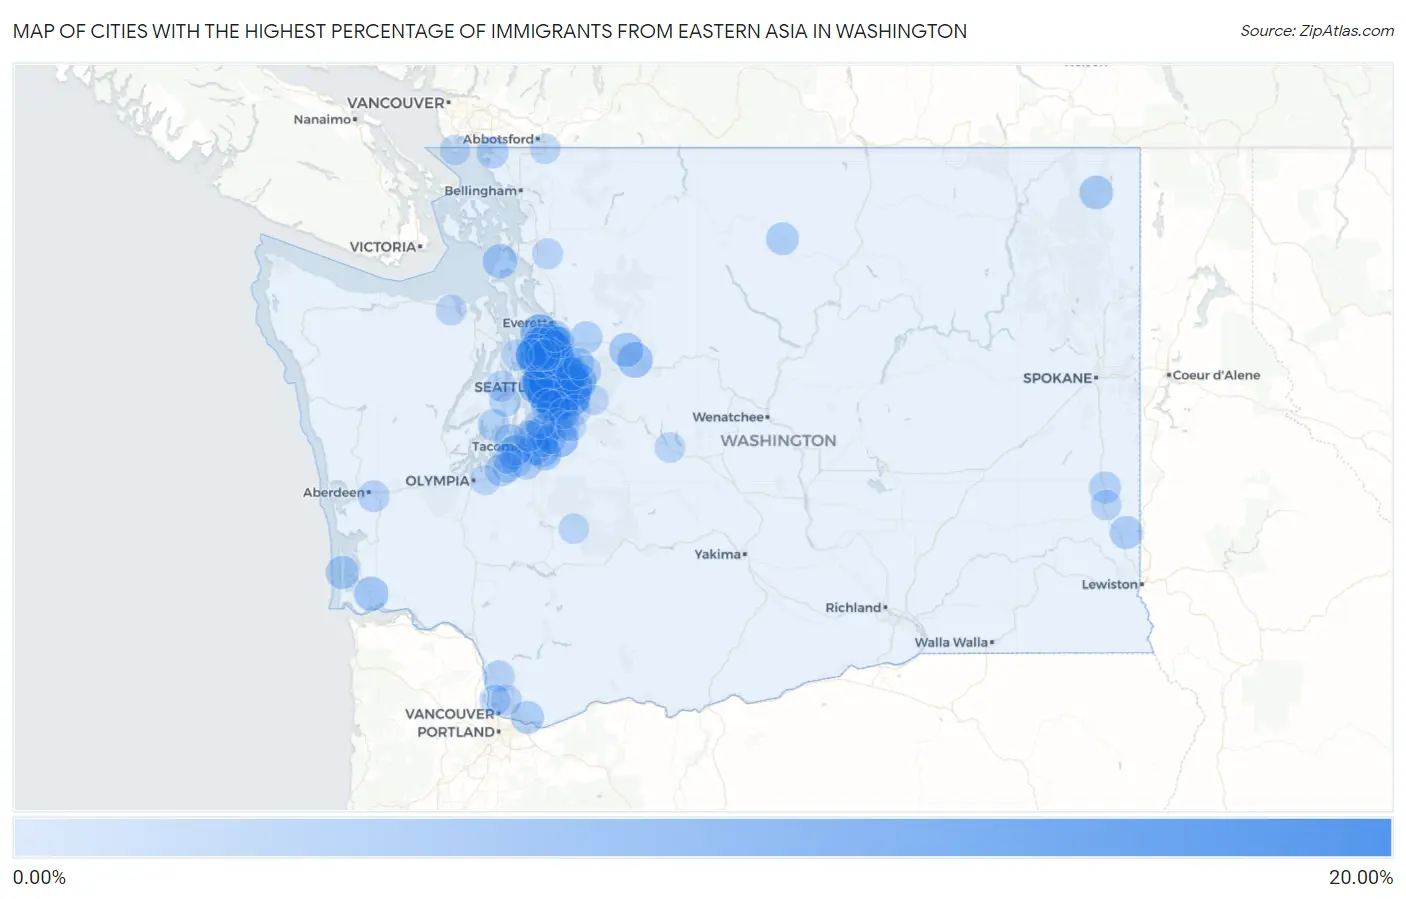
Map of Cities with the Highest Percentage of Immigrants from Eastern Asia in Washington
0.00%
20.00%
Cities with the Highest Percentage of Immigrants from Eastern Asia in Washington
| City | Eastern Asia | vs State | vs National | |
| 1. | Medina | 15.70% | 2.31%(+13.4)#1 | 1.28%(+14.4)#70 |
| 2. | Yarrow Point | 15.31% | 2.31%(+13.0)#2 | 1.28%(+14.0)#72 |
| 3. | Bellevue | 13.96% | 2.31%(+11.7)#3 | 1.28%(+12.7)#82 |
| 4. | Newcastle | 11.80% | 2.31%(+9.49)#4 | 1.28%(+10.5)#117 |
| 5. | Mercer Island | 11.09% | 2.31%(+8.78)#5 | 1.28%(+9.82)#139 |
| 6. | Clyde Hill | 10.71% | 2.31%(+8.40)#6 | 1.28%(+9.44)#147 |
| 7. | Larch Way | 10.48% | 2.31%(+8.17)#7 | 1.28%(+9.20)#152 |
| 8. | Redmond | 10.38% | 2.31%(+8.07)#8 | 1.28%(+9.10)#153 |
| 9. | Sammamish | 10.25% | 2.31%(+7.94)#9 | 1.28%(+8.98)#157 |
| 10. | Hunts Point | 10.22% | 2.31%(+7.91)#10 | 1.28%(+8.94)#159 |
| 11. | Issaquah | 9.38% | 2.31%(+7.07)#11 | 1.28%(+8.11)#180 |
| 12. | Esperance | 8.48% | 2.31%(+6.17)#12 | 1.28%(+7.21)#223 |
| 13. | Bothell East | 8.03% | 2.31%(+5.72)#13 | 1.28%(+6.75)#247 |
| 14. | Mukilteo | 7.95% | 2.31%(+5.64)#14 | 1.28%(+6.67)#250 |
| 15. | Mill Creek | 7.20% | 2.31%(+4.89)#15 | 1.28%(+5.93)#280 |
| 16. | Lake Holm | 6.24% | 2.31%(+3.93)#16 | 1.28%(+4.97)#353 |
| 17. | Kenmore | 6.08% | 2.31%(+3.77)#17 | 1.28%(+4.80)#366 |
| 18. | Lake Stickney | 5.87% | 2.31%(+3.56)#18 | 1.28%(+4.59)#388 |
| 19. | Kirkland | 5.65% | 2.31%(+3.34)#19 | 1.28%(+4.37)#416 |
| 20. | Ames Lake | 5.51% | 2.31%(+3.19)#20 | 1.28%(+4.23)#430 |
| 21. | North Lynnwood | 5.45% | 2.31%(+3.14)#21 | 1.28%(+4.17)#436 |
| 22. | Baring | 5.34% | 2.31%(+3.03)#22 | 1.28%(+4.06)#449 |
| 23. | Lynnwood | 5.24% | 2.31%(+2.93)#23 | 1.28%(+3.96)#461 |
| 24. | Seattle | 5.23% | 2.31%(+2.92)#24 | 1.28%(+3.96)#462 |
| 25. | Shoreline | 5.23% | 2.31%(+2.92)#25 | 1.28%(+3.96)#463 |
| 26. | Martha Lake | 5.03% | 2.31%(+2.72)#26 | 1.28%(+3.75)#487 |
| 27. | Mill Creek East | 4.96% | 2.31%(+2.65)#27 | 1.28%(+3.68)#495 |
| 28. | Woodinville | 4.87% | 2.31%(+2.56)#28 | 1.28%(+3.60)#510 |
| 29. | Bothell | 4.79% | 2.31%(+2.48)#29 | 1.28%(+3.51)#523 |
| 30. | Renton | 4.71% | 2.31%(+2.40)#30 | 1.28%(+3.44)#535 |
| 31. | Whidbey Island Station | 4.67% | 2.31%(+2.36)#31 | 1.28%(+3.40)#541 |
| 32. | Naselle | 4.61% | 2.31%(+2.30)#32 | 1.28%(+3.33)#552 |
| 33. | Index | 4.55% | 2.31%(+2.23)#33 | 1.28%(+3.27)#567 |
| 34. | Lakeland North | 4.43% | 2.31%(+2.12)#34 | 1.28%(+3.16)#583 |
| 35. | Federal Way | 4.39% | 2.31%(+2.08)#35 | 1.28%(+3.11)#592 |
| 36. | Edgewood | 4.33% | 2.31%(+2.02)#36 | 1.28%(+3.06)#602 |
| 37. | Lake Forest Park | 4.26% | 2.31%(+1.95)#37 | 1.28%(+2.98)#619 |
| 38. | Ione | 4.09% | 2.31%(+1.78)#38 | 1.28%(+2.82)#650 |
| 39. | Cottage Lake | 3.97% | 2.31%(+1.66)#39 | 1.28%(+2.69)#669 |
| 40. | Ocean Park | 3.93% | 2.31%(+1.62)#40 | 1.28%(+2.66)#679 |
| 41. | Fairwood Cdp King County | 3.90% | 2.31%(+1.59)#41 | 1.28%(+2.63)#684 |
| 42. | North Puyallup | 3.82% | 2.31%(+1.51)#42 | 1.28%(+2.55)#700 |
| 43. | Union Hill Novelty Hill | 3.81% | 2.31%(+1.50)#43 | 1.28%(+2.53)#708 |
| 44. | Picnic Point | 3.73% | 2.31%(+1.42)#44 | 1.28%(+2.45)#730 |
| 45. | Pullman | 3.73% | 2.31%(+1.41)#45 | 1.28%(+2.45)#732 |
| 46. | Fife | 3.71% | 2.31%(+1.40)#46 | 1.28%(+2.44)#736 |
| 47. | University Place | 3.71% | 2.31%(+1.40)#47 | 1.28%(+2.43)#737 |
| 48. | Alderwood Manor | 3.68% | 2.31%(+1.37)#48 | 1.28%(+2.40)#750 |
| 49. | Camas | 3.65% | 2.31%(+1.34)#49 | 1.28%(+2.37)#756 |
| 50. | Meadowdale | 3.47% | 2.31%(+1.16)#50 | 1.28%(+2.20)#806 |
| 51. | Bryn Mawr Skyway | 3.43% | 2.31%(+1.12)#51 | 1.28%(+2.16)#825 |
| 52. | Winthrop | 3.43% | 2.31%(+1.12)#52 | 1.28%(+2.16)#826 |
| 53. | Bothell West | 3.43% | 2.31%(+1.12)#53 | 1.28%(+2.15)#828 |
| 54. | Dupont | 3.34% | 2.31%(+1.02)#54 | 1.28%(+2.06)#852 |
| 55. | Woods Creek | 3.11% | 2.31%(+0.797)#55 | 1.28%(+1.83)#924 |
| 56. | Lake Marcel Stillwater | 3.08% | 2.31%(+0.770)#56 | 1.28%(+1.80)#934 |
| 57. | Edmonds | 3.07% | 2.31%(+0.764)#57 | 1.28%(+1.80)#937 |
| 58. | Steptoe | 3.00% | 2.31%(+0.689)#58 | 1.28%(+1.72)#960 |
| 59. | Lakeland South | 2.97% | 2.31%(+0.664)#59 | 1.28%(+1.70)#969 |
| 60. | Mountlake Terrace | 2.97% | 2.31%(+0.664)#60 | 1.28%(+1.70)#970 |
| 61. | Silver Firs | 2.97% | 2.31%(+0.663)#61 | 1.28%(+1.70)#971 |
| 62. | Blaine | 2.95% | 2.31%(+0.639)#62 | 1.28%(+1.67)#979 |
| 63. | Stansberry Lake | 2.87% | 2.31%(+0.562)#63 | 1.28%(+1.60)#1,016 |
| 64. | Wollochet | 2.78% | 2.31%(+0.466)#64 | 1.28%(+1.50)#1,056 |
| 65. | Woodway | 2.77% | 2.31%(+0.462)#65 | 1.28%(+1.50)#1,057 |
| 66. | Brier | 2.74% | 2.31%(+0.427)#66 | 1.28%(+1.46)#1,070 |
| 67. | Kingston | 2.70% | 2.31%(+0.390)#67 | 1.28%(+1.43)#1,088 |
| 68. | La Center | 2.69% | 2.31%(+0.376)#68 | 1.28%(+1.41)#1,092 |
| 69. | Cosmopolis | 2.66% | 2.31%(+0.350)#69 | 1.28%(+1.39)#1,103 |
| 70. | Lakewood | 2.65% | 2.31%(+0.344)#70 | 1.28%(+1.38)#1,108 |
| 71. | Parkland | 2.65% | 2.31%(+0.339)#71 | 1.28%(+1.37)#1,110 |
| 72. | Eastmont | 2.58% | 2.31%(+0.270)#72 | 1.28%(+1.30)#1,144 |
| 73. | Duvall | 2.56% | 2.31%(+0.248)#73 | 1.28%(+1.28)#1,153 |
| 74. | Fircrest | 2.40% | 2.31%(+0.084)#74 | 1.28%(+1.12)#1,224 |
| 75. | East Port Orchard | 2.38% | 2.31%(+0.071)#75 | 1.28%(+1.11)#1,234 |
| 76. | Mirrormont | 2.32% | 2.31%(+0.005)#76 | 1.28%(+1.04)#1,277 |
| 77. | Barberton | 2.30% | 2.31%(-0.007)#77 | 1.28%(+1.03)#1,284 |
| 78. | Kent | 2.29% | 2.31%(-0.020)#78 | 1.28%(+1.01)#1,295 |
| 79. | Dash Point | 2.28% | 2.31%(-0.035)#79 | 1.28%(+1.000)#1,303 |
| 80. | Tracyton | 2.24% | 2.31%(-0.066)#80 | 1.28%(+0.969)#1,320 |
| 81. | Felida | 2.23% | 2.31%(-0.077)#81 | 1.28%(+0.958)#1,325 |
| 82. | Tehaleh | 2.17% | 2.31%(-0.138)#82 | 1.28%(+0.897)#1,366 |
| 83. | Big Lake | 2.16% | 2.31%(-0.149)#83 | 1.28%(+0.886)#1,375 |
| 84. | Covington | 2.15% | 2.31%(-0.163)#84 | 1.28%(+0.872)#1,384 |
| 85. | Bell Hill | 2.11% | 2.31%(-0.200)#85 | 1.28%(+0.835)#1,412 |
| 86. | Auburn | 2.08% | 2.31%(-0.232)#86 | 1.28%(+0.803)#1,440 |
| 87. | Clear Lake Cdp Pierce County | 2.07% | 2.31%(-0.236)#87 | 1.28%(+0.799)#1,444 |
| 88. | Maple Heights Lake Desire | 2.04% | 2.31%(-0.273)#88 | 1.28%(+0.762)#1,462 |
| 89. | Colfax | 2.00% | 2.31%(-0.310)#89 | 1.28%(+0.725)#1,487 |
| 90. | Erlands Point | 1.99% | 2.31%(-0.318)#90 | 1.28%(+0.717)#1,501 |
| 91. | Sumas | 1.93% | 2.31%(-0.378)#91 | 1.28%(+0.657)#1,555 |
| 92. | Ashford | 1.93% | 2.31%(-0.385)#92 | 1.28%(+0.650)#1,560 |
| 93. | Easton | 1.83% | 2.31%(-0.481)#93 | 1.28%(+0.554)#1,638 |
| 94. | Des Moines | 1.79% | 2.31%(-0.517)#94 | 1.28%(+0.518)#1,676 |
| 95. | Point Roberts | 1.76% | 2.31%(-0.549)#95 | 1.28%(+0.486)#1,703 |
| 96. | North Fort Lewis | 1.73% | 2.31%(-0.584)#96 | 1.28%(+0.451)#1,734 |
| 97. | Lacey | 1.73% | 2.31%(-0.585)#97 | 1.28%(+0.450)#1,737 |
| 98. | Steilacoom | 1.66% | 2.31%(-0.649)#98 | 1.28%(+0.386)#1,820 |
| 99. | Maple Valley | 1.66% | 2.31%(-0.654)#99 | 1.28%(+0.381)#1,827 |
| 100. | Snoqualmie | 1.63% | 2.31%(-0.676)#100 | 1.28%(+0.359)#1,870 |
Common Questions
What are the Top 10 Cities with the Highest Percentage of Immigrants from Eastern Asia in Washington?
Top 10 Cities with the Highest Percentage of Immigrants from Eastern Asia in Washington are:
#1
15.70%
#2
15.31%
#3
13.96%
#4
11.80%
#5
11.09%
#6
10.71%
#7
10.48%
#8
10.38%
#9
10.25%
#10
10.22%
What city has the Highest Percentage of Immigrants from Eastern Asia in Washington?
Medina has the Highest Percentage of Immigrants from Eastern Asia in Washington with 15.70%.
What is the Percentage of Immigrants from Eastern Asia in the State of Washington?
Percentage of Immigrants from Eastern Asia in Washington is 2.31%.
What is the Percentage of Immigrants from Eastern Asia in the United States?
Percentage of Immigrants from Eastern Asia in the United States is 1.28%.