Cities with the Most Immigrants from Trinidad and Tobago in Washington
RELATED REPORTS & OPTIONS
Trinidad and Tobago
Washington
Compare Cities
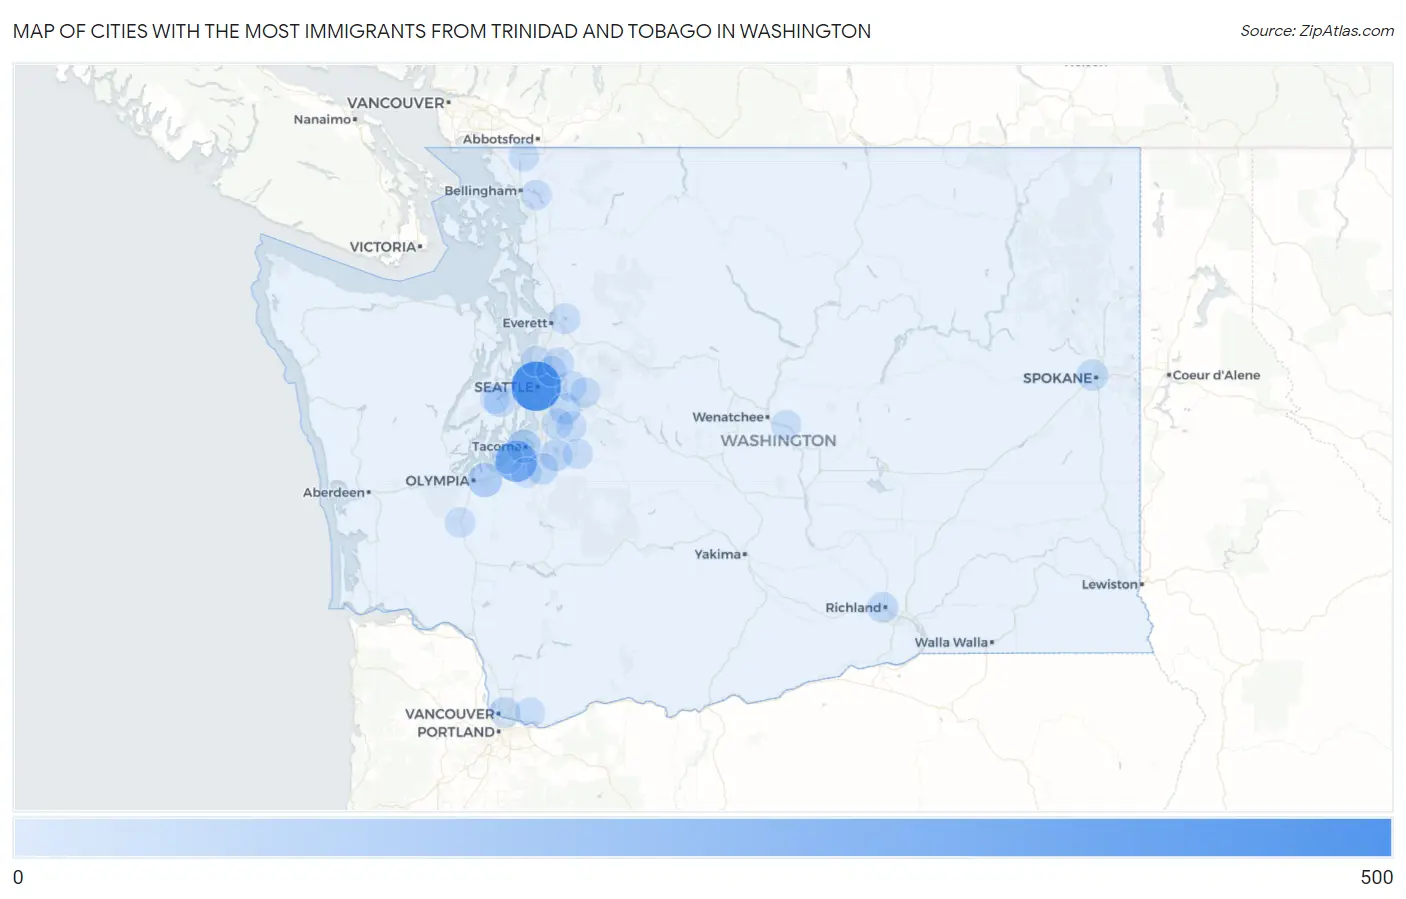
Map of Cities with the Most Immigrants from Trinidad and Tobago in Washington
0
500
Cities with the Most Immigrants from Trinidad and Tobago in Washington
| City | Trinidad and Tobago | vs State | vs National | |
| 1. | Seattle | 456 | 1,351(33.75%)#1 | 231,222(0.20%)#37 |
| 2. | Lakewood | 260 | 1,351(19.25%)#2 | 231,222(0.11%)#84 |
| 3. | Lacey | 94 | 1,351(6.96%)#3 | 231,222(0.04%)#291 |
| 4. | Tacoma | 84 | 1,351(6.22%)#4 | 231,222(0.04%)#332 |
| 5. | Bonney Lake | 46 | 1,351(3.40%)#5 | 231,222(0.02%)#561 |
| 6. | Port Orchard | 39 | 1,351(2.89%)#6 | 231,222(0.02%)#622 |
| 7. | Spokane | 32 | 1,351(2.37%)#7 | 231,222(0.01%)#726 |
| 8. | South Hill | 27 | 1,351(2.00%)#8 | 231,222(0.01%)#812 |
| 9. | East Renton Highlands | 27 | 1,351(2.00%)#9 | 231,222(0.01%)#822 |
| 10. | Vancouver | 24 | 1,351(1.78%)#10 | 231,222(0.01%)#874 |
| 11. | Kent | 23 | 1,351(1.70%)#11 | 231,222(0.01%)#894 |
| 12. | Richland | 21 | 1,351(1.55%)#12 | 231,222(0.01%)#948 |
| 13. | Sammamish | 20 | 1,351(1.48%)#13 | 231,222(0.01%)#969 |
| 14. | Shoreline | 17 | 1,351(1.26%)#14 | 231,222(0.01%)#1,064 |
| 15. | Steilacoom | 17 | 1,351(1.26%)#15 | 231,222(0.01%)#1,088 |
| 16. | Kirkland | 14 | 1,351(1.04%)#16 | 231,222(0.01%)#1,162 |
| 17. | Lake Stevens | 14 | 1,351(1.04%)#17 | 231,222(0.01%)#1,172 |
| 18. | Maple Valley | 11 | 1,351(0.81%)#18 | 231,222(0.00%)#1,296 |
| 19. | Fairwood Cdp King County | 10 | 1,351(0.74%)#19 | 231,222(0.00%)#1,347 |
| 20. | Woodinville | 10 | 1,351(0.74%)#20 | 231,222(0.00%)#1,354 |
| 21. | Sudden Valley | 8 | 1,351(0.59%)#21 | 231,222(0.00%)#1,450 |
| 22. | Lynden | 7 | 1,351(0.52%)#22 | 231,222(0.00%)#1,485 |
| 23. | Enumclaw | 7 | 1,351(0.52%)#23 | 231,222(0.00%)#1,491 |
| 24. | Fall City | 7 | 1,351(0.52%)#24 | 231,222(0.00%)#1,512 |
| 25. | Spanaway | 6 | 1,351(0.44%)#25 | 231,222(0.00%)#1,527 |
| 26. | Rock Island | 6 | 1,351(0.44%)#26 | 231,222(0.00%)#1,559 |
| 27. | Bremerton | 5 | 1,351(0.37%)#27 | 231,222(0.00%)#1,575 |
| 28. | Grand Mound | 5 | 1,351(0.37%)#28 | 231,222(0.00%)#1,596 |
| 29. | Clear Lake Cdp Skagit County | 3 | 1,351(0.22%)#29 | 231,222(0.00%)#1,673 |
| 30. | Fern Prairie | 1 | 1,351(0.07%)#30 | 231,222(0.00%)#1,717 |
Common Questions
What are the Top 10 Cities with the Most Immigrants from Trinidad and Tobago in Washington?
Top 10 Cities with the Most Immigrants from Trinidad and Tobago in Washington are:
#1
456
#2
260
#3
94
#4
84
#5
46
#6
39
#7
32
#8
27
#9
27
#10
24
What city has the Most Immigrants from Trinidad and Tobago in Washington?
Seattle has the Most Immigrants from Trinidad and Tobago in Washington with 456.
What is the Total Immigrants from Trinidad and Tobago in the State of Washington?
Total Immigrants from Trinidad and Tobago in Washington is 1,351.
What is the Total Immigrants from Trinidad and Tobago in the United States?
Total Immigrants from Trinidad and Tobago in the United States is 231,222.