Queets, WA Map & Demographics
Queets Map
Queets Overview
$12,970
PER CAPITA INCOME
$40,000
AVG FAMILY INCOME
$50,208
AVG HOUSEHOLD INCOME
0.33
INEQUALITY / GINI INDEX
114
TOTAL POPULATION
46
MALE POPULATION
68
FEMALE POPULATION
67.65
MALES / 100 FEMALES
147.83
FEMALES / 100 MALES
30.3
MEDIAN AGE
4.2
AVG FAMILY SIZE
3.7
AVG HOUSEHOLD SIZE
33
LABOR FORCE [ PEOPLE ]
43.4%
PERCENT IN LABOR FORCE
12.1%
UNEMPLOYMENT RATE
Income in Queets
Income Overview in Queets
Per Capita Income in Queets is $12,970, while median incomes of families and households are $40,000 and $50,208 respectively.
| Characteristic | Number | Measure |
| Per Capita Income | 114 | $12,970 |
| Median Family Income | 24 | $40,000 |
| Mean Family Income | 24 | $41,483 |
| Median Household Income | 31 | $50,208 |
| Mean Household Income | 31 | $42,890 |
| Income Deficit | 24 | $0 |
| Wage / Income Gap (%) | 114 | 0.00% |
| Wage / Income Gap ($) | 114 | 100.00¢ per $1 |
| Gini / Inequality Index | 114 | 0.33 |
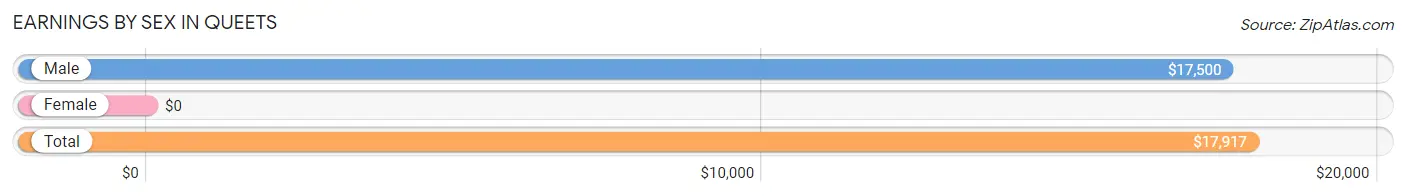
Earnings by Sex in Queets
| Sex | Number | Average Earnings |
| Male | 16 (39.0%) | $17,500 |
| Female | 25 (61.0%) | $0 |
| Total | 41 (100.0%) | $17,917 |
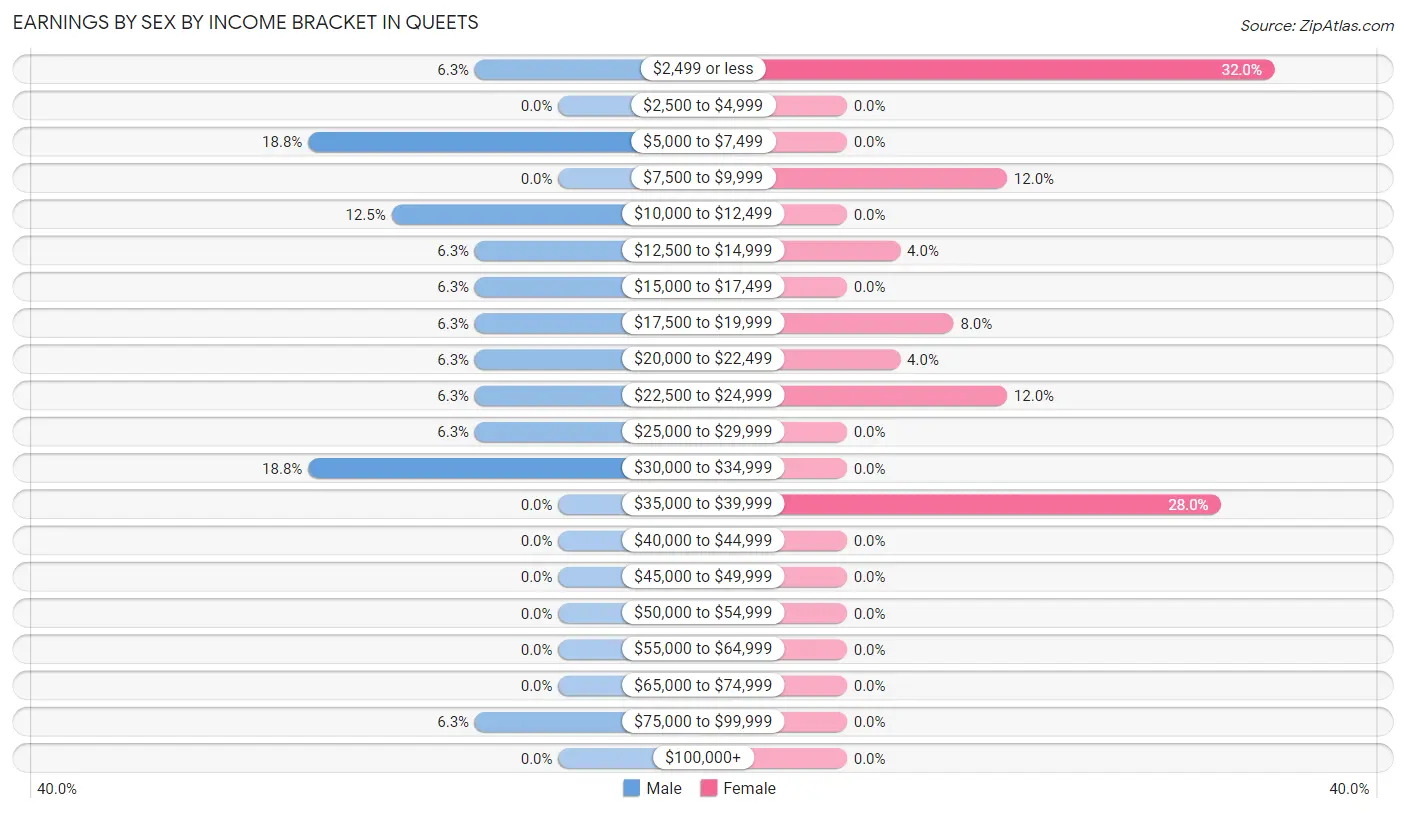
Earnings by Sex by Income Bracket in Queets
The most common earnings brackets in Queets are $5,000 to $7,499 for men (3 | 18.8%) and $2,499 or less for women (8 | 32.0%).
| Income | Male | Female |
| $2,499 or less | 1 (6.2%) | 8 (32.0%) |
| $2,500 to $4,999 | 0 (0.0%) | 0 (0.0%) |
| $5,000 to $7,499 | 3 (18.8%) | 0 (0.0%) |
| $7,500 to $9,999 | 0 (0.0%) | 3 (12.0%) |
| $10,000 to $12,499 | 2 (12.5%) | 0 (0.0%) |
| $12,500 to $14,999 | 1 (6.2%) | 1 (4.0%) |
| $15,000 to $17,499 | 1 (6.2%) | 0 (0.0%) |
| $17,500 to $19,999 | 1 (6.2%) | 2 (8.0%) |
| $20,000 to $22,499 | 1 (6.2%) | 1 (4.0%) |
| $22,500 to $24,999 | 1 (6.2%) | 3 (12.0%) |
| $25,000 to $29,999 | 1 (6.2%) | 0 (0.0%) |
| $30,000 to $34,999 | 3 (18.8%) | 0 (0.0%) |
| $35,000 to $39,999 | 0 (0.0%) | 7 (28.0%) |
| $40,000 to $44,999 | 0 (0.0%) | 0 (0.0%) |
| $45,000 to $49,999 | 0 (0.0%) | 0 (0.0%) |
| $50,000 to $54,999 | 0 (0.0%) | 0 (0.0%) |
| $55,000 to $64,999 | 0 (0.0%) | 0 (0.0%) |
| $65,000 to $74,999 | 0 (0.0%) | 0 (0.0%) |
| $75,000 to $99,999 | 1 (6.2%) | 0 (0.0%) |
| $100,000+ | 0 (0.0%) | 0 (0.0%) |
| Total | 16 (100.0%) | 25 (100.0%) |
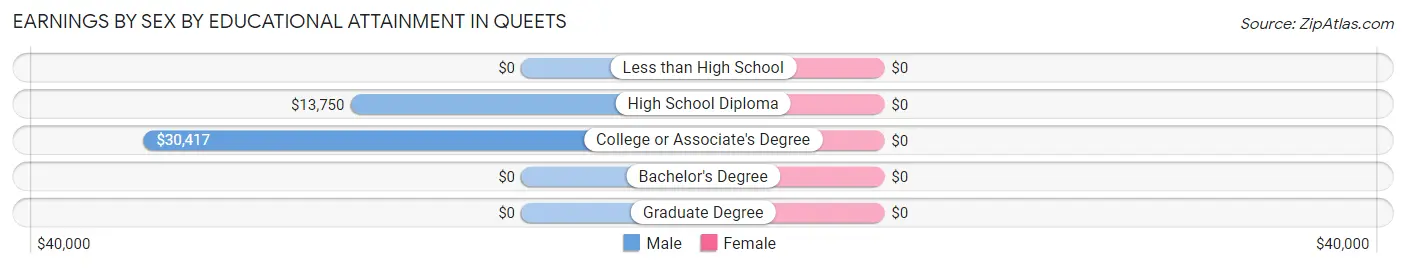
Earnings by Sex by Educational Attainment in Queets
| Educational Attainment | Male Income | Female Income |
| Less than High School | - | - |
| High School Diploma | $13,750 | $0 |
| College or Associate's Degree | $30,417 | $0 |
| Bachelor's Degree | - | - |
| Graduate Degree | - | - |
| Total | $17,500 | $22,500 |
Family Income in Queets
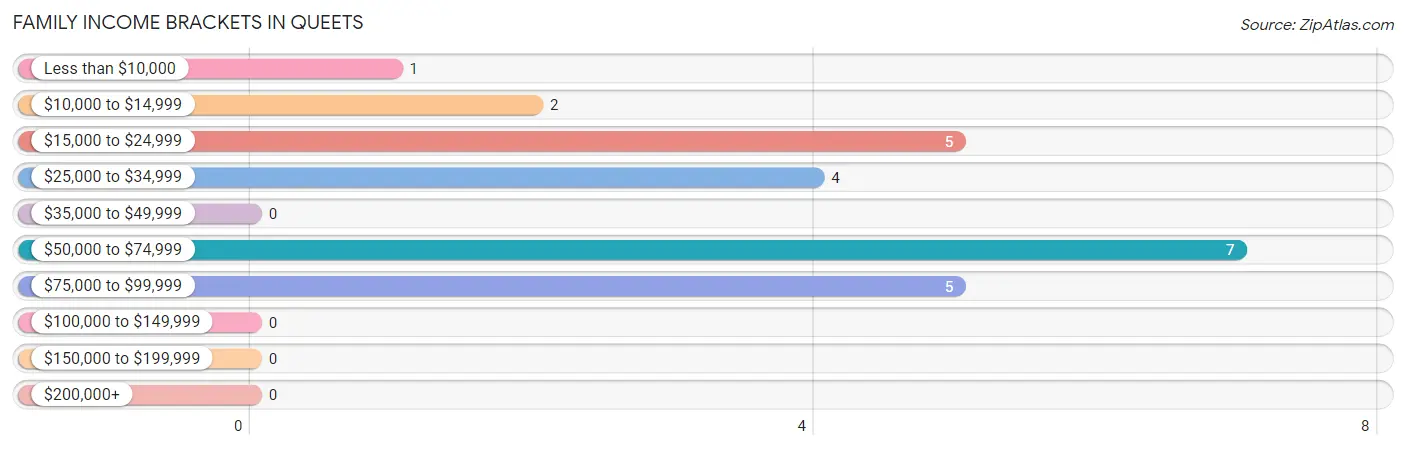
Family Income Brackets in Queets
According to the Queets family income data, there are 7 families falling into the $50,000 to $74,999 income range, which is the most common income bracket and makes up 29.2% of all families.
| Income Bracket | # Families | % Families |
| Less than $10,000 | 1 | 4.2% |
| $10,000 to $14,999 | 2 | 8.3% |
| $15,000 to $24,999 | 5 | 20.8% |
| $25,000 to $34,999 | 4 | 16.7% |
| $35,000 to $49,999 | 0 | 0.0% |
| $50,000 to $74,999 | 7 | 29.2% |
| $75,000 to $99,999 | 5 | 20.8% |
| $100,000 to $149,999 | 0 | 0.0% |
| $150,000 to $199,999 | 0 | 0.0% |
| $200,000+ | 0 | 0.0% |
Family Income by Famaliy Size in Queets
| Income Bracket | # Families | Median Income |
| 2-Person Families | 15 (62.5%) | $0 |
| 3-Person Families | 2 (8.3%) | $0 |
| 4-Person Families | 0 (0.0%) | $0 |
| 5-Person Families | 0 (0.0%) | $0 |
| 6-Person Families | 0 (0.0%) | $0 |
| 7+ Person Families | 7 (29.2%) | $0 |
| Total | 24 (100.0%) | $40,000 |
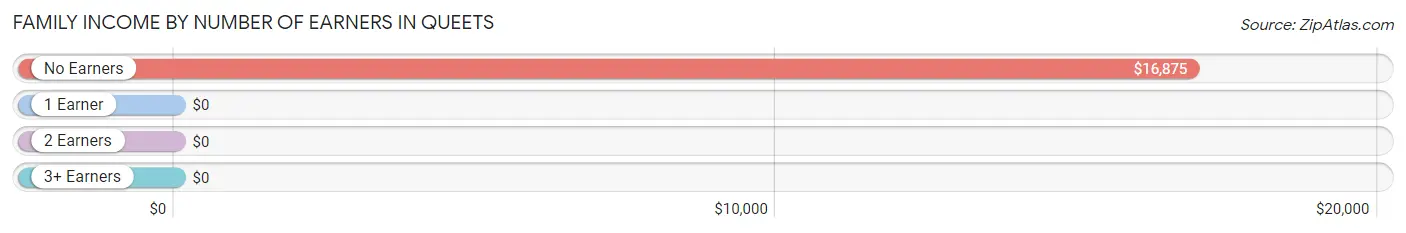
Family Income by Number of Earners in Queets
| Number of Earners | # Families | Median Income |
| No Earners | 8 (33.3%) | $16,875 |
| 1 Earner | 5 (20.8%) | $0 |
| 2 Earners | 9 (37.5%) | $0 |
| 3+ Earners | 2 (8.3%) | $0 |
| Total | 24 (100.0%) | $40,000 |
Household Income in Queets
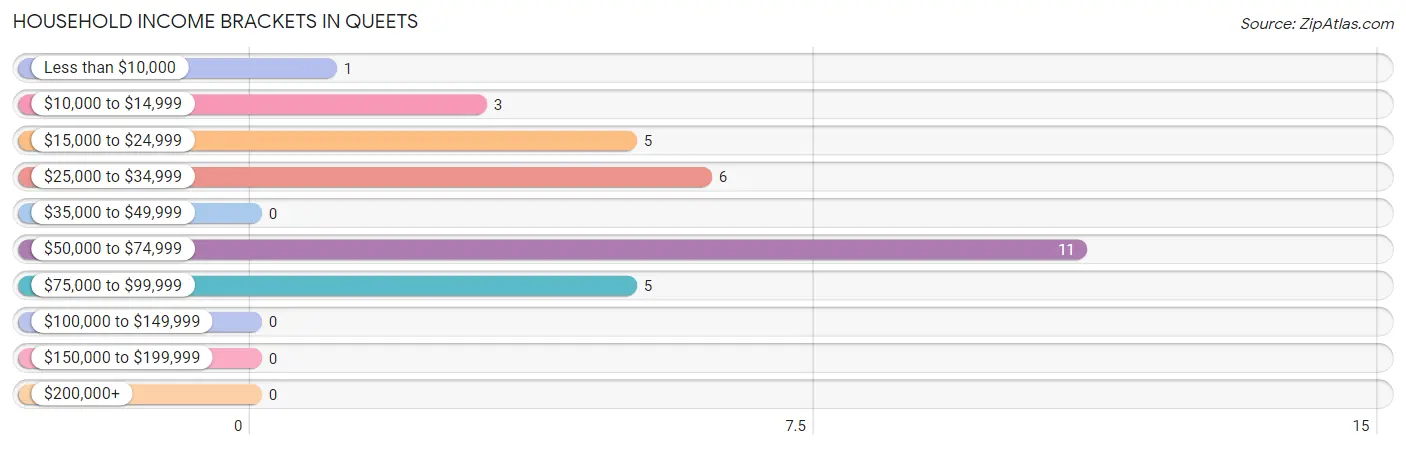
Household Income Brackets in Queets
With 11 households falling in the category, the $50,000 to $74,999 income range is the most frequent in Queets, accounting for 35.5% of all households.
| Income Bracket | # Households | % Households |
| Less than $10,000 | 1 | 3.2% |
| $10,000 to $14,999 | 3 | 9.7% |
| $15,000 to $24,999 | 5 | 16.1% |
| $25,000 to $34,999 | 6 | 19.4% |
| $35,000 to $49,999 | 0 | 0.0% |
| $50,000 to $74,999 | 11 | 35.5% |
| $75,000 to $99,999 | 5 | 16.1% |
| $100,000 to $149,999 | 0 | 0.0% |
| $150,000 to $199,999 | 0 | 0.0% |
| $200,000+ | 0 | 0.0% |
Household Income by Householder Age in Queets
The median household income in Queets is $50,208, with the highest median household income of $51,563 found in the 65+ years age bracket for the primary householder. A total of 19 households (61.3%) fall into this category.
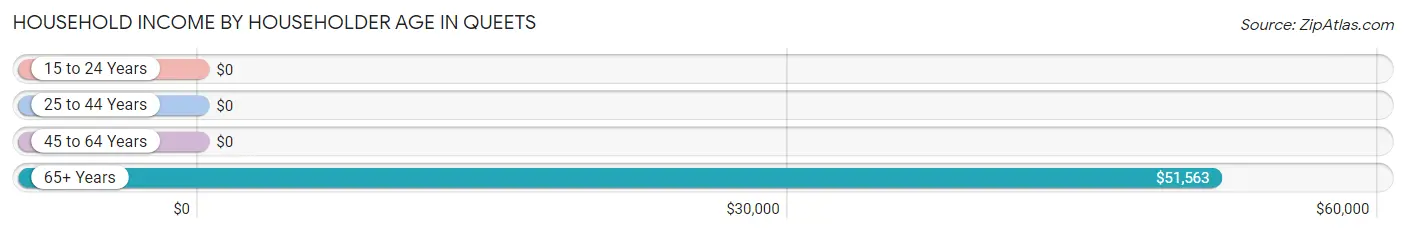
| Income Bracket | # Households | Median Income |
| 15 to 24 Years | 0 (0.0%) | $0 |
| 25 to 44 Years | 4 (12.9%) | $0 |
| 45 to 64 Years | 8 (25.8%) | $0 |
| 65+ Years | 19 (61.3%) | $51,563 |
| Total | 31 (100.0%) | $50,208 |
Poverty in Queets
Income Below Poverty by Sex and Age in Queets
With 30.4% poverty level for males and 25.0% for females among the residents of Queets, 35 to 44 year old males and 16 and 17 year old females are the most vulnerable to poverty, with 2 males (100.0%) and 2 females (100.0%) in their respective age groups living below the poverty level.
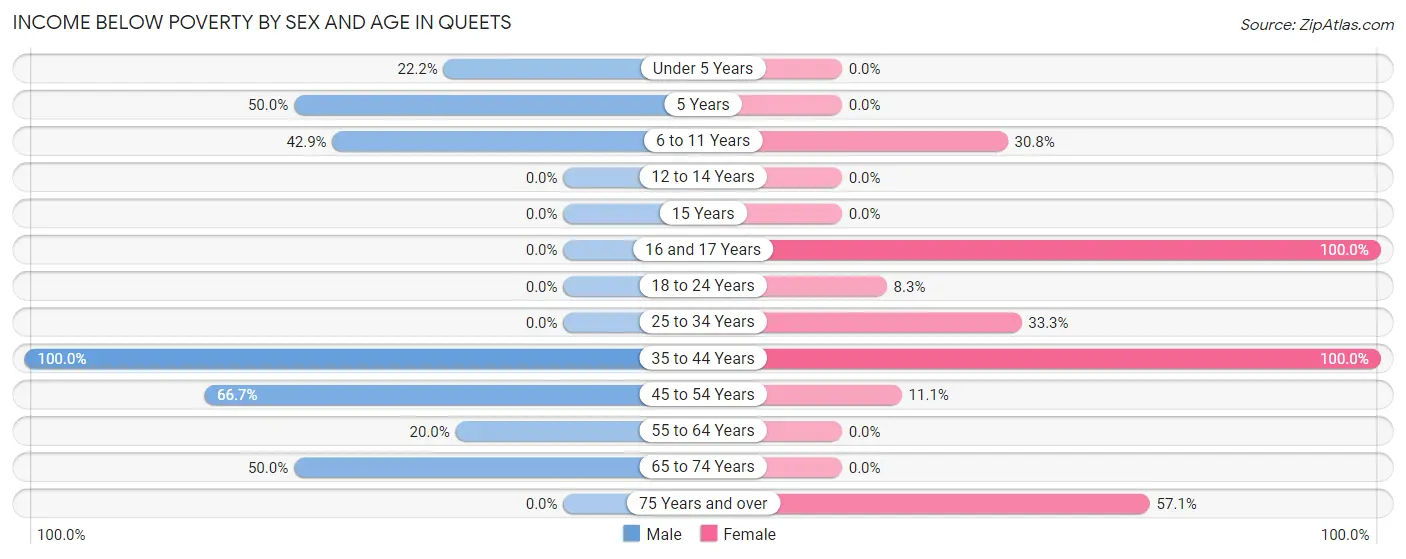
| Age Bracket | Male | Female |
| Under 5 Years | 2 (22.2%) | 0 (0.0%) |
| 5 Years | 2 (50.0%) | 0 (0.0%) |
| 6 to 11 Years | 3 (42.9%) | 4 (30.8%) |
| 12 to 14 Years | 0 (0.0%) | 0 (0.0%) |
| 15 Years | 0 (0.0%) | 0 (0.0%) |
| 16 and 17 Years | 0 (0.0%) | 2 (100.0%) |
| 18 to 24 Years | 0 (0.0%) | 1 (8.3%) |
| 25 to 34 Years | 0 (0.0%) | 2 (33.3%) |
| 35 to 44 Years | 2 (100.0%) | 3 (100.0%) |
| 45 to 54 Years | 2 (66.7%) | 1 (11.1%) |
| 55 to 64 Years | 1 (20.0%) | 0 (0.0%) |
| 65 to 74 Years | 2 (50.0%) | 0 (0.0%) |
| 75 Years and over | 0 (0.0%) | 4 (57.1%) |
| Total | 14 (30.4%) | 17 (25.0%) |
Income Above Poverty by Sex and Age in Queets
According to the poverty statistics in Queets, males aged 25 to 34 years and females aged under 5 years are the age groups that are most secure financially, with 100.0% of males and 100.0% of females in these age groups living above the poverty line.
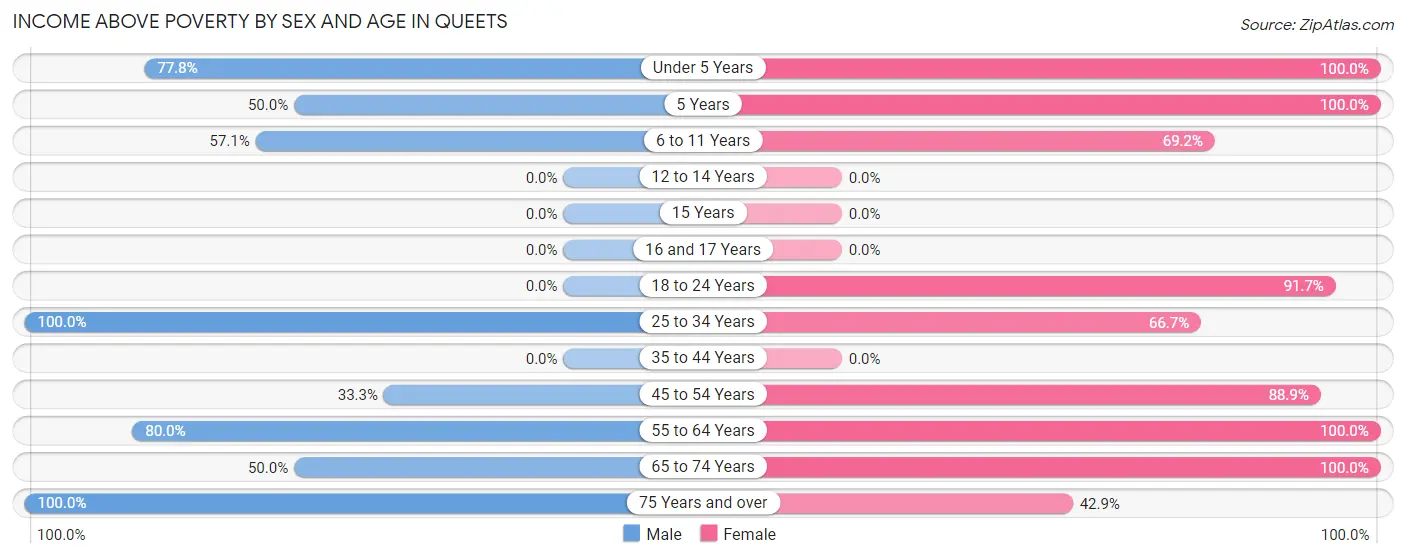
| Age Bracket | Male | Female |
| Under 5 Years | 7 (77.8%) | 3 (100.0%) |
| 5 Years | 2 (50.0%) | 2 (100.0%) |
| 6 to 11 Years | 4 (57.1%) | 9 (69.2%) |
| 12 to 14 Years | 0 (0.0%) | 0 (0.0%) |
| 15 Years | 0 (0.0%) | 0 (0.0%) |
| 16 and 17 Years | 0 (0.0%) | 0 (0.0%) |
| 18 to 24 Years | 0 (0.0%) | 11 (91.7%) |
| 25 to 34 Years | 8 (100.0%) | 4 (66.7%) |
| 35 to 44 Years | 0 (0.0%) | 0 (0.0%) |
| 45 to 54 Years | 1 (33.3%) | 8 (88.9%) |
| 55 to 64 Years | 4 (80.0%) | 4 (100.0%) |
| 65 to 74 Years | 2 (50.0%) | 7 (100.0%) |
| 75 Years and over | 4 (100.0%) | 3 (42.9%) |
| Total | 32 (69.6%) | 51 (75.0%) |
Income Below Poverty Among Married-Couple Families in Queets
The poverty statistics for married-couple families in Queets show that 16.7% or 1 of the total 6 families live below the poverty line. Families with no children have the highest poverty rate of 20.0%, comprising of 1 families. On the other hand, families with 1 or 2 children have the lowest poverty rate of 0.0%, which includes 0 families.
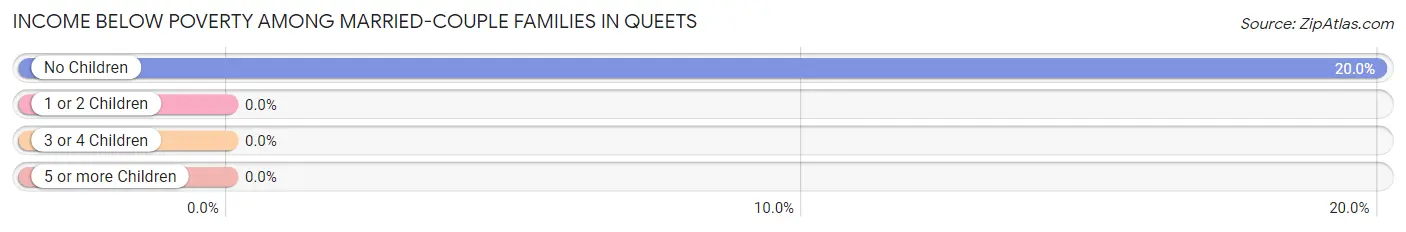
| Children | Above Poverty | Below Poverty |
| No Children | 4 (80.0%) | 1 (20.0%) |
| 1 or 2 Children | 1 (100.0%) | 0 (0.0%) |
| 3 or 4 Children | 0 (0.0%) | 0 (0.0%) |
| 5 or more Children | 0 (0.0%) | 0 (0.0%) |
| Total | 5 (83.3%) | 1 (16.7%) |
Income Below Poverty Among Single-Parent Households in Queets
According to the poverty data in Queets, 50.0% or 2 single-father households and 42.9% or 6 single-mother households are living below the poverty line. Among single-father households, those with no children have the highest poverty rate, with 2 households (66.7%) experiencing poverty. Likewise, among single-mother households, those with 1 or 2 children have the highest poverty rate, with 4 households (100.0%) falling below the poverty line.
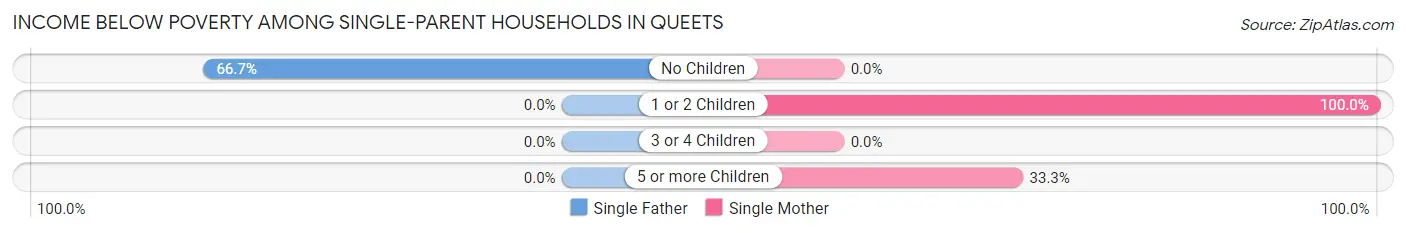
| Children | Single Father | Single Mother |
| No Children | 2 (66.7%) | 0 (0.0%) |
| 1 or 2 Children | 0 (0.0%) | 4 (100.0%) |
| 3 or 4 Children | 0 (0.0%) | 0 (0.0%) |
| 5 or more Children | 0 (0.0%) | 2 (33.3%) |
| Total | 2 (50.0%) | 6 (42.9%) |
Income Below Poverty Among Married-Couple vs Single-Parent Households in Queets
The poverty data for Queets shows that 1 of the married-couple family households (16.7%) and 8 of the single-parent households (44.4%) are living below the poverty level. Within the married-couple family households, those with no children have the highest poverty rate, with 1 households (20.0%) falling below the poverty line. Among the single-parent households, those with 1 or 2 children have the highest poverty rate, with 4 household (80.0%) living below poverty.
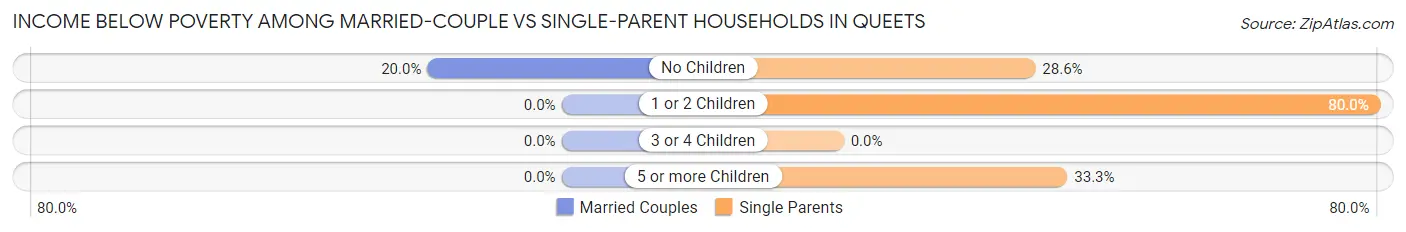
| Children | Married-Couple Families | Single-Parent Households |
| No Children | 1 (20.0%) | 2 (28.6%) |
| 1 or 2 Children | 0 (0.0%) | 4 (80.0%) |
| 3 or 4 Children | 0 (0.0%) | 0 (0.0%) |
| 5 or more Children | 0 (0.0%) | 2 (33.3%) |
| Total | 1 (16.7%) | 8 (44.4%) |
Race in Queets
The most populous races in Queets are Native / Alaskan (95 | 83.3%), Two or more Races (12 | 10.5%), and Black / African American (5 | 4.4%).
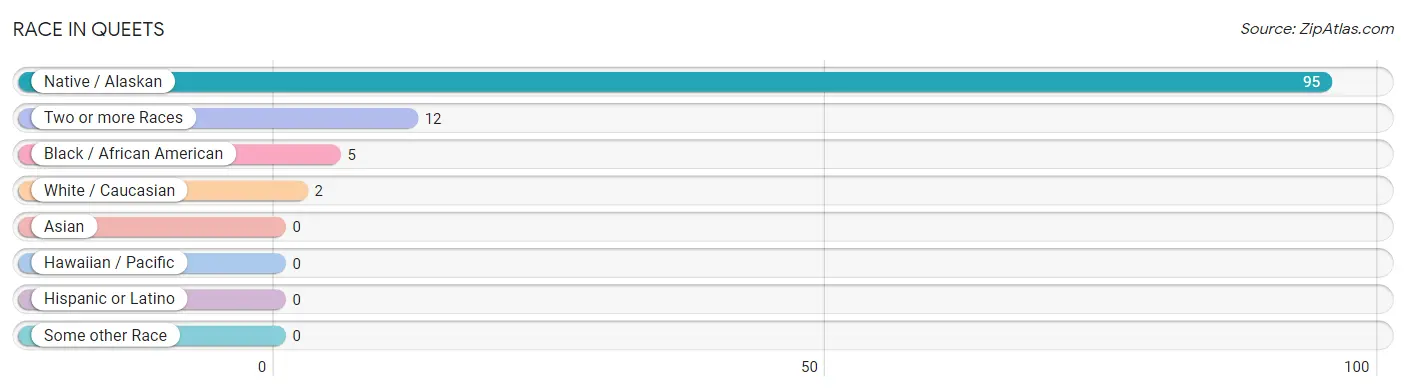
| Race | # Population | % Population |
| Asian | 0 | 0.0% |
| Black / African American | 5 | 4.4% |
| Hawaiian / Pacific | 0 | 0.0% |
| Hispanic or Latino | 0 | 0.0% |
| Native / Alaskan | 95 | 83.3% |
| White / Caucasian | 2 | 1.8% |
| Two or more Races | 12 | 10.5% |
| Some other Race | 0 | 0.0% |
| Total | 114 | 100.0% |
Ancestry in Queets
The most populous ancestries reported in Queets are Puget Sound Salish (8 | 7.0%), Cherokee (3 | 2.6%), Alaska Native (2 | 1.8%), and Scottish (2 | 1.8%), together accounting for 13.2% of all Queets residents.
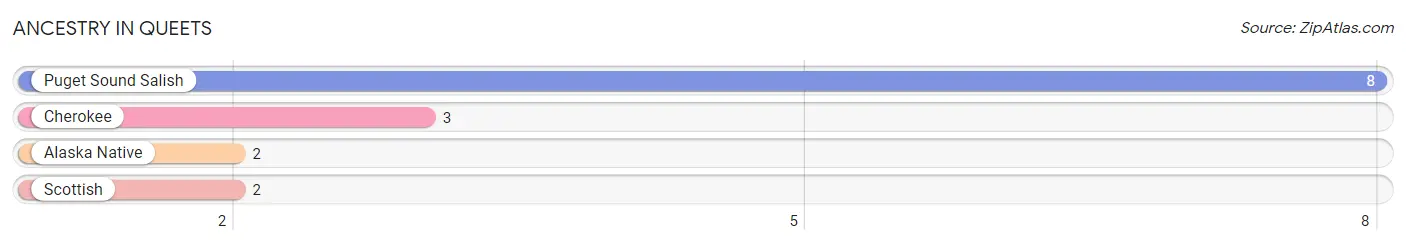
| Ancestry | # Population | % Population |
| Alaska Native | 2 | 1.8% |
| Cherokee | 3 | 2.6% |
| Puget Sound Salish | 8 | 7.0% |
| Scottish | 2 | 1.8% | View All 4 Rows |
Immigrants in Queets

| Immigration Origin | # Population | % Population | View All 0 Rows |
Sex and Age in Queets
Sex and Age in Queets
The most populous age groups in Queets are Under 5 Years (9 | 19.6%) for men and 5 to 9 Years (13 | 19.1%) for women.
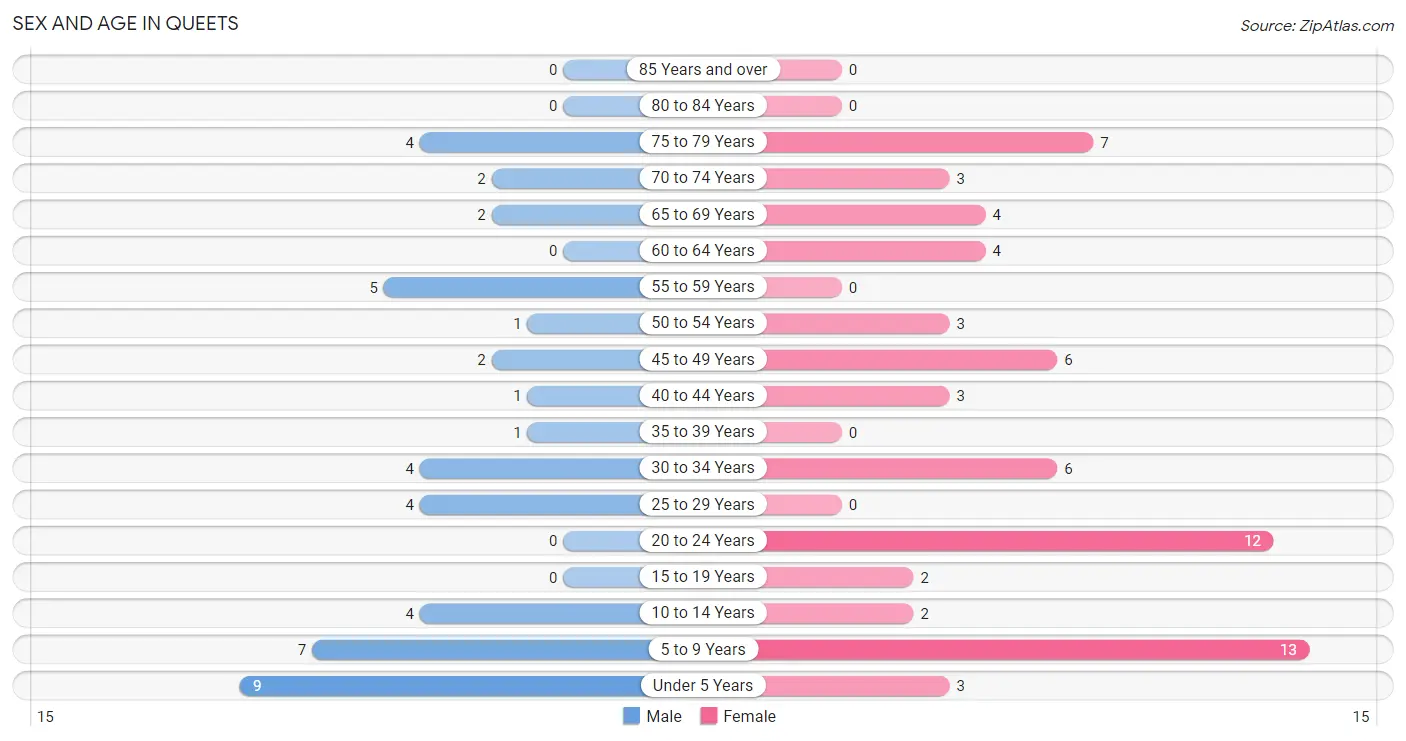
| Age Bracket | Male | Female |
| Under 5 Years | 9 (19.6%) | 3 (4.4%) |
| 5 to 9 Years | 7 (15.2%) | 13 (19.1%) |
| 10 to 14 Years | 4 (8.7%) | 2 (2.9%) |
| 15 to 19 Years | 0 (0.0%) | 2 (2.9%) |
| 20 to 24 Years | 0 (0.0%) | 12 (17.6%) |
| 25 to 29 Years | 4 (8.7%) | 0 (0.0%) |
| 30 to 34 Years | 4 (8.7%) | 6 (8.8%) |
| 35 to 39 Years | 1 (2.2%) | 0 (0.0%) |
| 40 to 44 Years | 1 (2.2%) | 3 (4.4%) |
| 45 to 49 Years | 2 (4.3%) | 6 (8.8%) |
| 50 to 54 Years | 1 (2.2%) | 3 (4.4%) |
| 55 to 59 Years | 5 (10.9%) | 0 (0.0%) |
| 60 to 64 Years | 0 (0.0%) | 4 (5.9%) |
| 65 to 69 Years | 2 (4.3%) | 4 (5.9%) |
| 70 to 74 Years | 2 (4.3%) | 3 (4.4%) |
| 75 to 79 Years | 4 (8.7%) | 7 (10.3%) |
| 80 to 84 Years | 0 (0.0%) | 0 (0.0%) |
| 85 Years and over | 0 (0.0%) | 0 (0.0%) |
| Total | 46 (100.0%) | 68 (100.0%) |
Families and Households in Queets
Median Family Size in Queets
The median family size in Queets is 4.25 persons per family, with married-couple families (6 | 25.0%) accounting for the largest median family size of 5.67 persons per family. On the other hand, single male/father families (4 | 16.7%) represent the smallest median family size with 2.25 persons per family.
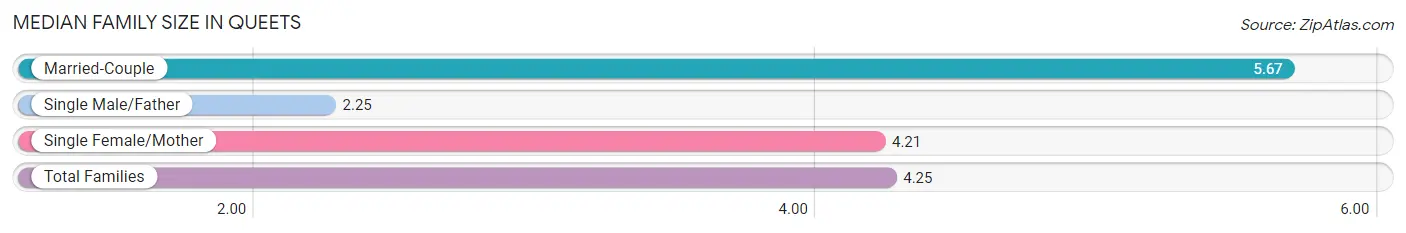
| Family Type | # Families | Family Size |
| Married-Couple | 6 (25.0%) | 5.67 |
| Single Male/Father | 4 (16.7%) | 2.25 |
| Single Female/Mother | 14 (58.3%) | 4.21 |
| Total Families | 24 (100.0%) | 4.25 |
Median Household Size in Queets
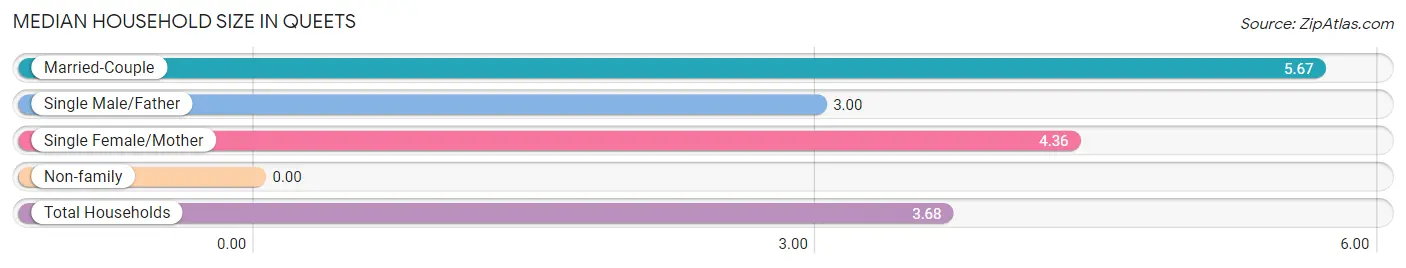
| Household Type | # Households | Household Size |
| Married-Couple | 6 (19.4%) | 5.67 |
| Single Male/Father | 4 (12.9%) | 3.00 |
| Single Female/Mother | 14 (45.2%) | 4.36 |
| Non-family | 7 (22.6%) | - |
| Total Households | 31 (100.0%) | 3.68 |
Household Size by Marriage Status in Queets
Out of a total of 31 households in Queets, 24 (77.4%) are family households, while 7 (22.6%) are nonfamily households. The most numerous type of family households are 2-person households, comprising 14, and the most common type of nonfamily households are 1-person households, comprising 7.
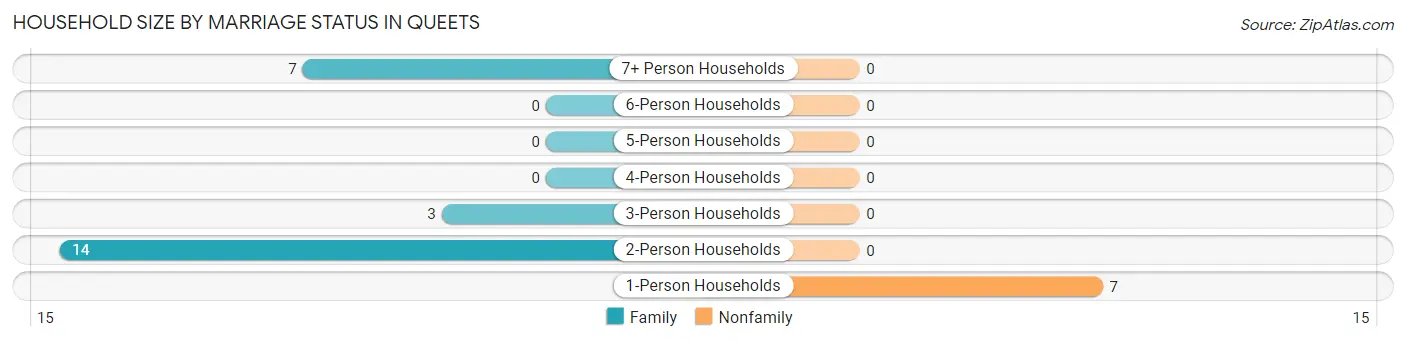
| Household Size | Family Households | Nonfamily Households |
| 1-Person Households | - | 7 (22.6%) |
| 2-Person Households | 14 (45.2%) | 0 (0.0%) |
| 3-Person Households | 3 (9.7%) | 0 (0.0%) |
| 4-Person Households | 0 (0.0%) | 0 (0.0%) |
| 5-Person Households | 0 (0.0%) | 0 (0.0%) |
| 6-Person Households | 0 (0.0%) | 0 (0.0%) |
| 7+ Person Households | 7 (22.6%) | 0 (0.0%) |
| Total | 24 (77.4%) | 7 (22.6%) |
Female Fertility in Queets
Fertility by Age in Queets
Average fertility rate in Queets is 138.0 births per 1,000 women. Women in the age bracket of 20 to 34 years have the highest fertility rate with 222.0 births per 1,000 women. Women in the age bracket of 20 to 34 years acount for 100.0% of all women with births.
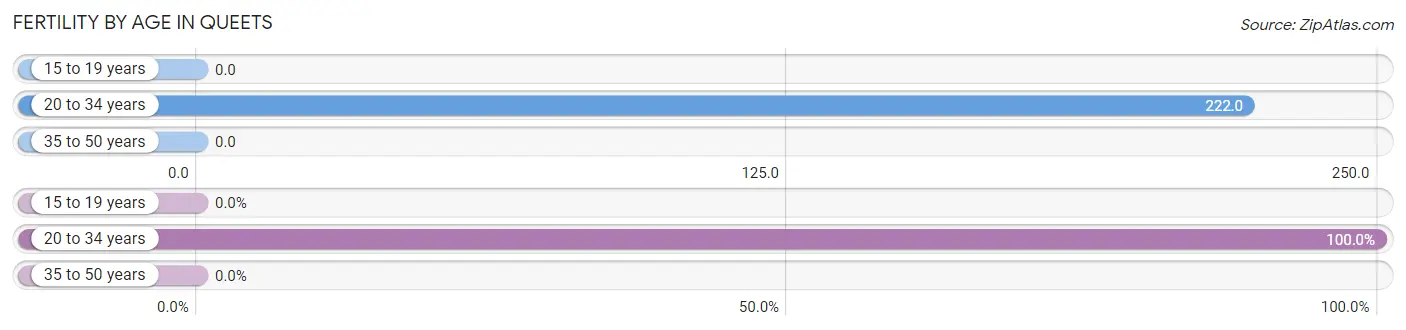
| Age Bracket | Women with Births | Births / 1,000 Women |
| 15 to 19 years | 0 (0.0%) | 0.0 |
| 20 to 34 years | 4 (100.0%) | 222.0 |
| 35 to 50 years | 0 (0.0%) | 0.0 |
| Total | 4 (100.0%) | 138.0 |
Fertility by Age by Marriage Status in Queets
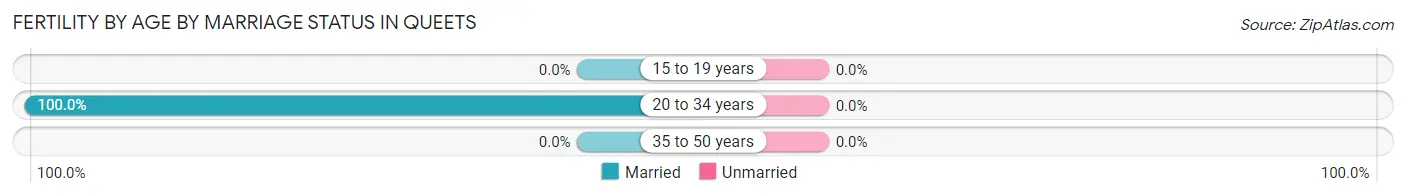
| Age Bracket | Married | Unmarried |
| 15 to 19 years | 0 (0.0%) | 0 (0.0%) |
| 20 to 34 years | 4 (100.0%) | 0 (0.0%) |
| 35 to 50 years | 0 (0.0%) | 0 (0.0%) |
| Total | 4 (100.0%) | 0 (0.0%) |
Fertility by Education in Queets
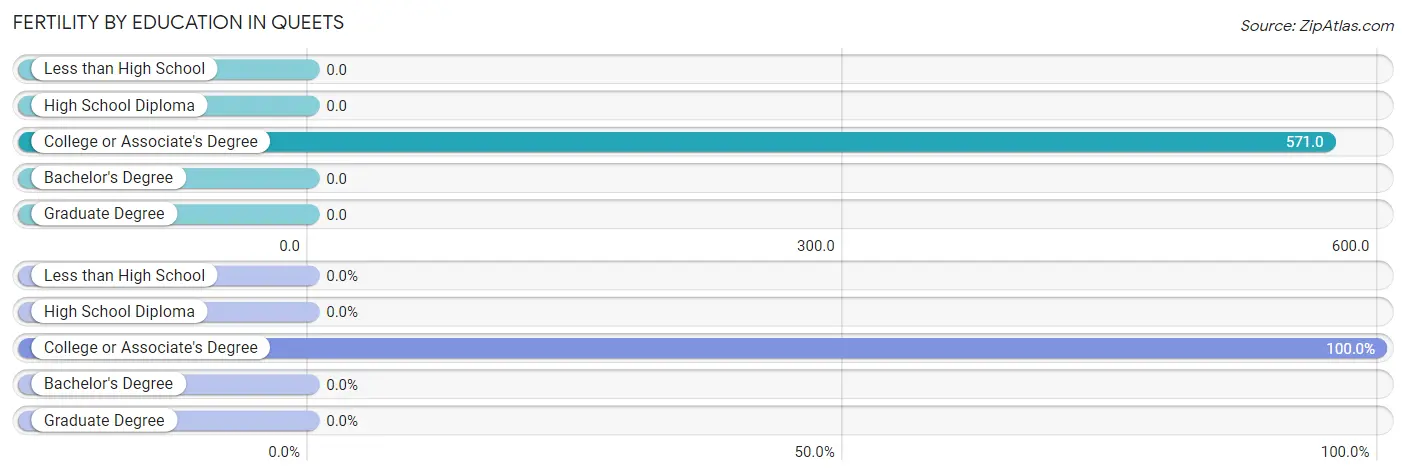
| Educational Attainment | Women with Births | Births / 1,000 Women |
| Less than High School | 0 (0.0%) | 0.0 |
| High School Diploma | 0 (0.0%) | 0.0 |
| College or Associate's Degree | 4 (100.0%) | 571.0 |
| Bachelor's Degree | 0 (0.0%) | 0.0 |
| Graduate Degree | 0 (0.0%) | 0.0 |
| Total | 4 (100.0%) | 138.0 |
Fertility by Education by Marriage Status in Queets
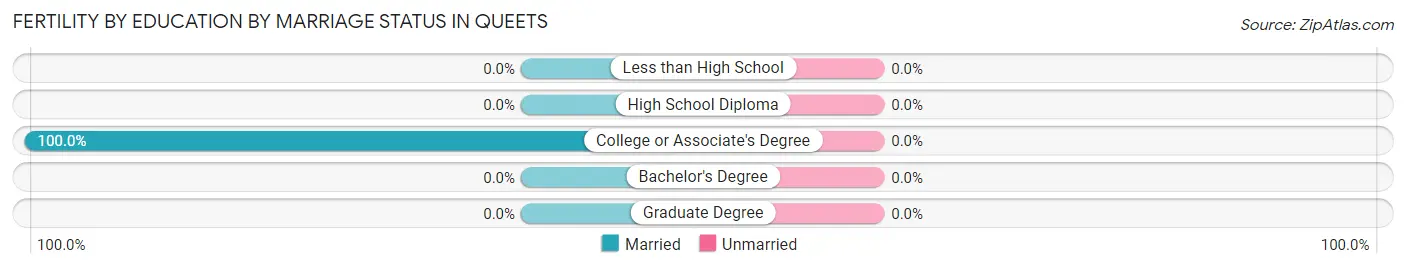
| Educational Attainment | Married | Unmarried |
| Less than High School | 0 (0.0%) | 0 (0.0%) |
| High School Diploma | 0 (0.0%) | 0 (0.0%) |
| College or Associate's Degree | 4 (100.0%) | 0 (0.0%) |
| Bachelor's Degree | 0 (0.0%) | 0 (0.0%) |
| Graduate Degree | 0 (0.0%) | 0 (0.0%) |
| Total | 4 (100.0%) | 0 (0.0%) |
Employment Characteristics in Queets
Employment by Class of Employer in Queets
Among the 24 employed individuals in Queets, local government employees (14 | 58.3%), state government employees (4 | 16.7%), and private company employees (3 | 12.5%) make up the most common classes of employment.
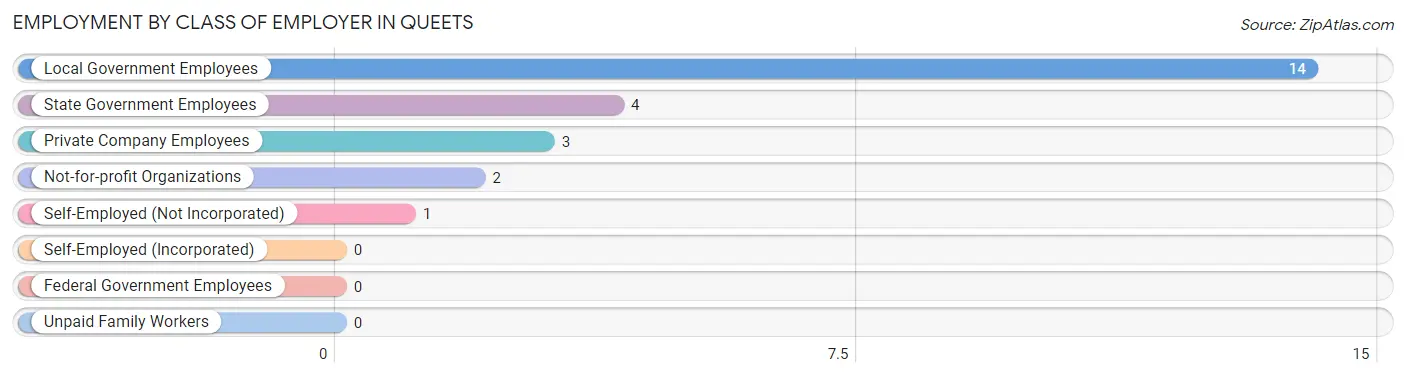
| Employer Class | # Employees | % Employees |
| Private Company Employees | 3 | 12.5% |
| Self-Employed (Incorporated) | 0 | 0.0% |
| Self-Employed (Not Incorporated) | 1 | 4.2% |
| Not-for-profit Organizations | 2 | 8.3% |
| Local Government Employees | 14 | 58.3% |
| State Government Employees | 4 | 16.7% |
| Federal Government Employees | 0 | 0.0% |
| Unpaid Family Workers | 0 | 0.0% |
| Total | 24 | 100.0% |
Employment Status by Age in Queets
According to the labor force statistics for Queets, out of the total population over 16 years of age (76), 43.4% or 33 individuals are in the labor force, with 12.1% or 4 of them unemployed. The age group with the highest labor force participation rate is 25 to 29 years, with 100.0% or 4 individuals in the labor force. Within the labor force, the 20 to 24 years age range has the highest percentage of unemployed individuals, with 57.1% or 4 of them being unemployed.
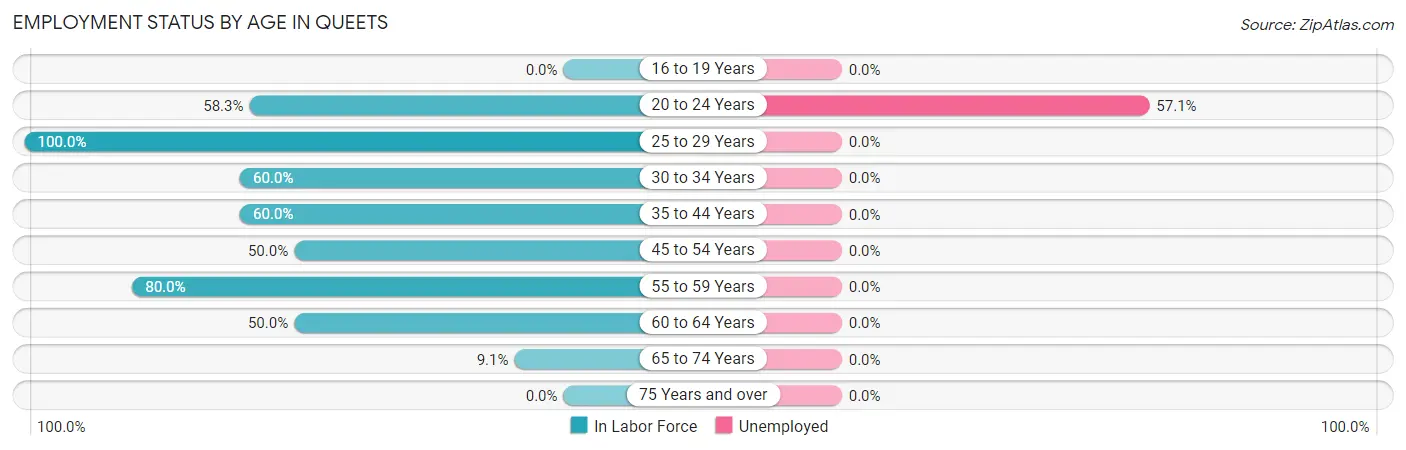
| Age Bracket | In Labor Force | Unemployed |
| 16 to 19 Years | 0 (0.0%) | 0 (0.0%) |
| 20 to 24 Years | 7 (58.3%) | 4 (57.1%) |
| 25 to 29 Years | 4 (100.0%) | 0 (0.0%) |
| 30 to 34 Years | 6 (60.0%) | 0 (0.0%) |
| 35 to 44 Years | 3 (60.0%) | 0 (0.0%) |
| 45 to 54 Years | 6 (50.0%) | 0 (0.0%) |
| 55 to 59 Years | 4 (80.0%) | 0 (0.0%) |
| 60 to 64 Years | 2 (50.0%) | 0 (0.0%) |
| 65 to 74 Years | 1 (9.1%) | 0 (0.0%) |
| 75 Years and over | 0 (0.0%) | 0 (0.0%) |
| Total | 33 (43.4%) | 4 (12.1%) |
Employment Status by Educational Attainment in Queets
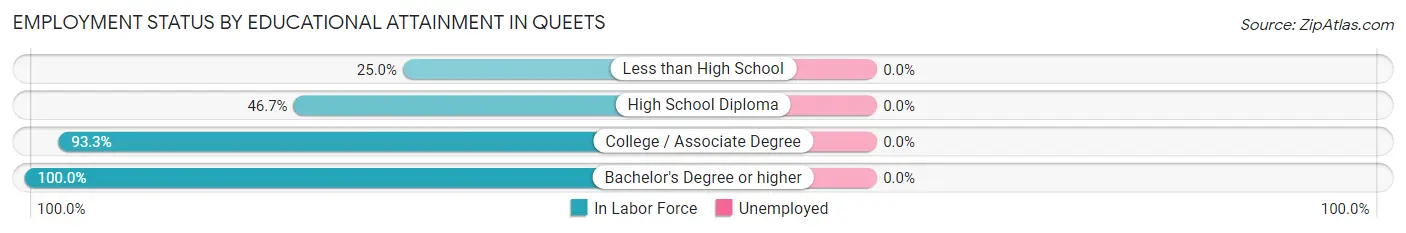
| Educational Attainment | In Labor Force | Unemployed |
| Less than High School | 2 (25.0%) | 0 (0.0%) |
| High School Diploma | 7 (46.7%) | 0 (0.0%) |
| College / Associate Degree | 14 (93.3%) | 0 (0.0%) |
| Bachelor's Degree or higher | 2 (100.0%) | 0 (0.0%) |
| Total | 25 (62.5%) | 0 (0.0%) |
Employment Occupations by Sex in Queets
Management, Business, Science and Arts Occupations
The most common Management, Business, Science and Arts occupations in Queets are Community & Social Service (7 | 24.1%), Education Instruction & Library (7 | 24.1%), Management (4 | 13.8%), Computers, Engineering & Science (1 | 3.5%), and Architecture & Engineering (1 | 3.5%).
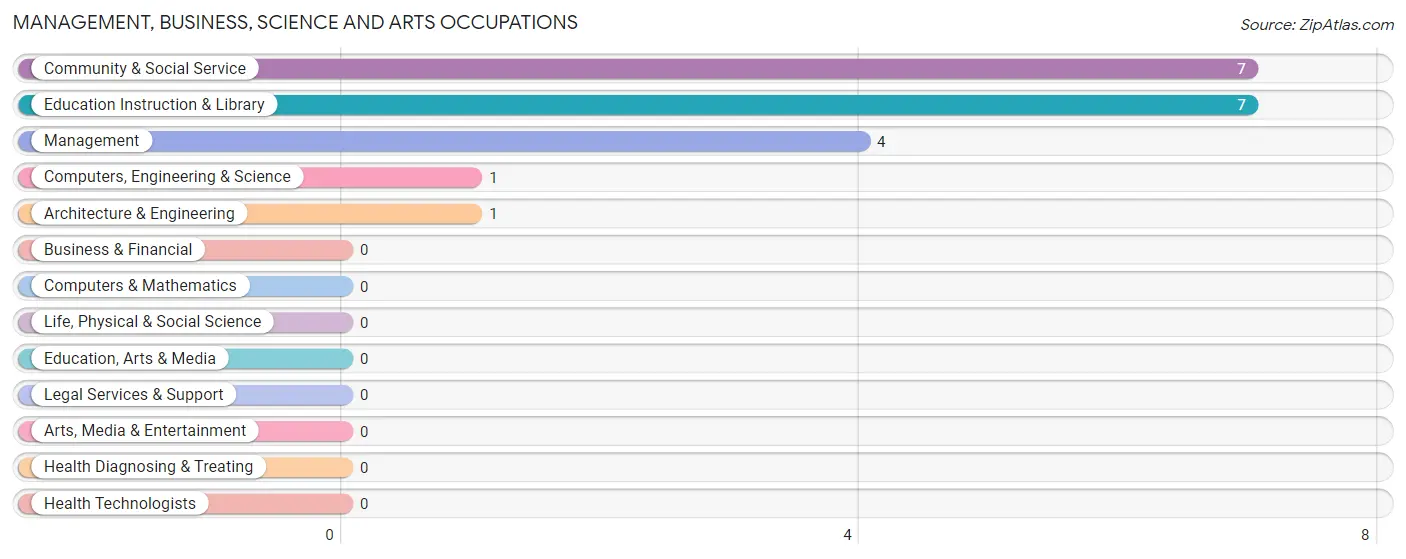
Management, Business, Science and Arts Occupations by Sex
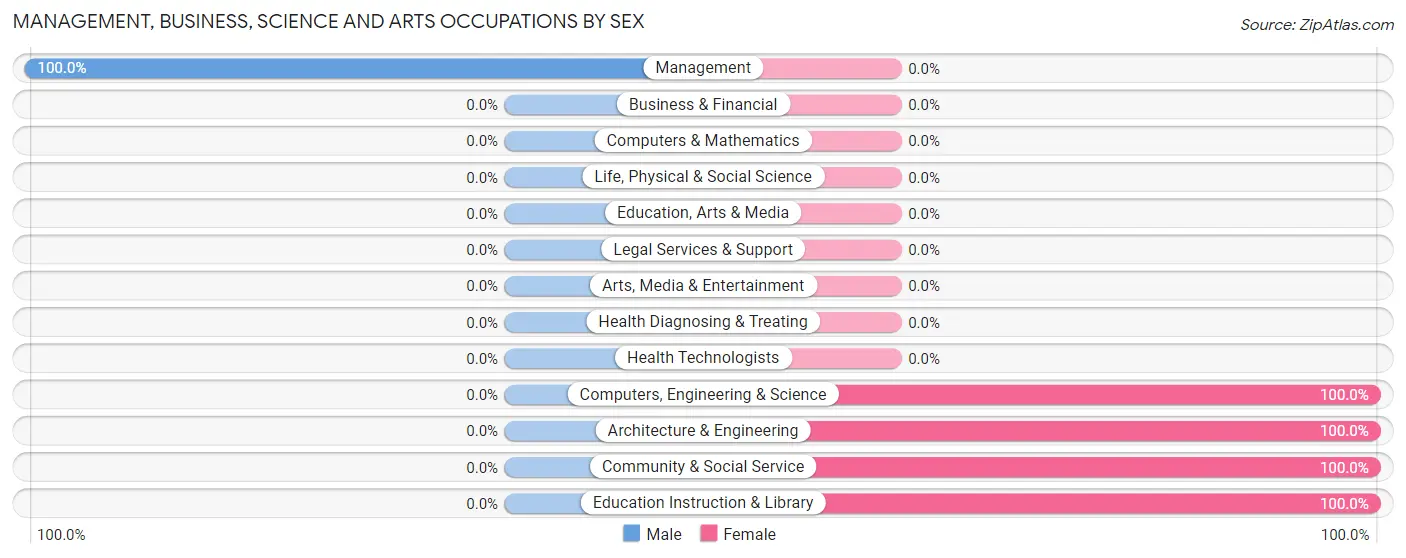
| Occupation | Male | Female |
| Management | 4 (100.0%) | 0 (0.0%) |
| Business & Financial | 0 (0.0%) | 0 (0.0%) |
| Computers, Engineering & Science | 0 (0.0%) | 1 (100.0%) |
| Computers & Mathematics | 0 (0.0%) | 0 (0.0%) |
| Architecture & Engineering | 0 (0.0%) | 1 (100.0%) |
| Life, Physical & Social Science | 0 (0.0%) | 0 (0.0%) |
| Community & Social Service | 0 (0.0%) | 7 (100.0%) |
| Education, Arts & Media | 0 (0.0%) | 0 (0.0%) |
| Legal Services & Support | 0 (0.0%) | 0 (0.0%) |
| Education Instruction & Library | 0 (0.0%) | 7 (100.0%) |
| Arts, Media & Entertainment | 0 (0.0%) | 0 (0.0%) |
| Health Diagnosing & Treating | 0 (0.0%) | 0 (0.0%) |
| Health Technologists | 0 (0.0%) | 0 (0.0%) |
| Total (Category) | 4 (33.3%) | 8 (66.7%) |
| Total (Overall) | 12 (41.4%) | 17 (58.6%) |
Services Occupations
The most common Services occupations in Queets are Food Preparation & Serving (4 | 13.8%), and Cleaning & Maintenance (2 | 6.9%).
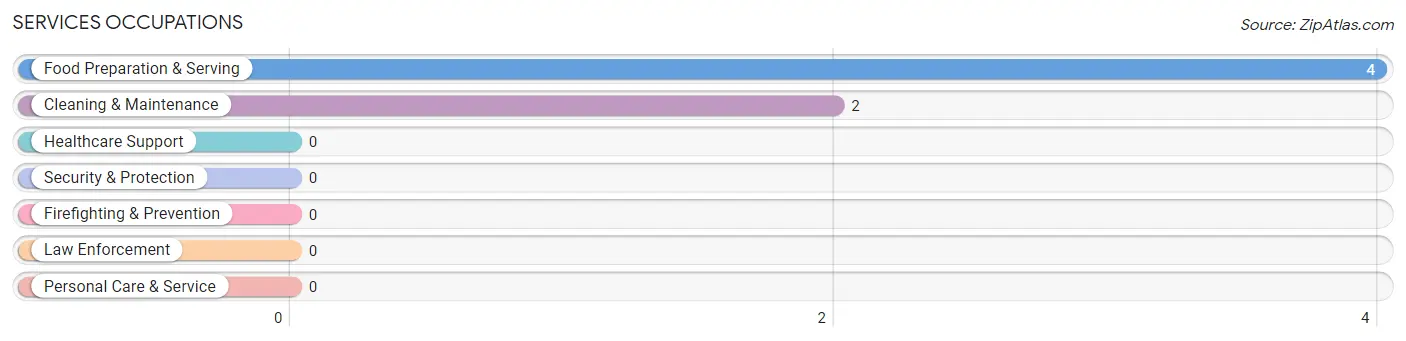
Services Occupations by Sex
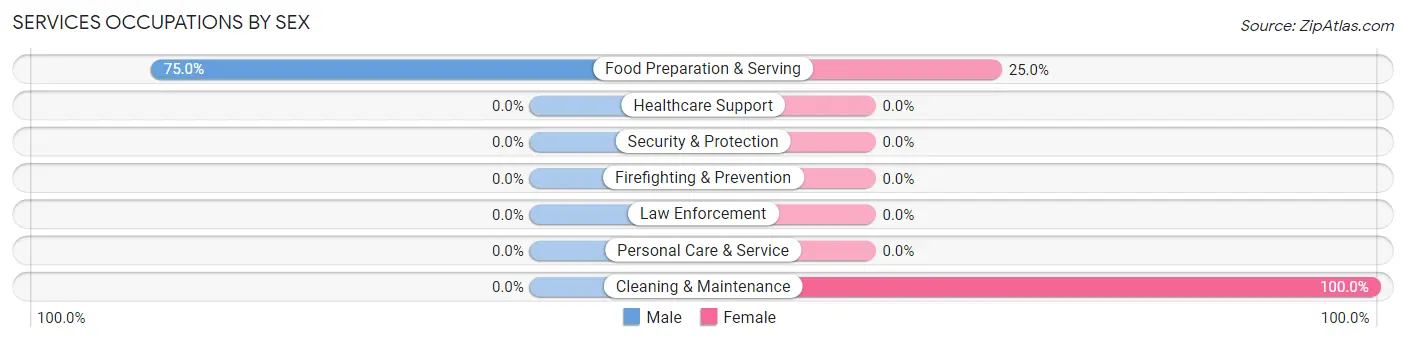
| Occupation | Male | Female |
| Healthcare Support | 0 (0.0%) | 0 (0.0%) |
| Security & Protection | 0 (0.0%) | 0 (0.0%) |
| Firefighting & Prevention | 0 (0.0%) | 0 (0.0%) |
| Law Enforcement | 0 (0.0%) | 0 (0.0%) |
| Food Preparation & Serving | 3 (75.0%) | 1 (25.0%) |
| Cleaning & Maintenance | 0 (0.0%) | 2 (100.0%) |
| Personal Care & Service | 0 (0.0%) | 0 (0.0%) |
| Total (Category) | 3 (50.0%) | 3 (50.0%) |
| Total (Overall) | 12 (41.4%) | 17 (58.6%) |
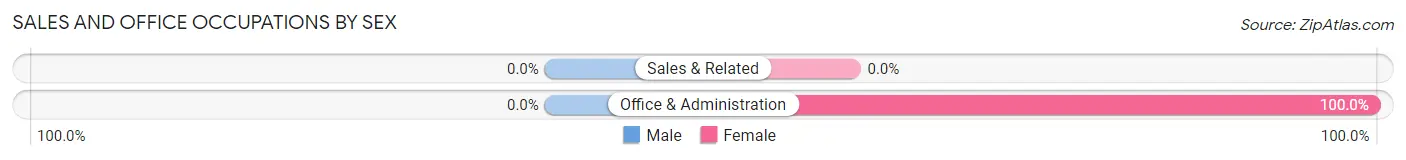
Sales and Office Occupations
The most common Sales and Office occupations in Queets are , and Office & Administration (3 | 10.3%).
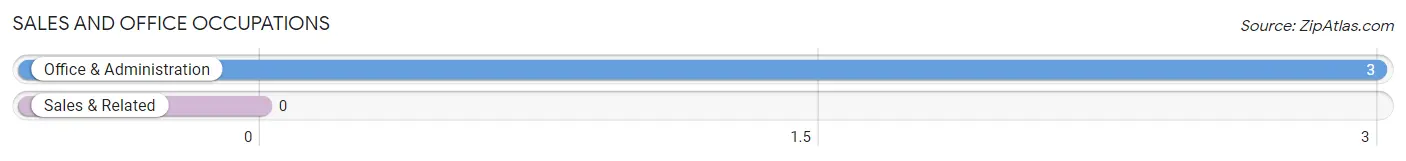
Sales and Office Occupations by Sex
| Occupation | Male | Female |
| Sales & Related | 0 (0.0%) | 0 (0.0%) |
| Office & Administration | 0 (0.0%) | 3 (100.0%) |
| Total (Category) | 0 (0.0%) | 3 (100.0%) |
| Total (Overall) | 12 (41.4%) | 17 (58.6%) |
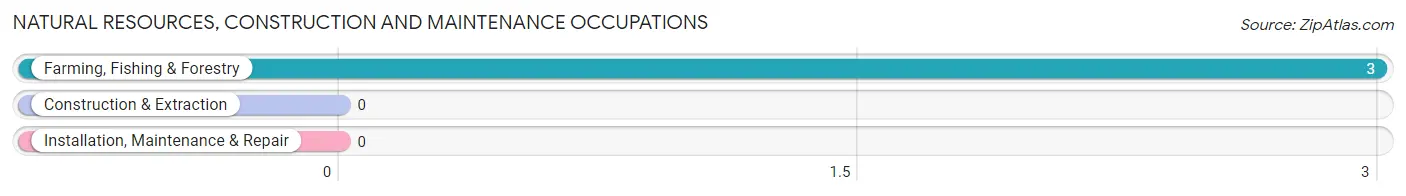
Natural Resources, Construction and Maintenance Occupations
The most common Natural Resources, Construction and Maintenance occupations in Queets are , and Farming, Fishing & Forestry (3 | 10.3%).
Natural Resources, Construction and Maintenance Occupations by Sex
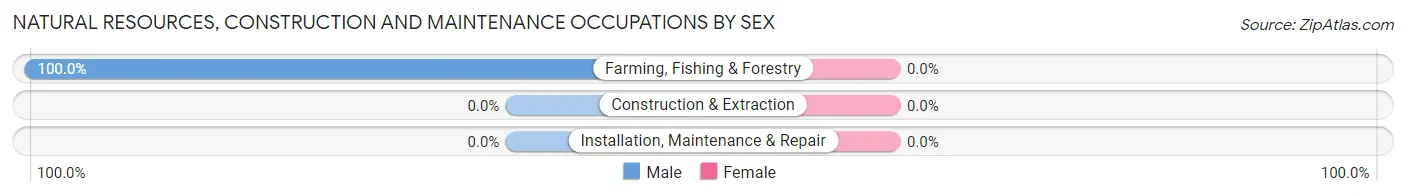
| Occupation | Male | Female |
| Farming, Fishing & Forestry | 3 (100.0%) | 0 (0.0%) |
| Construction & Extraction | 0 (0.0%) | 0 (0.0%) |
| Installation, Maintenance & Repair | 0 (0.0%) | 0 (0.0%) |
| Total (Category) | 3 (100.0%) | 0 (0.0%) |
| Total (Overall) | 12 (41.4%) | 17 (58.6%) |
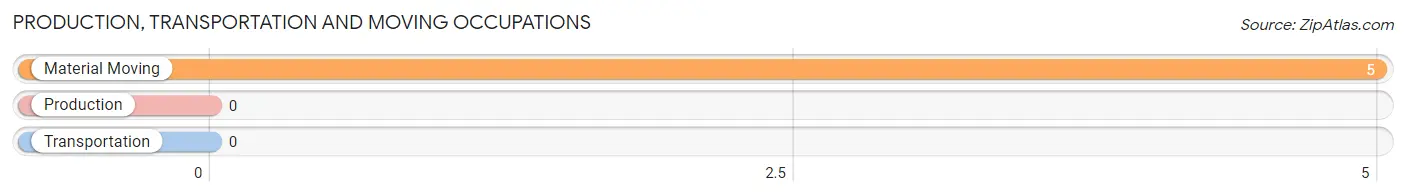
Production, Transportation and Moving Occupations
The most common Production, Transportation and Moving occupations in Queets are , and Material Moving (5 | 17.2%).
Production, Transportation and Moving Occupations by Sex
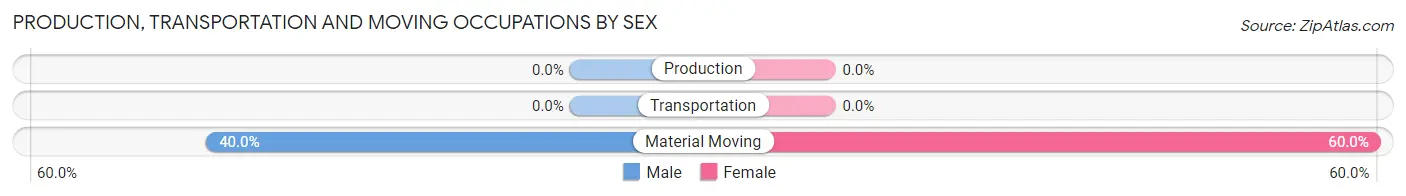
| Occupation | Male | Female |
| Production | 0 (0.0%) | 0 (0.0%) |
| Transportation | 0 (0.0%) | 0 (0.0%) |
| Material Moving | 2 (40.0%) | 3 (60.0%) |
| Total (Category) | 2 (40.0%) | 3 (60.0%) |
| Total (Overall) | 12 (41.4%) | 17 (58.6%) |
Employment Industries by Sex in Queets
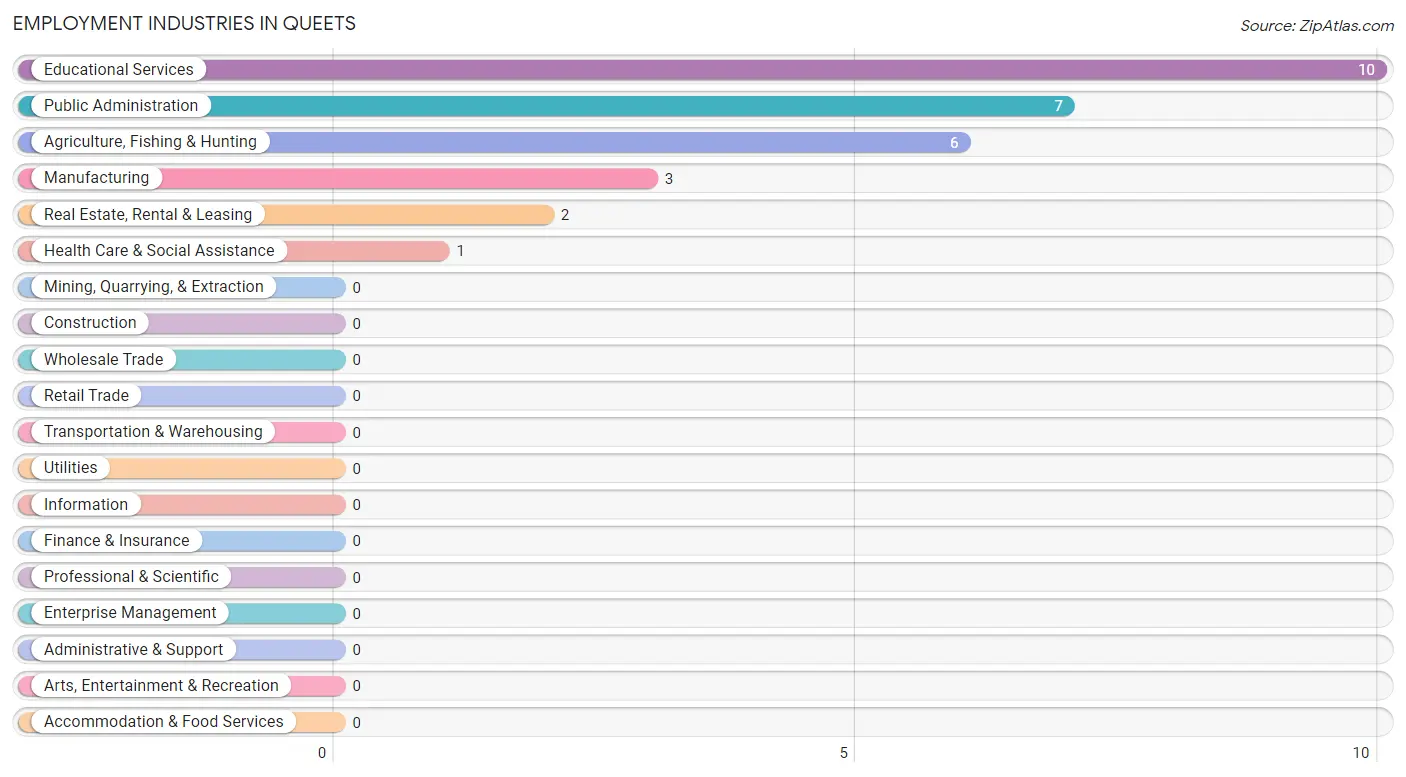
Employment Industries in Queets
The major employment industries in Queets include Educational Services (10 | 34.5%), Public Administration (7 | 24.1%), Agriculture, Fishing & Hunting (6 | 20.7%), Manufacturing (3 | 10.3%), and Real Estate, Rental & Leasing (2 | 6.9%).
Employment Industries by Sex in Queets
The Queets industries that see more men than women are Real Estate, Rental & Leasing (100.0%), Agriculture, Fishing & Hunting (83.3%), and Educational Services (30.0%), whereas the industries that tend to have a higher number of women are Manufacturing (100.0%), Health Care & Social Assistance (100.0%), and Public Administration (71.4%).
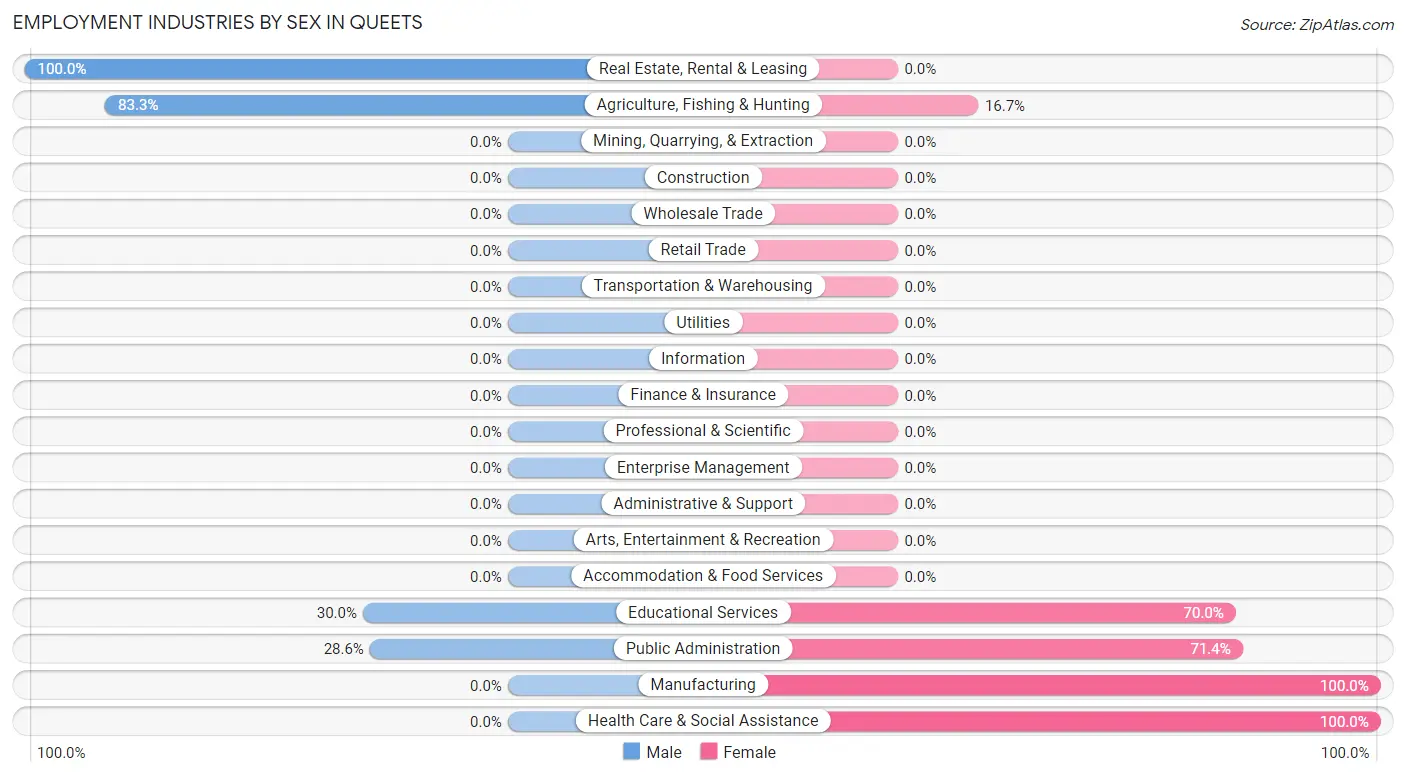
| Industry | Male | Female |
| Agriculture, Fishing & Hunting | 5 (83.3%) | 1 (16.7%) |
| Mining, Quarrying, & Extraction | 0 (0.0%) | 0 (0.0%) |
| Construction | 0 (0.0%) | 0 (0.0%) |
| Manufacturing | 0 (0.0%) | 3 (100.0%) |
| Wholesale Trade | 0 (0.0%) | 0 (0.0%) |
| Retail Trade | 0 (0.0%) | 0 (0.0%) |
| Transportation & Warehousing | 0 (0.0%) | 0 (0.0%) |
| Utilities | 0 (0.0%) | 0 (0.0%) |
| Information | 0 (0.0%) | 0 (0.0%) |
| Finance & Insurance | 0 (0.0%) | 0 (0.0%) |
| Real Estate, Rental & Leasing | 2 (100.0%) | 0 (0.0%) |
| Professional & Scientific | 0 (0.0%) | 0 (0.0%) |
| Enterprise Management | 0 (0.0%) | 0 (0.0%) |
| Administrative & Support | 0 (0.0%) | 0 (0.0%) |
| Educational Services | 3 (30.0%) | 7 (70.0%) |
| Health Care & Social Assistance | 0 (0.0%) | 1 (100.0%) |
| Arts, Entertainment & Recreation | 0 (0.0%) | 0 (0.0%) |
| Accommodation & Food Services | 0 (0.0%) | 0 (0.0%) |
| Public Administration | 2 (28.6%) | 5 (71.4%) |
| Total | 12 (41.4%) | 17 (58.6%) |
Education in Queets
School Enrollment in Queets
The most common levels of schooling among the 36 students in Queets are elementary school (16 | 44.4%), nursery / preschool (6 | 16.7%), and kindergarten (4 | 11.1%).
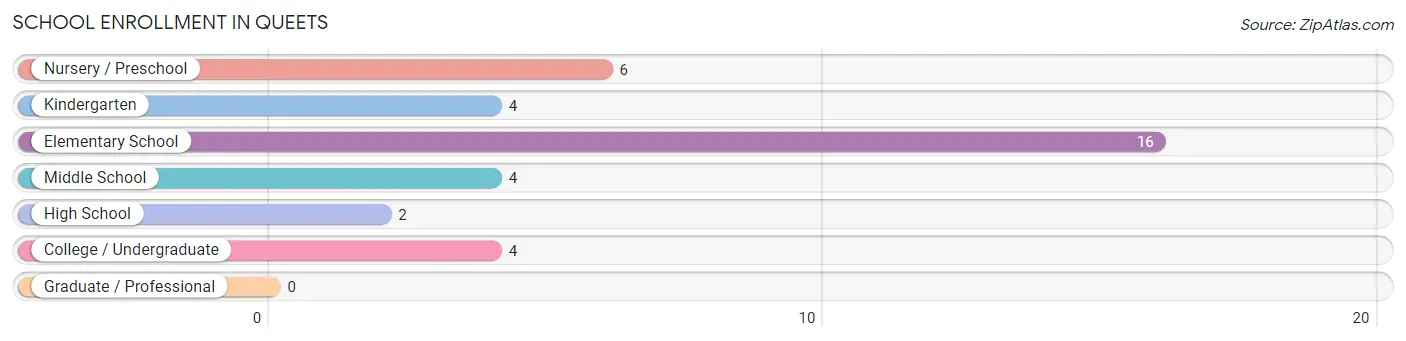
| School Level | # Students | % Students |
| Nursery / Preschool | 6 | 16.7% |
| Kindergarten | 4 | 11.1% |
| Elementary School | 16 | 44.4% |
| Middle School | 4 | 11.1% |
| High School | 2 | 5.6% |
| College / Undergraduate | 4 | 11.1% |
| Graduate / Professional | 0 | 0.0% |
| Total | 36 | 100.0% |
School Enrollment by Age by Funding Source in Queets
Out of a total of 36 students who are enrolled in schools in Queets, 2 (5.6%) attend a private institution, while the remaining 34 (94.4%) are enrolled in public schools. The age group of 3 to 4 year olds has the highest likelihood of being enrolled in private schools, with 2 (50.0% in the age bracket) enrolled. Conversely, the age group of 5 to 9 year old has the lowest likelihood of being enrolled in a private school, with 20 (100.0% in the age bracket) attending a public institution.
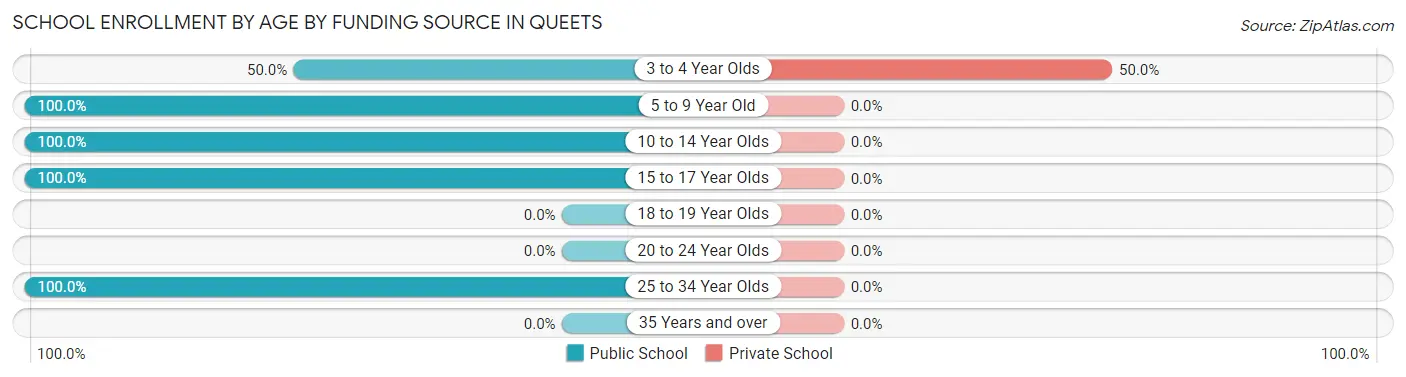
| Age Bracket | Public School | Private School |
| 3 to 4 Year Olds | 2 (50.0%) | 2 (50.0%) |
| 5 to 9 Year Old | 20 (100.0%) | 0 (0.0%) |
| 10 to 14 Year Olds | 6 (100.0%) | 0 (0.0%) |
| 15 to 17 Year Olds | 2 (100.0%) | 0 (0.0%) |
| 18 to 19 Year Olds | 0 (0.0%) | 0 (0.0%) |
| 20 to 24 Year Olds | 0 (0.0%) | 0 (0.0%) |
| 25 to 34 Year Olds | 4 (100.0%) | 0 (0.0%) |
| 35 Years and over | 0 (0.0%) | 0 (0.0%) |
| Total | 34 (94.4%) | 2 (5.6%) |
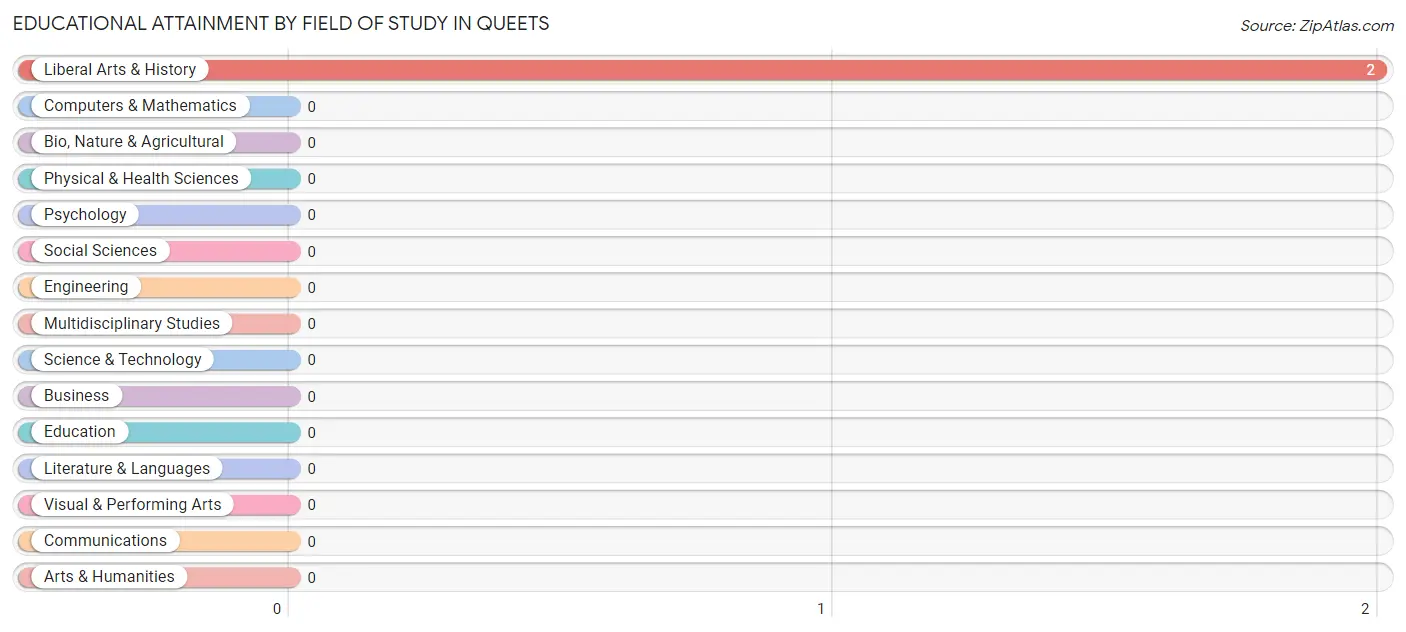
Educational Attainment by Field of Study in Queets
, and liberal arts & history (2 | 100.0%) are the most common fields of study among 2 individuals in Queets who have obtained a bachelor's degree or higher.
| Field of Study | # Graduates | % Graduates |
| Computers & Mathematics | 0 | 0.0% |
| Bio, Nature & Agricultural | 0 | 0.0% |
| Physical & Health Sciences | 0 | 0.0% |
| Psychology | 0 | 0.0% |
| Social Sciences | 0 | 0.0% |
| Engineering | 0 | 0.0% |
| Multidisciplinary Studies | 0 | 0.0% |
| Science & Technology | 0 | 0.0% |
| Business | 0 | 0.0% |
| Education | 0 | 0.0% |
| Literature & Languages | 0 | 0.0% |
| Liberal Arts & History | 2 | 100.0% |
| Visual & Performing Arts | 0 | 0.0% |
| Communications | 0 | 0.0% |
| Arts & Humanities | 0 | 0.0% |
| Total | 2 | 100.0% |
Transportation & Commute in Queets
Vehicle Availability by Sex in Queets
The most prevalent vehicle ownership categories in Queets are males with 2 vehicles (4, accounting for 40.0%) and females with 2 vehicles (7, making up 28.6%).
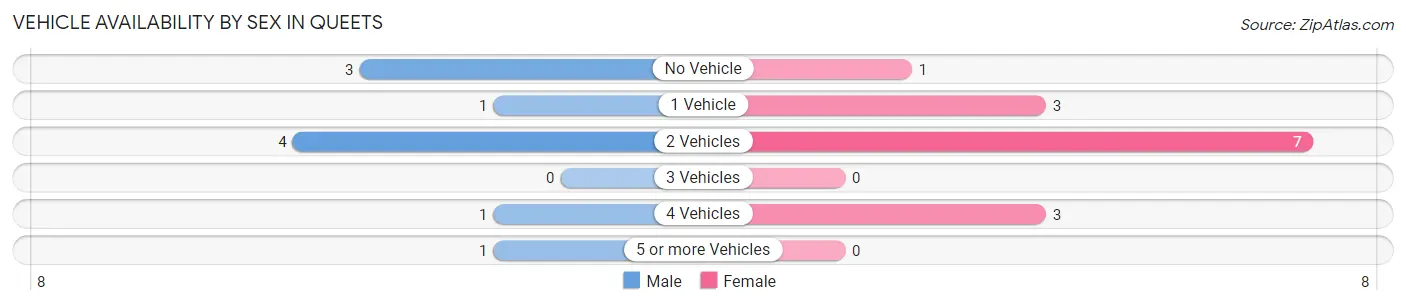
| Vehicles Available | Male | Female |
| No Vehicle | 3 (30.0%) | 1 (7.1%) |
| 1 Vehicle | 1 (10.0%) | 3 (21.4%) |
| 2 Vehicles | 4 (40.0%) | 7 (50.0%) |
| 3 Vehicles | 0 (0.0%) | 0 (0.0%) |
| 4 Vehicles | 1 (10.0%) | 3 (21.4%) |
| 5 or more Vehicles | 1 (10.0%) | 0 (0.0%) |
| Total | 10 (100.0%) | 14 (100.0%) |
Commute Time in Queets
The most frequently occuring commute durations in Queets are less than 5 minutes (13 commuters, 54.2%), 15 to 19 minutes (3 commuters, 12.5%), and 5 to 9 minutes (2 commuters, 8.3%).
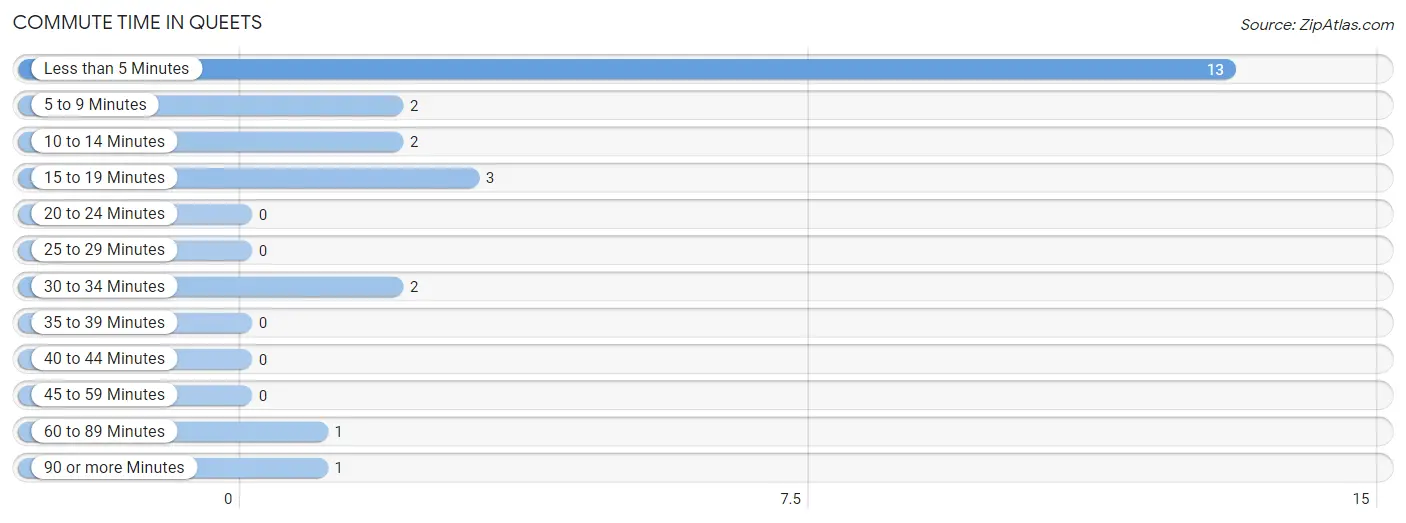
| Commute Time | # Commuters | % Commuters |
| Less than 5 Minutes | 13 | 54.2% |
| 5 to 9 Minutes | 2 | 8.3% |
| 10 to 14 Minutes | 2 | 8.3% |
| 15 to 19 Minutes | 3 | 12.5% |
| 20 to 24 Minutes | 0 | 0.0% |
| 25 to 29 Minutes | 0 | 0.0% |
| 30 to 34 Minutes | 2 | 8.3% |
| 35 to 39 Minutes | 0 | 0.0% |
| 40 to 44 Minutes | 0 | 0.0% |
| 45 to 59 Minutes | 0 | 0.0% |
| 60 to 89 Minutes | 1 | 4.2% |
| 90 or more Minutes | 1 | 4.2% |
Commute Time by Sex in Queets
The most common commute times in Queets are less than 5 minutes (4 commuters, 40.0%) for males and less than 5 minutes (9 commuters, 64.3%) for females.
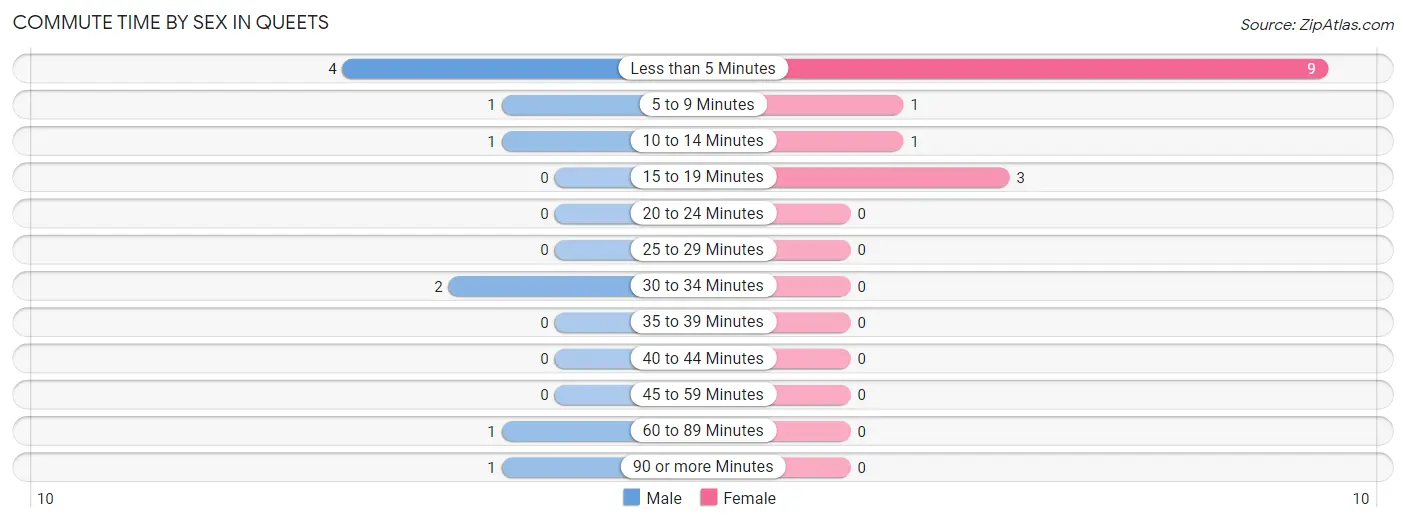
| Commute Time | Male | Female |
| Less than 5 Minutes | 4 (40.0%) | 9 (64.3%) |
| 5 to 9 Minutes | 1 (10.0%) | 1 (7.1%) |
| 10 to 14 Minutes | 1 (10.0%) | 1 (7.1%) |
| 15 to 19 Minutes | 0 (0.0%) | 3 (21.4%) |
| 20 to 24 Minutes | 0 (0.0%) | 0 (0.0%) |
| 25 to 29 Minutes | 0 (0.0%) | 0 (0.0%) |
| 30 to 34 Minutes | 2 (20.0%) | 0 (0.0%) |
| 35 to 39 Minutes | 0 (0.0%) | 0 (0.0%) |
| 40 to 44 Minutes | 0 (0.0%) | 0 (0.0%) |
| 45 to 59 Minutes | 0 (0.0%) | 0 (0.0%) |
| 60 to 89 Minutes | 1 (10.0%) | 0 (0.0%) |
| 90 or more Minutes | 1 (10.0%) | 0 (0.0%) |
Time of Departure to Work by Sex in Queets
The most frequent times of departure to work in Queets are 5:30 AM to 5:59 AM (3, 30.0%) for males and 12:00 PM to 3:59 PM (4, 28.6%) for females.
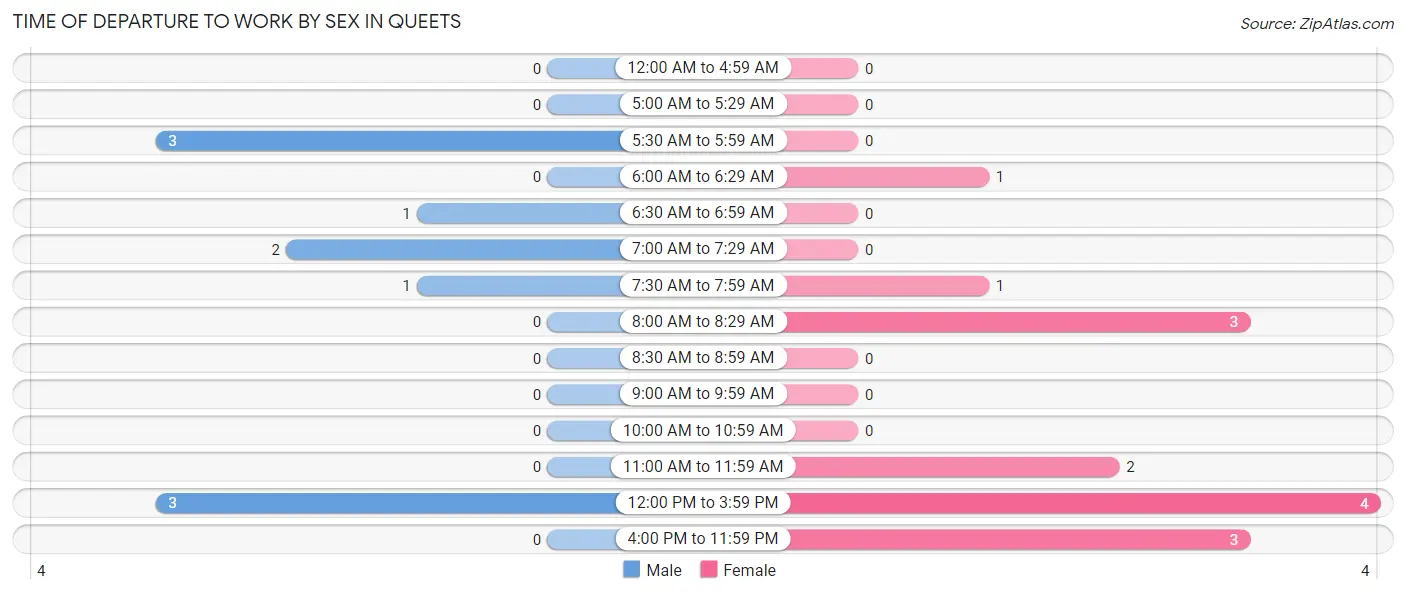
| Time of Departure | Male | Female |
| 12:00 AM to 4:59 AM | 0 (0.0%) | 0 (0.0%) |
| 5:00 AM to 5:29 AM | 0 (0.0%) | 0 (0.0%) |
| 5:30 AM to 5:59 AM | 3 (30.0%) | 0 (0.0%) |
| 6:00 AM to 6:29 AM | 0 (0.0%) | 1 (7.1%) |
| 6:30 AM to 6:59 AM | 1 (10.0%) | 0 (0.0%) |
| 7:00 AM to 7:29 AM | 2 (20.0%) | 0 (0.0%) |
| 7:30 AM to 7:59 AM | 1 (10.0%) | 1 (7.1%) |
| 8:00 AM to 8:29 AM | 0 (0.0%) | 3 (21.4%) |
| 8:30 AM to 8:59 AM | 0 (0.0%) | 0 (0.0%) |
| 9:00 AM to 9:59 AM | 0 (0.0%) | 0 (0.0%) |
| 10:00 AM to 10:59 AM | 0 (0.0%) | 0 (0.0%) |
| 11:00 AM to 11:59 AM | 0 (0.0%) | 2 (14.3%) |
| 12:00 PM to 3:59 PM | 3 (30.0%) | 4 (28.6%) |
| 4:00 PM to 11:59 PM | 0 (0.0%) | 3 (21.4%) |
| Total | 10 (100.0%) | 14 (100.0%) |
Housing Occupancy in Queets
Occupancy by Ownership in Queets
Of the total 31 dwellings in Queets, owner-occupied units account for 19 (61.3%), while renter-occupied units make up 12 (38.7%).
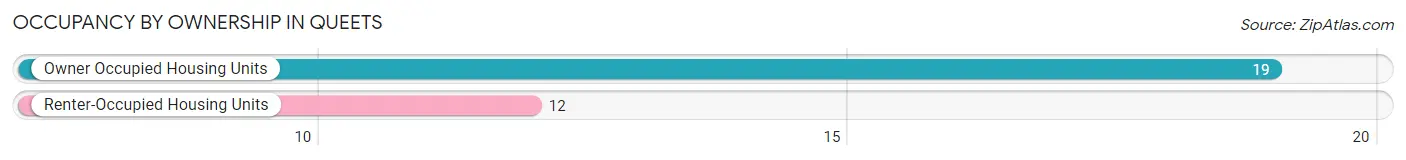
| Occupancy | # Housing Units | % Housing Units |
| Owner Occupied Housing Units | 19 | 61.3% |
| Renter-Occupied Housing Units | 12 | 38.7% |
| Total Occupied Housing Units | 31 | 100.0% |
Occupancy by Household Size in Queets
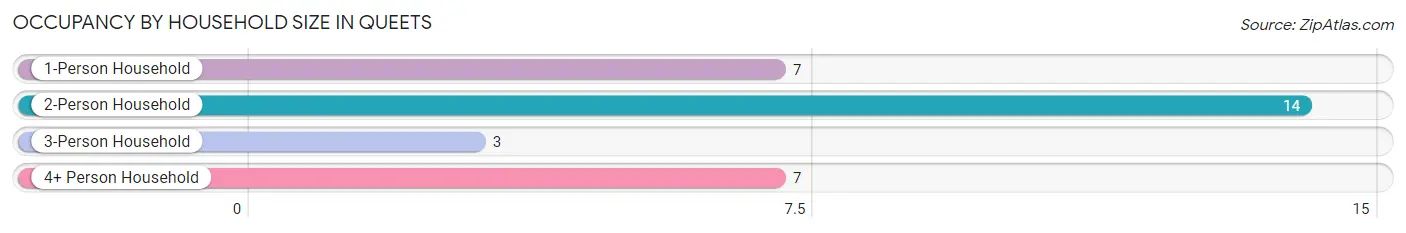
| Household Size | # Housing Units | % Housing Units |
| 1-Person Household | 7 | 22.6% |
| 2-Person Household | 14 | 45.2% |
| 3-Person Household | 3 | 9.7% |
| 4+ Person Household | 7 | 22.6% |
| Total Housing Units | 31 | 100.0% |
Occupancy by Ownership by Household Size in Queets
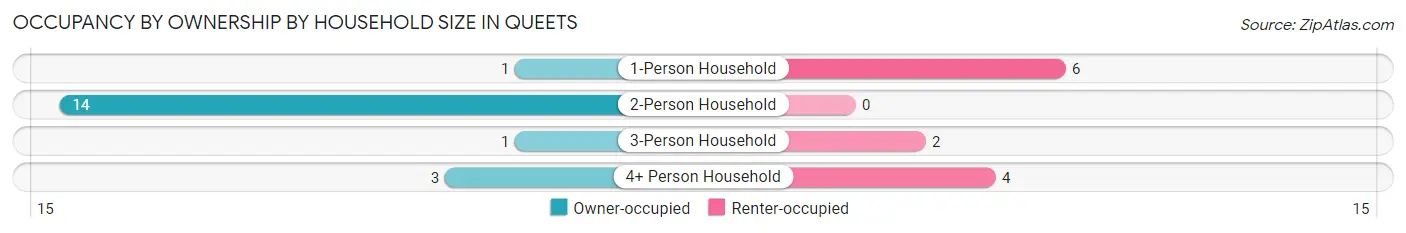
| Household Size | Owner-occupied | Renter-occupied |
| 1-Person Household | 1 (14.3%) | 6 (85.7%) |
| 2-Person Household | 14 (100.0%) | 0 (0.0%) |
| 3-Person Household | 1 (33.3%) | 2 (66.7%) |
| 4+ Person Household | 3 (42.9%) | 4 (57.1%) |
| Total Housing Units | 19 (61.3%) | 12 (38.7%) |
Occupancy by Educational Attainment in Queets
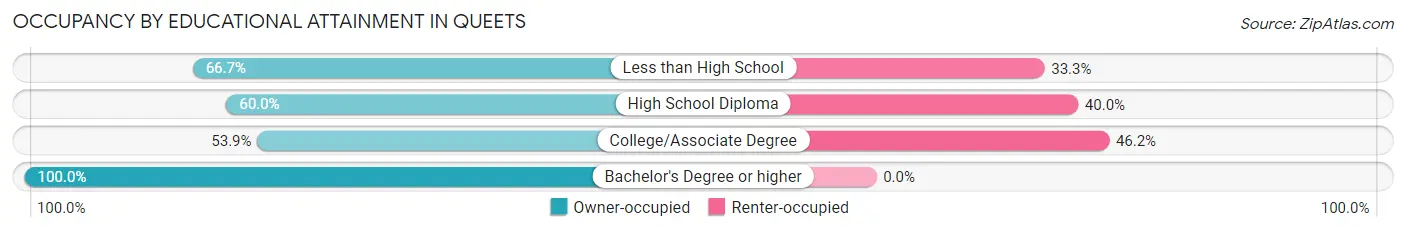
| Household Size | Owner-occupied | Renter-occupied |
| Less than High School | 4 (66.7%) | 2 (33.3%) |
| High School Diploma | 6 (60.0%) | 4 (40.0%) |
| College/Associate Degree | 7 (53.8%) | 6 (46.2%) |
| Bachelor's Degree or higher | 2 (100.0%) | 0 (0.0%) |
Occupancy by Age of Householder in Queets
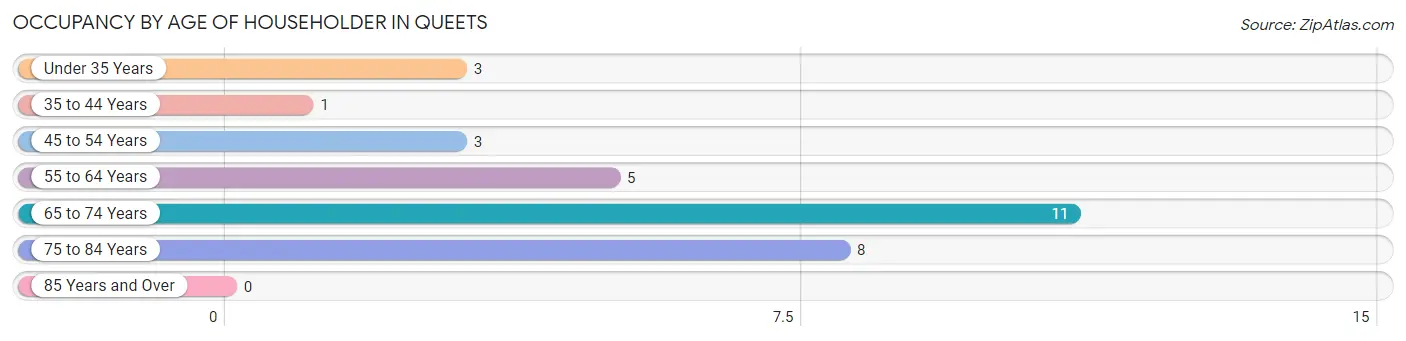
| Age Bracket | # Households | % Households |
| Under 35 Years | 3 | 9.7% |
| 35 to 44 Years | 1 | 3.2% |
| 45 to 54 Years | 3 | 9.7% |
| 55 to 64 Years | 5 | 16.1% |
| 65 to 74 Years | 11 | 35.5% |
| 75 to 84 Years | 8 | 25.8% |
| 85 Years and Over | 0 | 0.0% |
| Total | 31 | 100.0% |
Housing Finances in Queets
Median Income by Occupancy in Queets
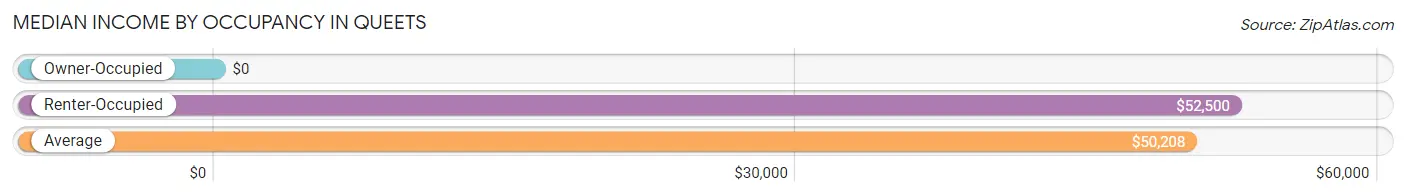
| Occupancy Type | # Households | Median Income |
| Owner-Occupied | 19 (61.3%) | $0 |
| Renter-Occupied | 12 (38.7%) | $52,500 |
| Average | 31 (100.0%) | $50,208 |
Occupancy by Householder Income Bracket in Queets
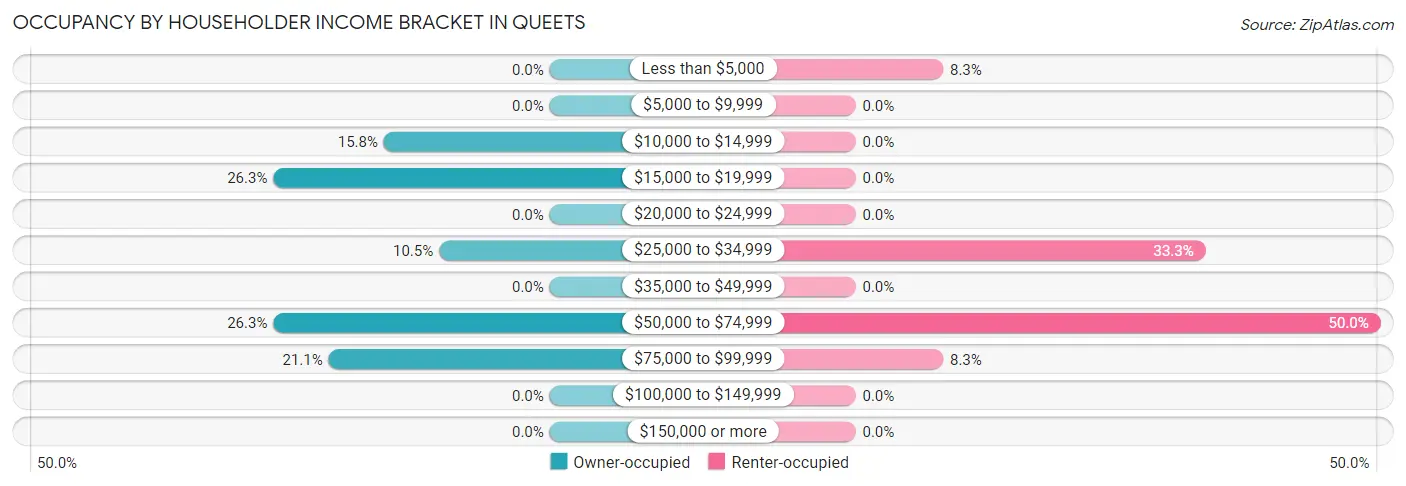
| Income Bracket | Owner-occupied | Renter-occupied |
| Less than $5,000 | 0 (0.0%) | 1 (8.3%) |
| $5,000 to $9,999 | 0 (0.0%) | 0 (0.0%) |
| $10,000 to $14,999 | 3 (15.8%) | 0 (0.0%) |
| $15,000 to $19,999 | 5 (26.3%) | 0 (0.0%) |
| $20,000 to $24,999 | 0 (0.0%) | 0 (0.0%) |
| $25,000 to $34,999 | 2 (10.5%) | 4 (33.3%) |
| $35,000 to $49,999 | 0 (0.0%) | 0 (0.0%) |
| $50,000 to $74,999 | 5 (26.3%) | 6 (50.0%) |
| $75,000 to $99,999 | 4 (21.0%) | 1 (8.3%) |
| $100,000 to $149,999 | 0 (0.0%) | 0 (0.0%) |
| $150,000 or more | 0 (0.0%) | 0 (0.0%) |
| Total | 19 (100.0%) | 12 (100.0%) |
Monthly Housing Cost Tiers in Queets
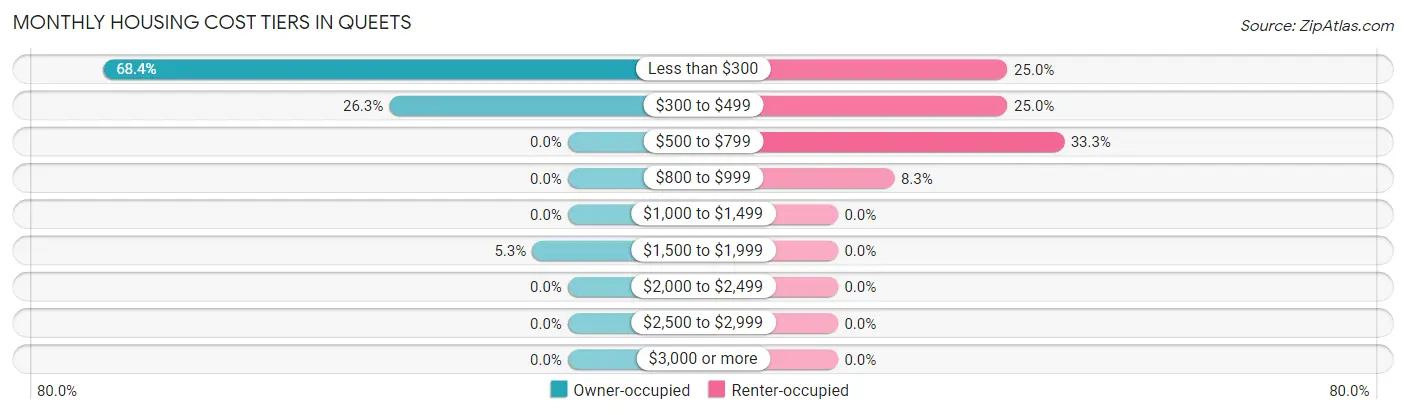
| Monthly Cost | Owner-occupied | Renter-occupied |
| Less than $300 | 13 (68.4%) | 3 (25.0%) |
| $300 to $499 | 5 (26.3%) | 3 (25.0%) |
| $500 to $799 | 0 (0.0%) | 4 (33.3%) |
| $800 to $999 | 0 (0.0%) | 1 (8.3%) |
| $1,000 to $1,499 | 0 (0.0%) | 0 (0.0%) |
| $1,500 to $1,999 | 1 (5.3%) | 0 (0.0%) |
| $2,000 to $2,499 | 0 (0.0%) | 0 (0.0%) |
| $2,500 to $2,999 | 0 (0.0%) | 0 (0.0%) |
| $3,000 or more | 0 (0.0%) | 0 (0.0%) |
| Total | 19 (100.0%) | 12 (100.0%) |
Physical Housing Characteristics in Queets
Housing Structures in Queets
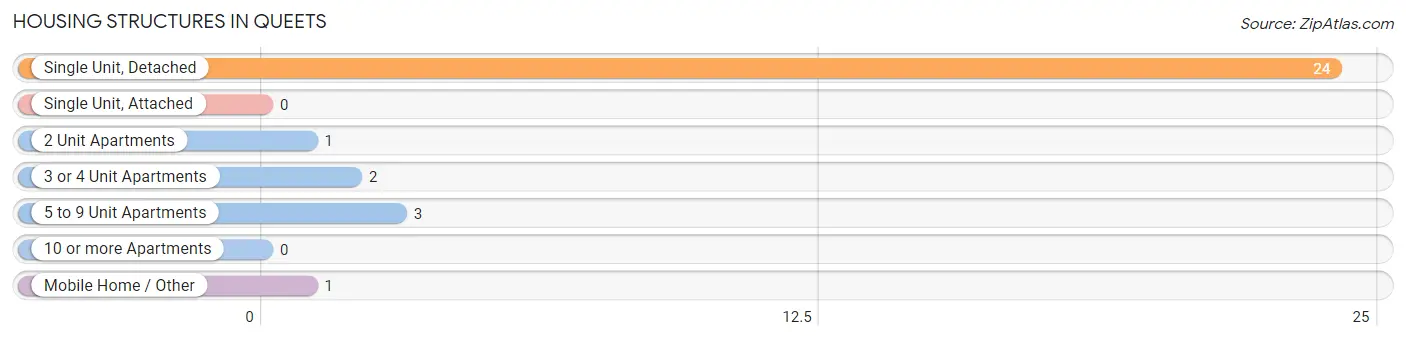
| Structure Type | # Housing Units | % Housing Units |
| Single Unit, Detached | 24 | 77.4% |
| Single Unit, Attached | 0 | 0.0% |
| 2 Unit Apartments | 1 | 3.2% |
| 3 or 4 Unit Apartments | 2 | 6.5% |
| 5 to 9 Unit Apartments | 3 | 9.7% |
| 10 or more Apartments | 0 | 0.0% |
| Mobile Home / Other | 1 | 3.2% |
| Total | 31 | 100.0% |
Housing Structures by Occupancy in Queets
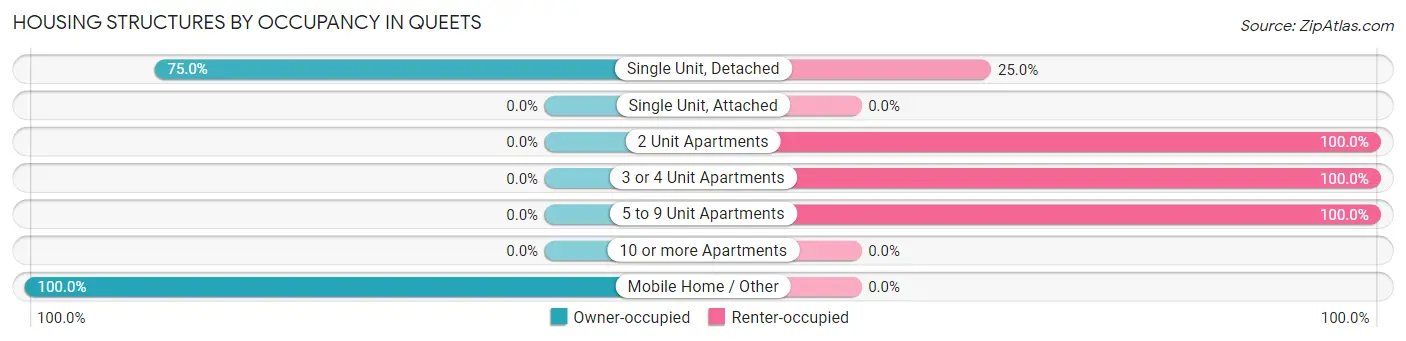
| Structure Type | Owner-occupied | Renter-occupied |
| Single Unit, Detached | 18 (75.0%) | 6 (25.0%) |
| Single Unit, Attached | 0 (0.0%) | 0 (0.0%) |
| 2 Unit Apartments | 0 (0.0%) | 1 (100.0%) |
| 3 or 4 Unit Apartments | 0 (0.0%) | 2 (100.0%) |
| 5 to 9 Unit Apartments | 0 (0.0%) | 3 (100.0%) |
| 10 or more Apartments | 0 (0.0%) | 0 (0.0%) |
| Mobile Home / Other | 1 (100.0%) | 0 (0.0%) |
| Total | 19 (61.3%) | 12 (38.7%) |
Housing Structures by Number of Rooms in Queets
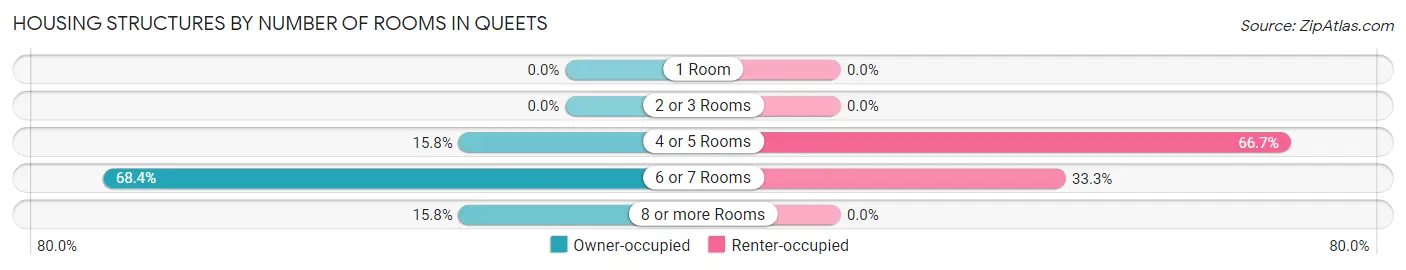
| Number of Rooms | Owner-occupied | Renter-occupied |
| 1 Room | 0 (0.0%) | 0 (0.0%) |
| 2 or 3 Rooms | 0 (0.0%) | 0 (0.0%) |
| 4 or 5 Rooms | 3 (15.8%) | 8 (66.7%) |
| 6 or 7 Rooms | 13 (68.4%) | 4 (33.3%) |
| 8 or more Rooms | 3 (15.8%) | 0 (0.0%) |
| Total | 19 (100.0%) | 12 (100.0%) |
Housing Structure by Heating Type in Queets
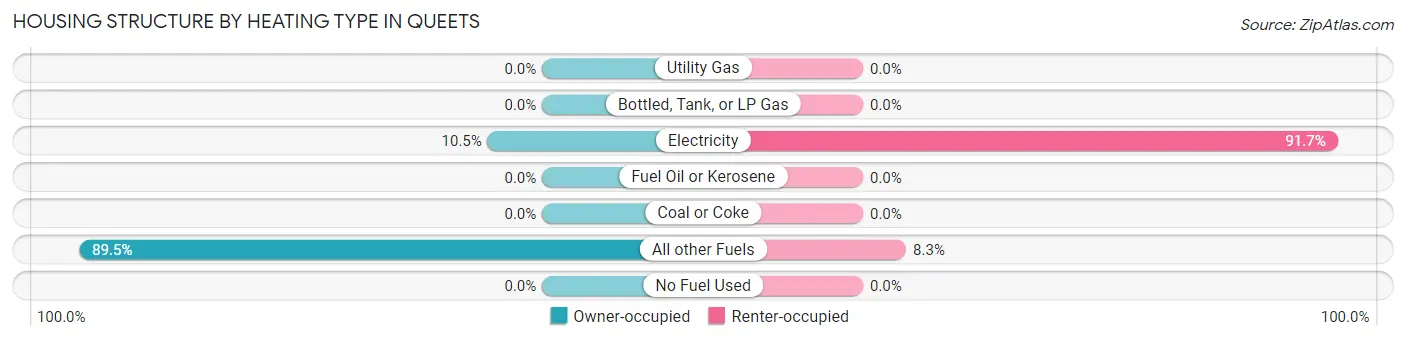
| Heating Type | Owner-occupied | Renter-occupied |
| Utility Gas | 0 (0.0%) | 0 (0.0%) |
| Bottled, Tank, or LP Gas | 0 (0.0%) | 0 (0.0%) |
| Electricity | 2 (10.5%) | 11 (91.7%) |
| Fuel Oil or Kerosene | 0 (0.0%) | 0 (0.0%) |
| Coal or Coke | 0 (0.0%) | 0 (0.0%) |
| All other Fuels | 17 (89.5%) | 1 (8.3%) |
| No Fuel Used | 0 (0.0%) | 0 (0.0%) |
| Total | 19 (100.0%) | 12 (100.0%) |
Household Vehicle Usage in Queets
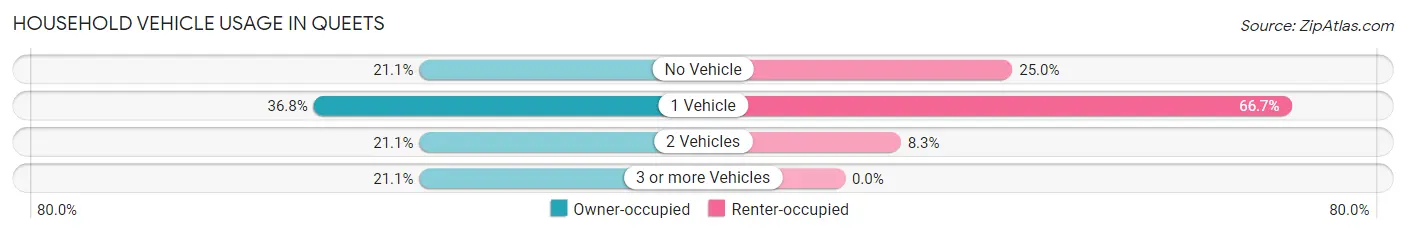
| Vehicles per Household | Owner-occupied | Renter-occupied |
| No Vehicle | 4 (21.0%) | 3 (25.0%) |
| 1 Vehicle | 7 (36.8%) | 8 (66.7%) |
| 2 Vehicles | 4 (21.0%) | 1 (8.3%) |
| 3 or more Vehicles | 4 (21.0%) | 0 (0.0%) |
| Total | 19 (100.0%) | 12 (100.0%) |
Real Estate & Mortgages in Queets
Real Estate and Mortgage Overview in Queets
| Characteristic | Without Mortgage | With Mortgage |
| Housing Units | 18 | 1 |
| Median Property Value | $83,800 | $0 |
| Median Household Income | - | - |
| Monthly Housing Costs | $213 | $0 |
| Real Estate Taxes | - | - |
Property Value by Mortgage Status in Queets
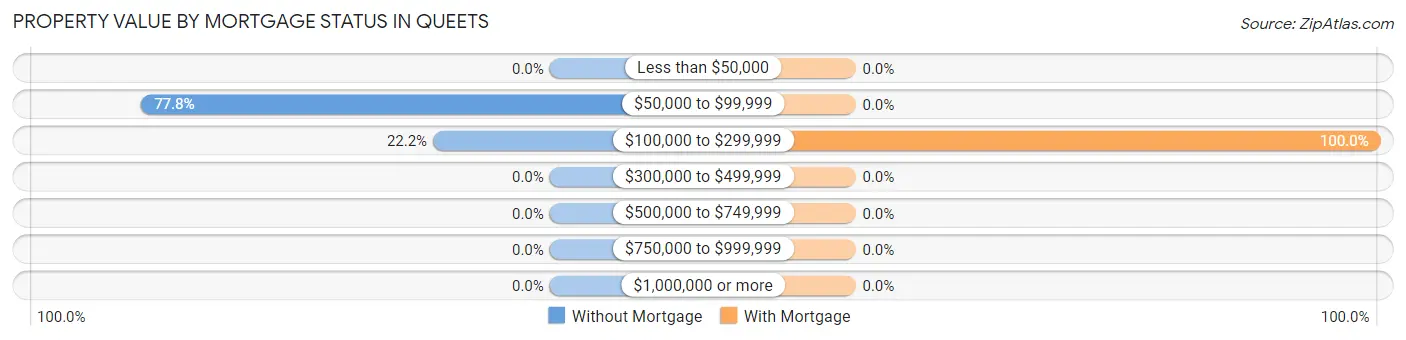
| Property Value | Without Mortgage | With Mortgage |
| Less than $50,000 | 0 (0.0%) | 0 (0.0%) |
| $50,000 to $99,999 | 14 (77.8%) | 0 (0.0%) |
| $100,000 to $299,999 | 4 (22.2%) | 1 (100.0%) |
| $300,000 to $499,999 | 0 (0.0%) | 0 (0.0%) |
| $500,000 to $749,999 | 0 (0.0%) | 0 (0.0%) |
| $750,000 to $999,999 | 0 (0.0%) | 0 (0.0%) |
| $1,000,000 or more | 0 (0.0%) | 0 (0.0%) |
| Total | 18 (100.0%) | 1 (100.0%) |
Household Income by Mortgage Status in Queets
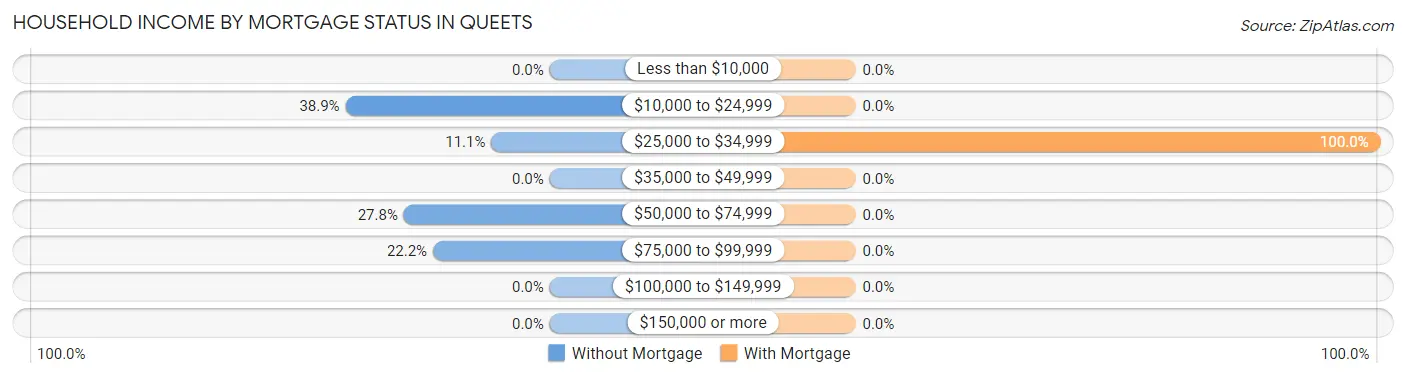
| Household Income | Without Mortgage | With Mortgage |
| Less than $10,000 | 0 (0.0%) | 0 (0.0%) |
| $10,000 to $24,999 | 7 (38.9%) | 0 (0.0%) |
| $25,000 to $34,999 | 2 (11.1%) | 1 (100.0%) |
| $35,000 to $49,999 | 0 (0.0%) | 0 (0.0%) |
| $50,000 to $74,999 | 5 (27.8%) | 0 (0.0%) |
| $75,000 to $99,999 | 4 (22.2%) | 0 (0.0%) |
| $100,000 to $149,999 | 0 (0.0%) | 0 (0.0%) |
| $150,000 or more | 0 (0.0%) | 0 (0.0%) |
| Total | 18 (100.0%) | 1 (100.0%) |
Property Value to Household Income Ratio in Queets
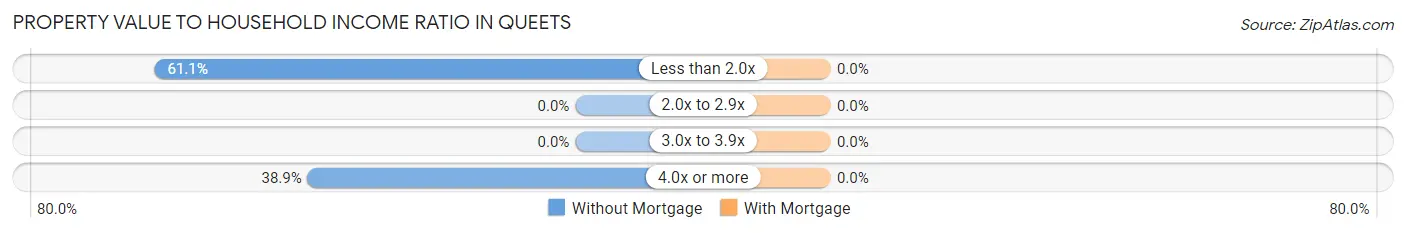
| Value-to-Income Ratio | Without Mortgage | With Mortgage |
| Less than 2.0x | 11 (61.1%) | 0 (0.0%) |
| 2.0x to 2.9x | 0 (0.0%) | 0 (0.0%) |
| 3.0x to 3.9x | 0 (0.0%) | 0 (0.0%) |
| 4.0x or more | 7 (38.9%) | 0 (0.0%) |
| Total | 18 (100.0%) | 1 (100.0%) |
Real Estate Taxes by Mortgage Status in Queets
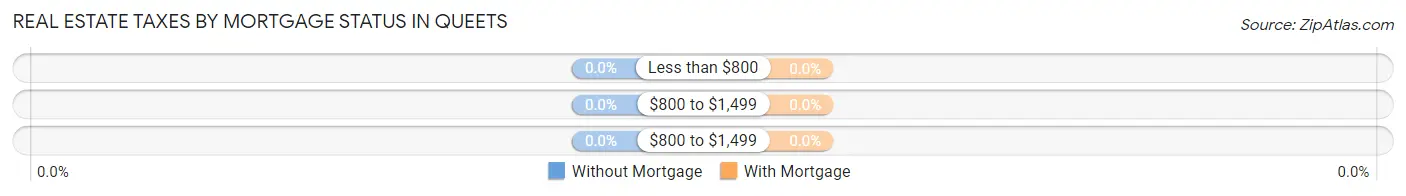
| Property Taxes | Without Mortgage | With Mortgage |
| Less than $800 | 0 (0.0%) | 0 (0.0%) |
| $800 to $1,499 | 0 (0.0%) | 0 (0.0%) |
| $800 to $1,499 | 0 (0.0%) | 0 (0.0%) |
| Total | 18 (100.0%) | 1 (100.0%) |
Health & Disability in Queets
Health Insurance Coverage by Age in Queets
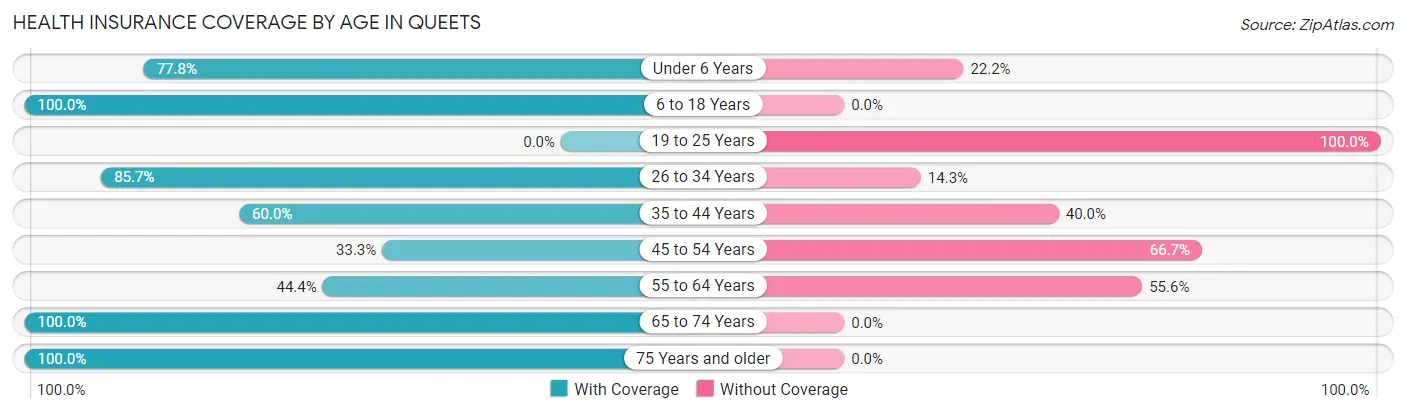
| Age Bracket | With Coverage | Without Coverage |
| Under 6 Years | 14 (77.8%) | 4 (22.2%) |
| 6 to 18 Years | 22 (100.0%) | 0 (0.0%) |
| 19 to 25 Years | 0 (0.0%) | 12 (100.0%) |
| 26 to 34 Years | 12 (85.7%) | 2 (14.3%) |
| 35 to 44 Years | 3 (60.0%) | 2 (40.0%) |
| 45 to 54 Years | 4 (33.3%) | 8 (66.7%) |
| 55 to 64 Years | 4 (44.4%) | 5 (55.6%) |
| 65 to 74 Years | 11 (100.0%) | 0 (0.0%) |
| 75 Years and older | 11 (100.0%) | 0 (0.0%) |
| Total | 81 (71.1%) | 33 (28.9%) |
Health Insurance Coverage by Citizenship Status in Queets
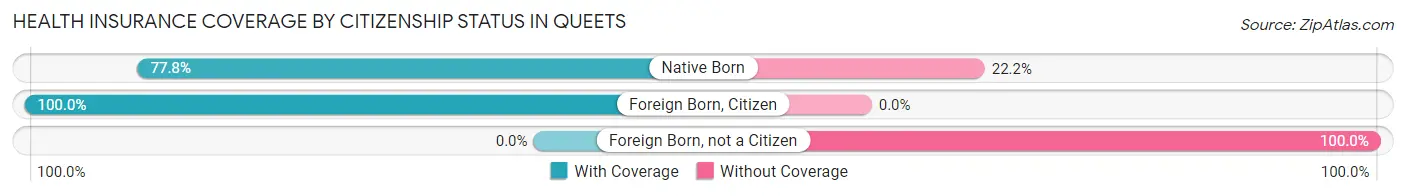
| Citizenship Status | With Coverage | Without Coverage |
| Native Born | 14 (77.8%) | 4 (22.2%) |
| Foreign Born, Citizen | 22 (100.0%) | 0 (0.0%) |
| Foreign Born, not a Citizen | 0 (0.0%) | 12 (100.0%) |
Health Insurance Coverage by Household Income in Queets
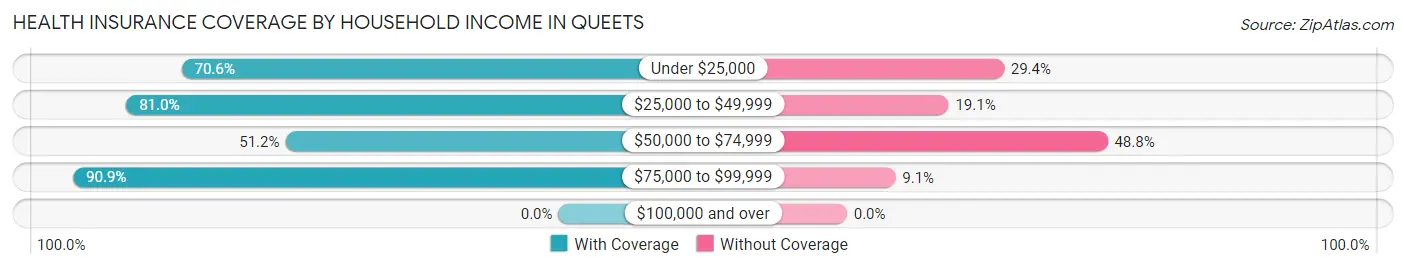
| Household Income | With Coverage | Without Coverage |
| Under $25,000 | 12 (70.6%) | 5 (29.4%) |
| $25,000 to $49,999 | 17 (80.9%) | 4 (19.1%) |
| $50,000 to $74,999 | 22 (51.2%) | 21 (48.8%) |
| $75,000 to $99,999 | 30 (90.9%) | 3 (9.1%) |
| $100,000 and over | 0 (0.0%) | 0 (0.0%) |
Public vs Private Health Insurance Coverage by Age in Queets
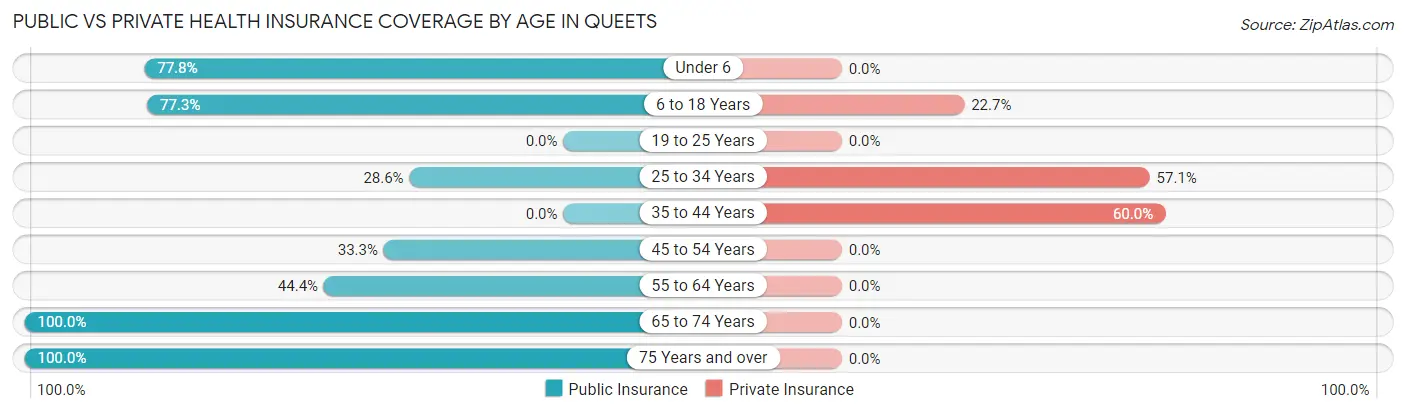
| Age Bracket | Public Insurance | Private Insurance |
| Under 6 | 14 (77.8%) | 0 (0.0%) |
| 6 to 18 Years | 17 (77.3%) | 5 (22.7%) |
| 19 to 25 Years | 0 (0.0%) | 0 (0.0%) |
| 25 to 34 Years | 4 (28.6%) | 8 (57.1%) |
| 35 to 44 Years | 0 (0.0%) | 3 (60.0%) |
| 45 to 54 Years | 4 (33.3%) | 0 (0.0%) |
| 55 to 64 Years | 4 (44.4%) | 0 (0.0%) |
| 65 to 74 Years | 11 (100.0%) | 0 (0.0%) |
| 75 Years and over | 11 (100.0%) | 0 (0.0%) |
| Total | 65 (57.0%) | 16 (14.0%) |
Disability Status by Sex by Age in Queets
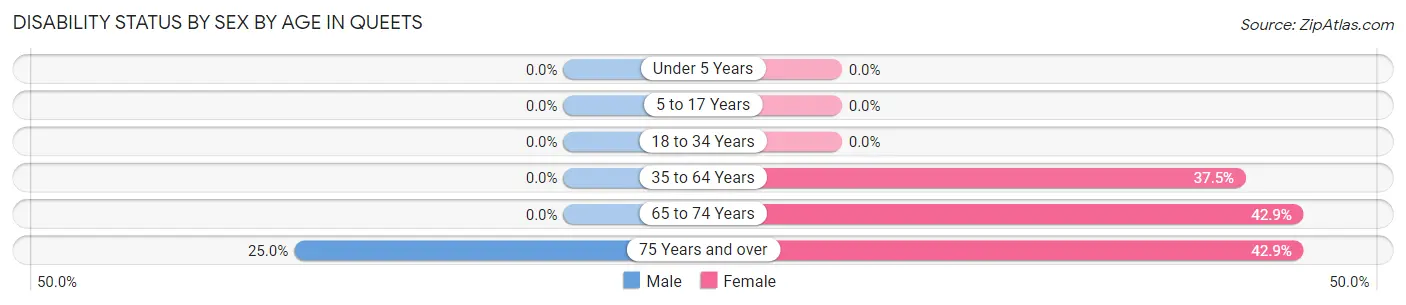
| Age Bracket | Male | Female |
| Under 5 Years | 0 (0.0%) | 0 (0.0%) |
| 5 to 17 Years | 0 (0.0%) | 0 (0.0%) |
| 18 to 34 Years | 0 (0.0%) | 0 (0.0%) |
| 35 to 64 Years | 0 (0.0%) | 6 (37.5%) |
| 65 to 74 Years | 0 (0.0%) | 3 (42.9%) |
| 75 Years and over | 1 (25.0%) | 3 (42.9%) |
Disability Class by Sex by Age in Queets
Disability Class: Hearing Difficulty
| Age Bracket | Male | Female |
| Under 5 Years | 0 (0.0%) | 0 (0.0%) |
| 5 to 17 Years | 0 (0.0%) | 0 (0.0%) |
| 18 to 34 Years | 0 (0.0%) | 0 (0.0%) |
| 35 to 64 Years | 0 (0.0%) | 0 (0.0%) |
| 65 to 74 Years | 0 (0.0%) | 0 (0.0%) |
| 75 Years and over | 0 (0.0%) | 0 (0.0%) |
Disability Class: Vision Difficulty
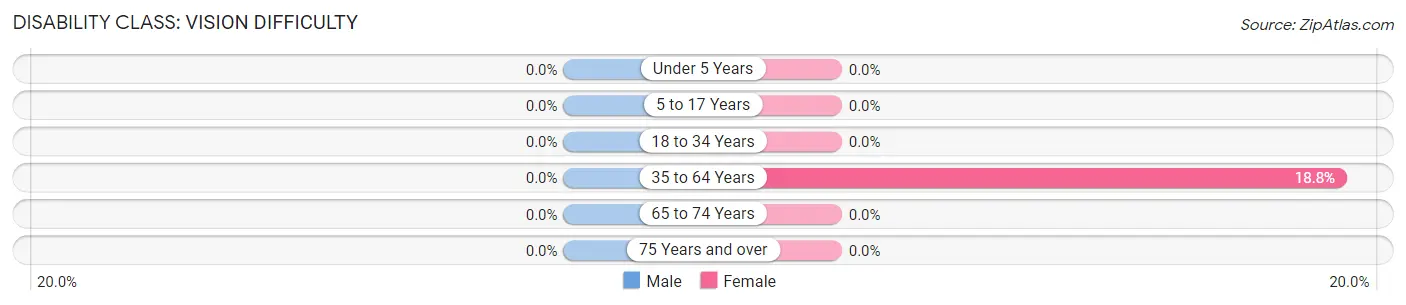
| Age Bracket | Male | Female |
| Under 5 Years | 0 (0.0%) | 0 (0.0%) |
| 5 to 17 Years | 0 (0.0%) | 0 (0.0%) |
| 18 to 34 Years | 0 (0.0%) | 0 (0.0%) |
| 35 to 64 Years | 0 (0.0%) | 3 (18.8%) |
| 65 to 74 Years | 0 (0.0%) | 0 (0.0%) |
| 75 Years and over | 0 (0.0%) | 0 (0.0%) |
Disability Class: Cognitive Difficulty
| Age Bracket | Male | Female |
| 5 to 17 Years | 0 (0.0%) | 0 (0.0%) |
| 18 to 34 Years | 0 (0.0%) | 0 (0.0%) |
| 35 to 64 Years | 0 (0.0%) | 0 (0.0%) |
| 65 to 74 Years | 0 (0.0%) | 0 (0.0%) |
| 75 Years and over | 0 (0.0%) | 0 (0.0%) |
Disability Class: Ambulatory Difficulty
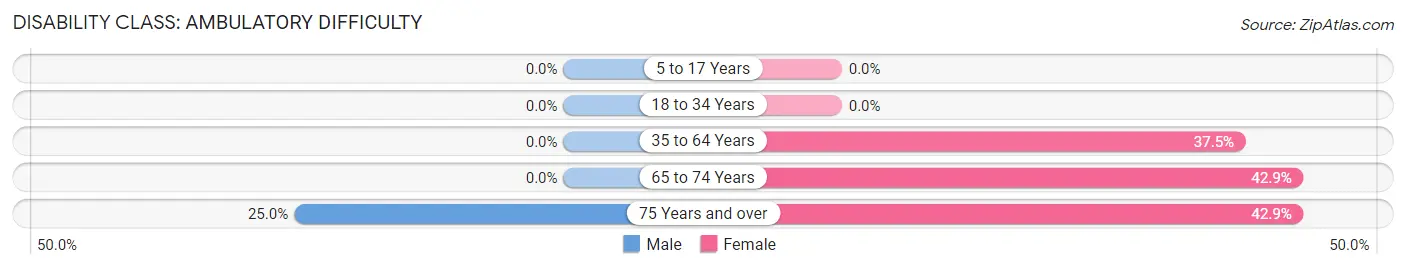
| Age Bracket | Male | Female |
| 5 to 17 Years | 0 (0.0%) | 0 (0.0%) |
| 18 to 34 Years | 0 (0.0%) | 0 (0.0%) |
| 35 to 64 Years | 0 (0.0%) | 6 (37.5%) |
| 65 to 74 Years | 0 (0.0%) | 3 (42.9%) |
| 75 Years and over | 1 (25.0%) | 3 (42.9%) |
Disability Class: Self-Care Difficulty
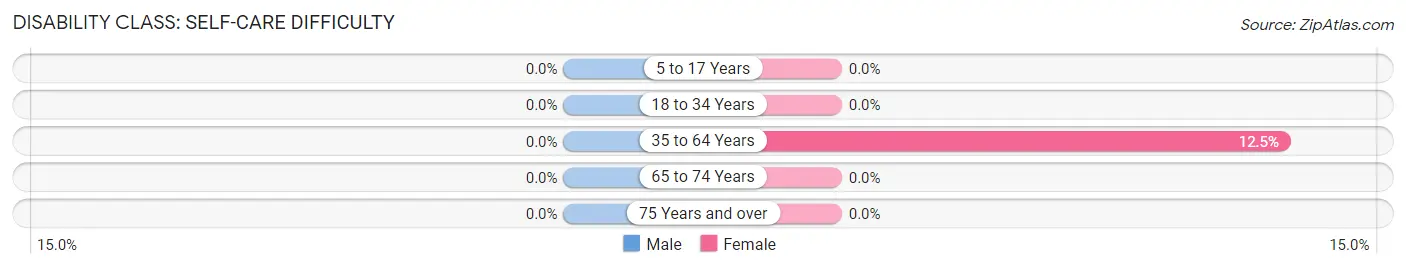
| Age Bracket | Male | Female |
| 5 to 17 Years | 0 (0.0%) | 0 (0.0%) |
| 18 to 34 Years | 0 (0.0%) | 0 (0.0%) |
| 35 to 64 Years | 0 (0.0%) | 2 (12.5%) |
| 65 to 74 Years | 0 (0.0%) | 0 (0.0%) |
| 75 Years and over | 0 (0.0%) | 0 (0.0%) |
Technology Access in Queets
Computing Device Access in Queets
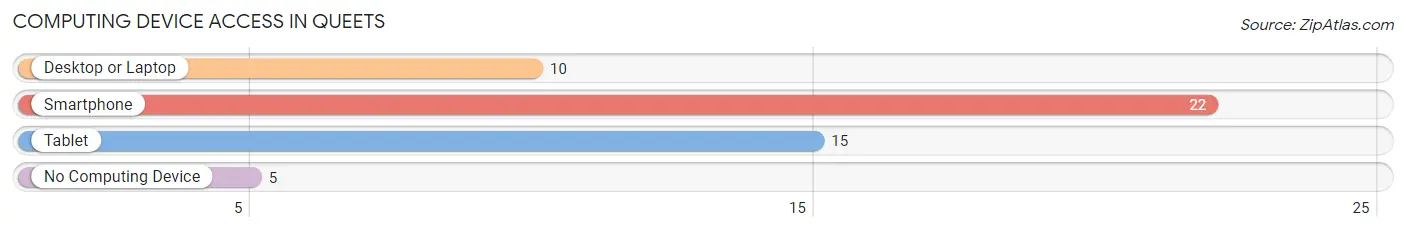
| Device Type | # Households | % Households |
| Desktop or Laptop | 10 | 32.3% |
| Smartphone | 22 | 71.0% |
| Tablet | 15 | 48.4% |
| No Computing Device | 5 | 16.1% |
| Total | 31 | 100.0% |
Internet Access in Queets
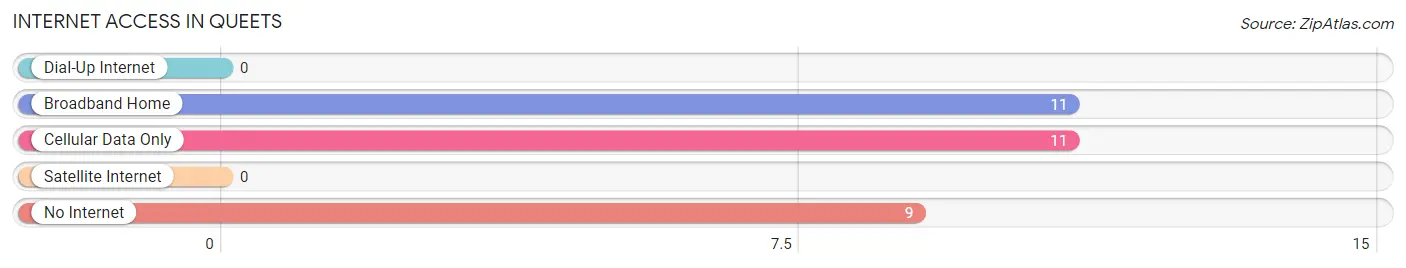
| Internet Type | # Households | % Households |
| Dial-Up Internet | 0 | 0.0% |
| Broadband Home | 11 | 35.5% |
| Cellular Data Only | 11 | 35.5% |
| Satellite Internet | 0 | 0.0% |
| No Internet | 9 | 29.0% |
| Total | 31 | 100.0% |
Queets Summary
Queets is a small unincorporated community located in the Olympic Peninsula of Washington State. It is situated in the Quinault Indian Reservation, and is home to the Quinault Indian Nation. The population of Queets was estimated to be around 200 people in 2000.
History
The Quinault Indian Nation has lived in the Queets area for thousands of years. The Quinault people have a rich history and culture that is deeply rooted in the land and the surrounding environment. The Quinault people have a long history of fishing, hunting, and gathering in the Queets area.
The first non-native settlers arrived in the Queets area in the late 1800s. These settlers were mostly loggers and fishermen who were drawn to the area for its abundant resources. The logging industry was the primary source of income for the area until the mid-1900s when the timber industry began to decline.
Geography
Queets is located in the Olympic Peninsula of Washington State. It is situated in the Quinault Indian Reservation, and is bordered by the Queets River to the north and the Pacific Ocean to the west. The Queets River is a major tributary of the Quinault River, which flows into the Pacific Ocean.
The Queets area is characterized by its rugged terrain and dense forests. The area is home to a variety of wildlife, including black bears, elk, deer, and salmon. The Queets River is a popular destination for fishing and kayaking.
Economy
The economy of Queets is largely based on tourism and fishing. The Queets River is a popular destination for fishing and kayaking, and the area is home to several fishing lodges and resorts. The Quinault Indian Nation also operates several businesses in the area, including a casino, a hotel, and a restaurant.
The Quinault Indian Nation also operates a number of businesses in the area, including a logging company, a sawmill, and a fish processing plant. The Quinault Indian Nation also operates a number of retail stores in the area, including a grocery store, a hardware store, and a gas station.
Demographics
The population of Queets was estimated to be around 200 people in 2000. The majority of the population is Native American, with the Quinault Indian Nation making up the majority of the population. The population is also composed of a small number of non-native settlers.
The median household income in Queets is $25,000, and the median age is 35. The majority of the population is employed in the fishing and tourism industries. The unemployment rate in Queets is higher than the national average.
Conclusion
Queets is a small unincorporated community located in the Olympic Peninsula of Washington State. It is situated in the Quinault Indian Reservation, and is home to the Quinault Indian Nation. The population of Queets was estimated to be around 200 people in 2000. The economy of Queets is largely based on tourism and fishing, and the majority of the population is Native American. The median household income in Queets is $25,000, and the median age is 35. The unemployment rate in Queets is higher than the national average.
Common Questions
What is Per Capita Income in Queets?
Per Capita income in Queets is $12,970.
What is the Median Family Income in Queets?
Median Family Income in Queets is $40,000.
What is the Median Household income in Queets?
Median Household Income in Queets is $50,208.
What is Inequality or Gini Index in Queets?
Inequality or Gini Index in Queets is 0.33.
What is the Total Population of Queets?
Total Population of Queets is 114.
What is the Total Male Population of Queets?
Total Male Population of Queets is 46.
What is the Total Female Population of Queets?
Total Female Population of Queets is 68.
What is the Ratio of Males per 100 Females in Queets?
There are 67.65 Males per 100 Females in Queets.
What is the Ratio of Females per 100 Males in Queets?
There are 147.83 Females per 100 Males in Queets.
What is the Median Population Age in Queets?
Median Population Age in Queets is 30.3 Years.
What is the Average Family Size in Queets
Average Family Size in Queets is 4.2 People.
What is the Average Household Size in Queets
Average Household Size in Queets is 3.7 People.
How Large is the Labor Force in Queets?
There are 33 People in the Labor Forcein in Queets.
What is the Percentage of People in the Labor Force in Queets?
43.4% of People are in the Labor Force in Queets.
What is the Unemployment Rate in Queets?
Unemployment Rate in Queets is 12.1%.