Springdale, WA Map & Demographics
Springdale Map
Springdale Overview
$16,690
PER CAPITA INCOME
$49,850
AVG FAMILY INCOME
$48,950
AVG HOUSEHOLD INCOME
59.4%
WAGE / INCOME GAP [ % ]
40.6¢/ $1
WAGE / INCOME GAP [ $ ]
0.38
INEQUALITY / GINI INDEX
513
TOTAL POPULATION
222
MALE POPULATION
291
FEMALE POPULATION
76.29
MALES / 100 FEMALES
131.08
FEMALES / 100 MALES
20.4
MEDIAN AGE
4.8
AVG FAMILY SIZE
3.5
AVG HOUSEHOLD SIZE
124
LABOR FORCE [ PEOPLE ]
41.8%
PERCENT IN LABOR FORCE
Springdale Zip Codes
Springdale Area Codes
Income in Springdale
Income Overview in Springdale
Per Capita Income in Springdale is $16,690, while median incomes of families and households are $49,850 and $48,950 respectively.
| Characteristic | Number | Measure |
| Per Capita Income | 513 | $16,690 |
| Median Family Income | 81 | $49,850 |
| Mean Family Income | 81 | $53,367 |
| Median Household Income | 147 | $48,950 |
| Mean Household Income | 147 | $58,719 |
| Income Deficit | 81 | $0 |
| Wage / Income Gap (%) | 513 | 59.42% |
| Wage / Income Gap ($) | 513 | 40.58¢ per $1 |
| Gini / Inequality Index | 513 | 0.38 |
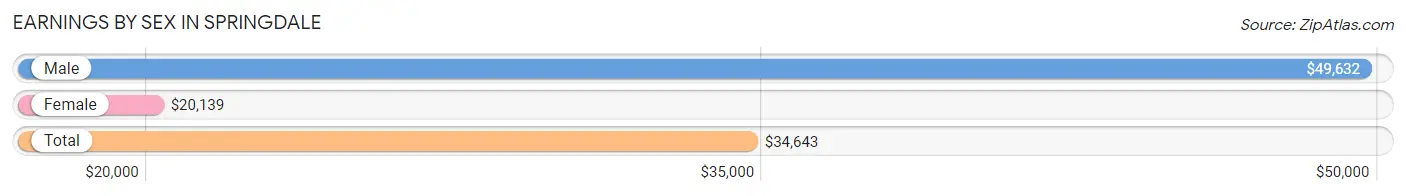
Earnings by Sex in Springdale
Average Earnings in Springdale are $34,643, $49,632 for men and $20,139 for women, a difference of 59.4%.
| Sex | Number | Average Earnings |
| Male | 93 (62.8%) | $49,632 |
| Female | 55 (37.2%) | $20,139 |
| Total | 148 (100.0%) | $34,643 |
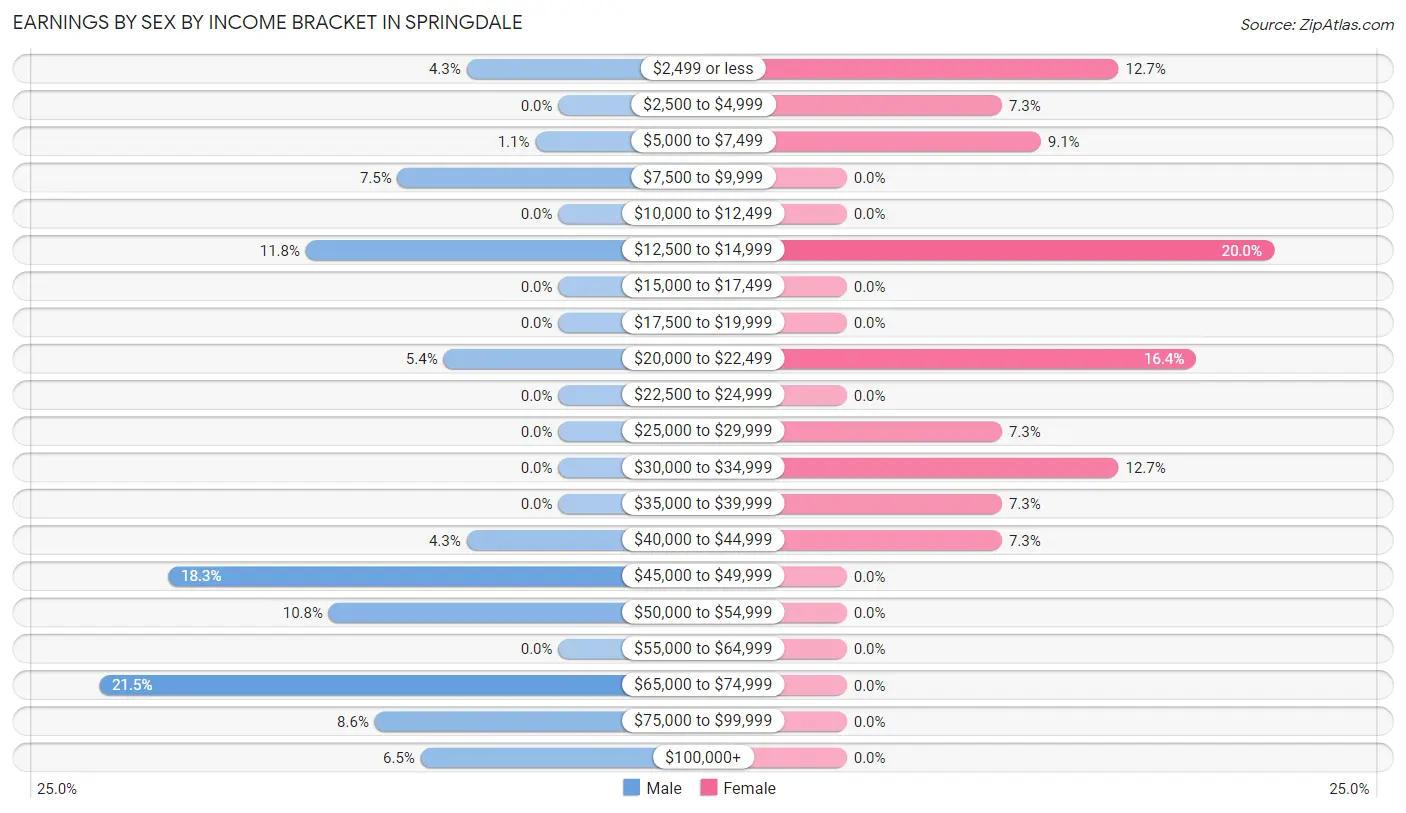
Earnings by Sex by Income Bracket in Springdale
The most common earnings brackets in Springdale are $65,000 to $74,999 for men (20 | 21.5%) and $12,500 to $14,999 for women (11 | 20.0%).
| Income | Male | Female |
| $2,499 or less | 4 (4.3%) | 7 (12.7%) |
| $2,500 to $4,999 | 0 (0.0%) | 4 (7.3%) |
| $5,000 to $7,499 | 1 (1.1%) | 5 (9.1%) |
| $7,500 to $9,999 | 7 (7.5%) | 0 (0.0%) |
| $10,000 to $12,499 | 0 (0.0%) | 0 (0.0%) |
| $12,500 to $14,999 | 11 (11.8%) | 11 (20.0%) |
| $15,000 to $17,499 | 0 (0.0%) | 0 (0.0%) |
| $17,500 to $19,999 | 0 (0.0%) | 0 (0.0%) |
| $20,000 to $22,499 | 5 (5.4%) | 9 (16.4%) |
| $22,500 to $24,999 | 0 (0.0%) | 0 (0.0%) |
| $25,000 to $29,999 | 0 (0.0%) | 4 (7.3%) |
| $30,000 to $34,999 | 0 (0.0%) | 7 (12.7%) |
| $35,000 to $39,999 | 0 (0.0%) | 4 (7.3%) |
| $40,000 to $44,999 | 4 (4.3%) | 4 (7.3%) |
| $45,000 to $49,999 | 17 (18.3%) | 0 (0.0%) |
| $50,000 to $54,999 | 10 (10.7%) | 0 (0.0%) |
| $55,000 to $64,999 | 0 (0.0%) | 0 (0.0%) |
| $65,000 to $74,999 | 20 (21.5%) | 0 (0.0%) |
| $75,000 to $99,999 | 8 (8.6%) | 0 (0.0%) |
| $100,000+ | 6 (6.5%) | 0 (0.0%) |
| Total | 93 (100.0%) | 55 (100.0%) |
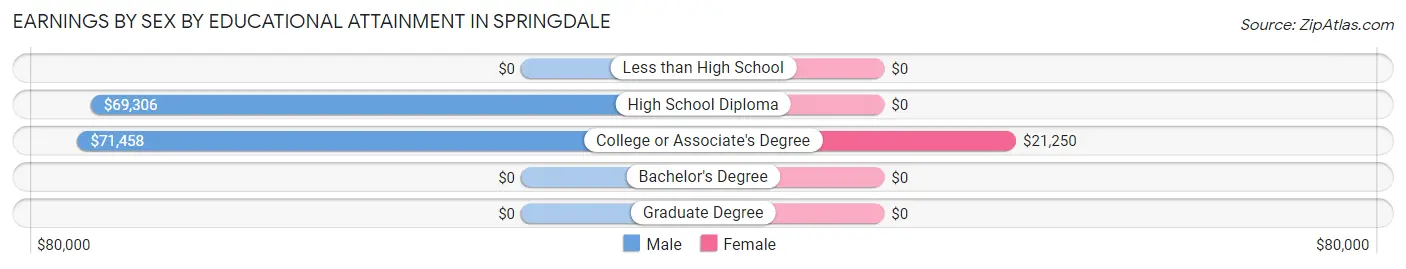
Earnings by Sex by Educational Attainment in Springdale
Average earnings in Springdale are $67,250 for men and $21,250 for women, a difference of 68.4%. Men with an educational attainment of college or associate's degree enjoy the highest average annual earnings of $71,458, while those with high school diploma education earn the least with $69,306. Women with an educational attainment of college or associate's degree earn the most with the average annual earnings of $21,250, while those with college or associate's degree education have the smallest earnings of $21,250.
| Educational Attainment | Male Income | Female Income |
| Less than High School | - | - |
| High School Diploma | $69,306 | $0 |
| College or Associate's Degree | $71,458 | $21,250 |
| Bachelor's Degree | - | - |
| Graduate Degree | - | - |
| Total | $67,250 | $21,250 |
Family Income in Springdale
Family Income Brackets in Springdale
According to the Springdale family income data, there are 32 families falling into the $35,000 to $49,999 income range, which is the most common income bracket and makes up 39.5% of all families.
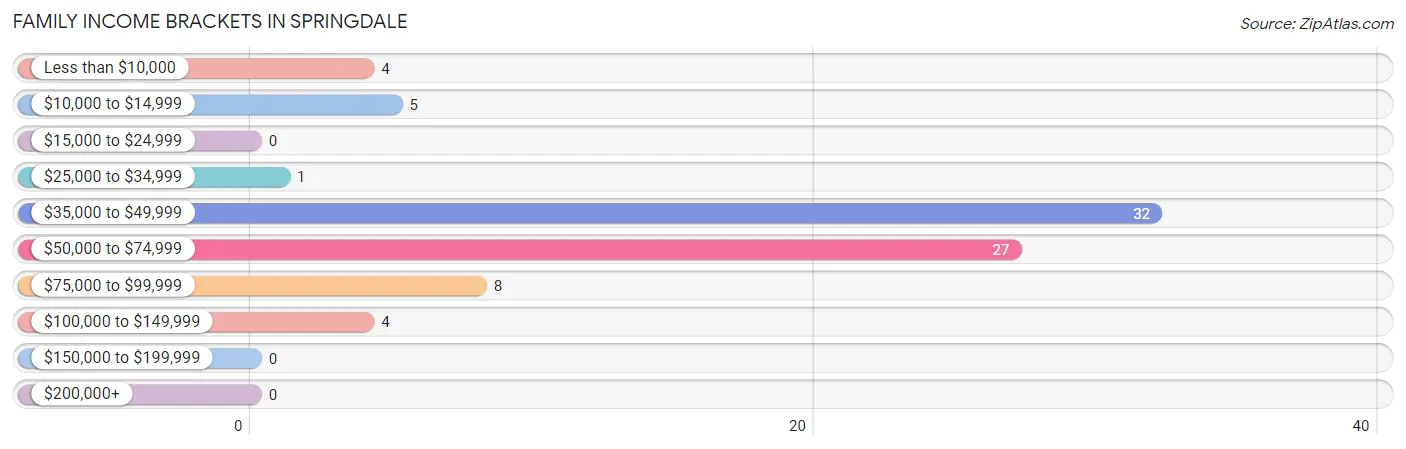
| Income Bracket | # Families | % Families |
| Less than $10,000 | 4 | 4.9% |
| $10,000 to $14,999 | 5 | 6.2% |
| $15,000 to $24,999 | 0 | 0.0% |
| $25,000 to $34,999 | 1 | 1.2% |
| $35,000 to $49,999 | 32 | 39.5% |
| $50,000 to $74,999 | 27 | 33.3% |
| $75,000 to $99,999 | 8 | 9.9% |
| $100,000 to $149,999 | 4 | 4.9% |
| $150,000 to $199,999 | 0 | 0.0% |
| $200,000+ | 0 | 0.0% |
Family Income by Famaliy Size in Springdale
6-person families (7 | 8.6%) account for the highest median family income in Springdale with $97,813 per family, while 2-person families (40 | 49.4%) have the highest median income of $25,673 per family member.
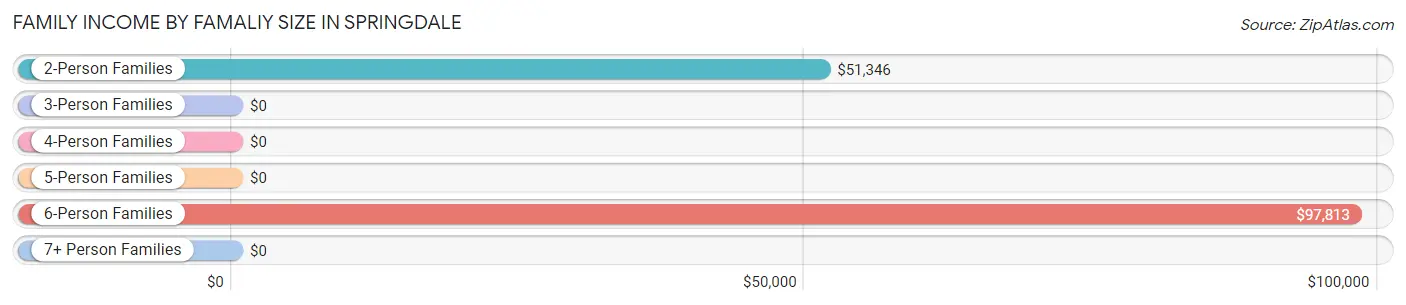
| Income Bracket | # Families | Median Income |
| 2-Person Families | 40 (49.4%) | $51,346 |
| 3-Person Families | 4 (4.9%) | $0 |
| 4-Person Families | 9 (11.1%) | $0 |
| 5-Person Families | 0 (0.0%) | $0 |
| 6-Person Families | 7 (8.6%) | $97,813 |
| 7+ Person Families | 21 (25.9%) | $0 |
| Total | 81 (100.0%) | $49,850 |
Family Income by Number of Earners in Springdale
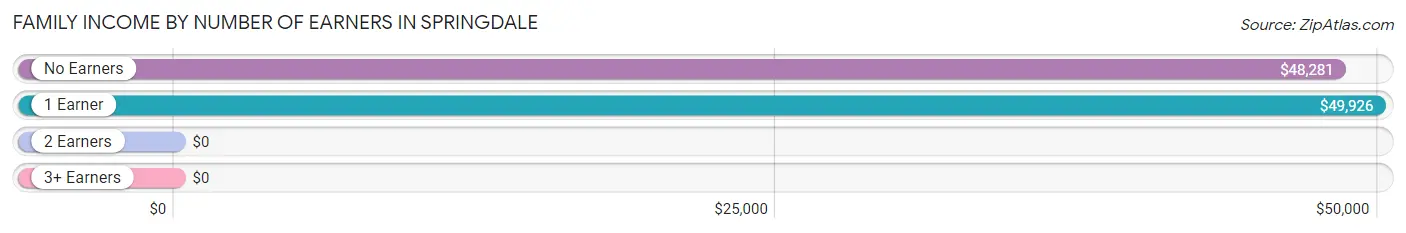
| Number of Earners | # Families | Median Income |
| No Earners | 23 (28.4%) | $48,281 |
| 1 Earner | 43 (53.1%) | $49,926 |
| 2 Earners | 8 (9.9%) | $0 |
| 3+ Earners | 7 (8.6%) | $0 |
| Total | 81 (100.0%) | $49,850 |
Household Income in Springdale
Household Income Brackets in Springdale
With 41 households falling in the category, the $35,000 to $49,999 income range is the most frequent in Springdale, accounting for 27.9% of all households.
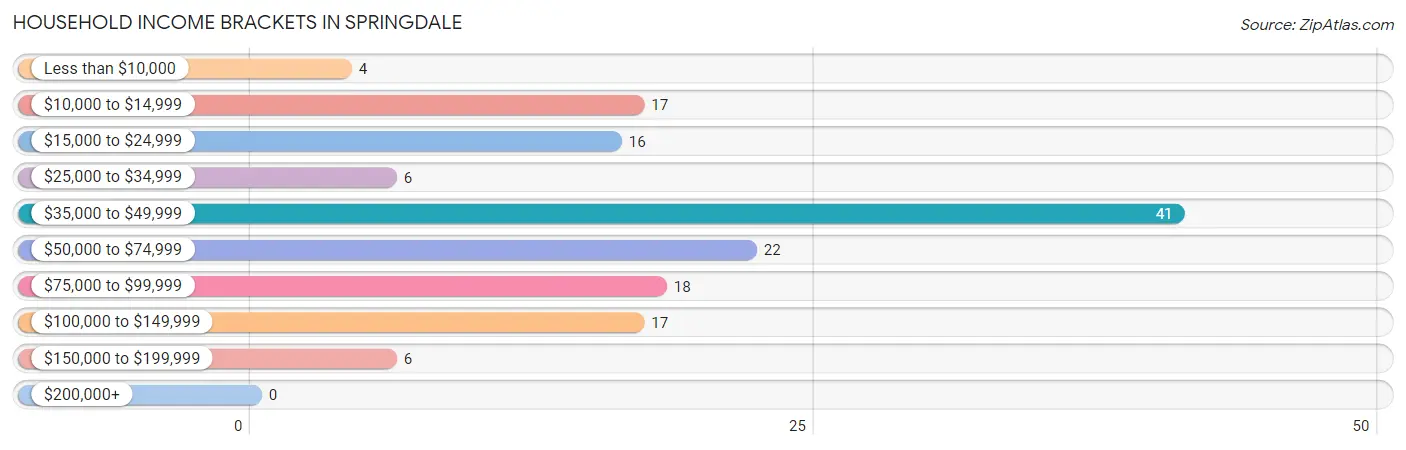
| Income Bracket | # Households | % Households |
| Less than $10,000 | 4 | 2.7% |
| $10,000 to $14,999 | 17 | 11.6% |
| $15,000 to $24,999 | 16 | 10.9% |
| $25,000 to $34,999 | 6 | 4.1% |
| $35,000 to $49,999 | 41 | 27.9% |
| $50,000 to $74,999 | 22 | 15.0% |
| $75,000 to $99,999 | 18 | 12.2% |
| $100,000 to $149,999 | 17 | 11.6% |
| $150,000 to $199,999 | 6 | 4.1% |
| $200,000+ | 0 | 0.0% |
Household Income by Householder Age in Springdale
The median household income in Springdale is $48,950, with the highest median household income of $81,667 found in the 45 to 64 years age bracket for the primary householder. A total of 58 households (39.5%) fall into this category. Meanwhile, the 15 to 24 years age bracket for the primary householder has the lowest median household income of $0, with 4 households (2.7%) in this group.
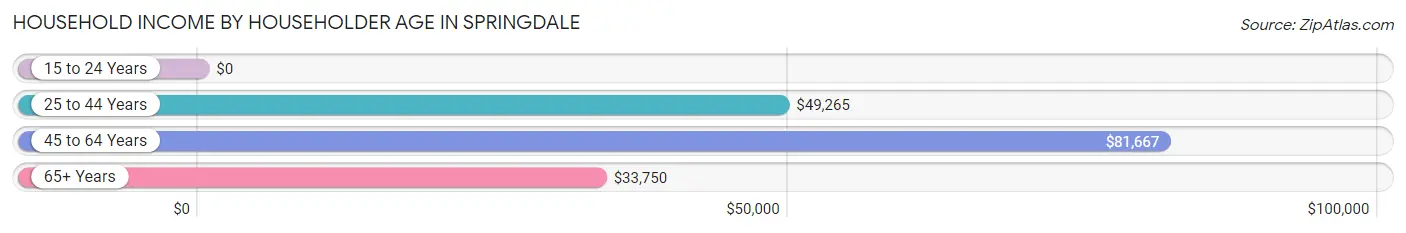
| Income Bracket | # Households | Median Income |
| 15 to 24 Years | 4 (2.7%) | $0 |
| 25 to 44 Years | 38 (25.9%) | $49,265 |
| 45 to 64 Years | 58 (39.5%) | $81,667 |
| 65+ Years | 47 (32.0%) | $33,750 |
| Total | 147 (100.0%) | $48,950 |
Poverty in Springdale
Income Below Poverty by Sex and Age in Springdale
With 27.1% poverty level for males and 15.8% for females among the residents of Springdale, 6 to 11 year old males and 18 to 24 year old females are the most vulnerable to poverty, with 18 males (100.0%) and 12 females (75.0%) in their respective age groups living below the poverty level.
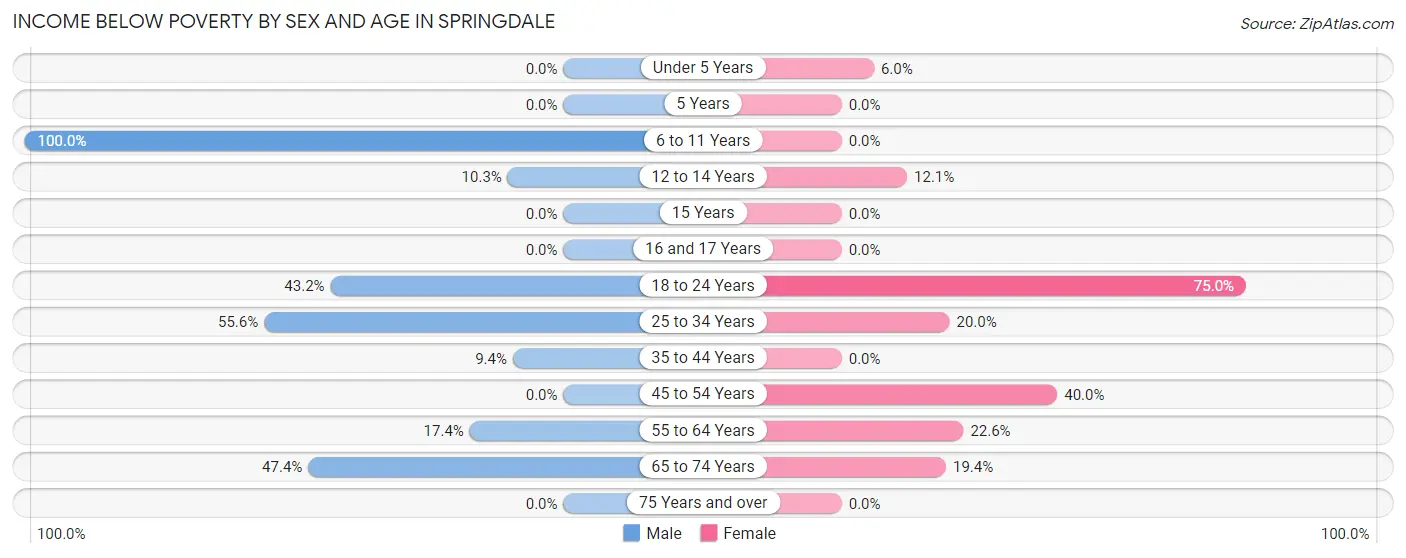
| Age Bracket | Male | Female |
| Under 5 Years | 0 (0.0%) | 4 (6.0%) |
| 5 Years | 0 (0.0%) | 0 (0.0%) |
| 6 to 11 Years | 18 (100.0%) | 0 (0.0%) |
| 12 to 14 Years | 3 (10.3%) | 4 (12.1%) |
| 15 Years | 0 (0.0%) | 0 (0.0%) |
| 16 and 17 Years | 0 (0.0%) | 0 (0.0%) |
| 18 to 24 Years | 16 (43.2%) | 12 (75.0%) |
| 25 to 34 Years | 5 (55.6%) | 5 (20.0%) |
| 35 to 44 Years | 3 (9.4%) | 0 (0.0%) |
| 45 to 54 Years | 0 (0.0%) | 8 (40.0%) |
| 55 to 64 Years | 4 (17.4%) | 7 (22.6%) |
| 65 to 74 Years | 9 (47.4%) | 6 (19.4%) |
| 75 Years and over | 0 (0.0%) | 0 (0.0%) |
| Total | 58 (27.1%) | 46 (15.8%) |
Income Above Poverty by Sex and Age in Springdale
According to the poverty statistics in Springdale, males aged under 5 years and females aged 5 years are the age groups that are most secure financially, with 100.0% of males and 100.0% of females in these age groups living above the poverty line.
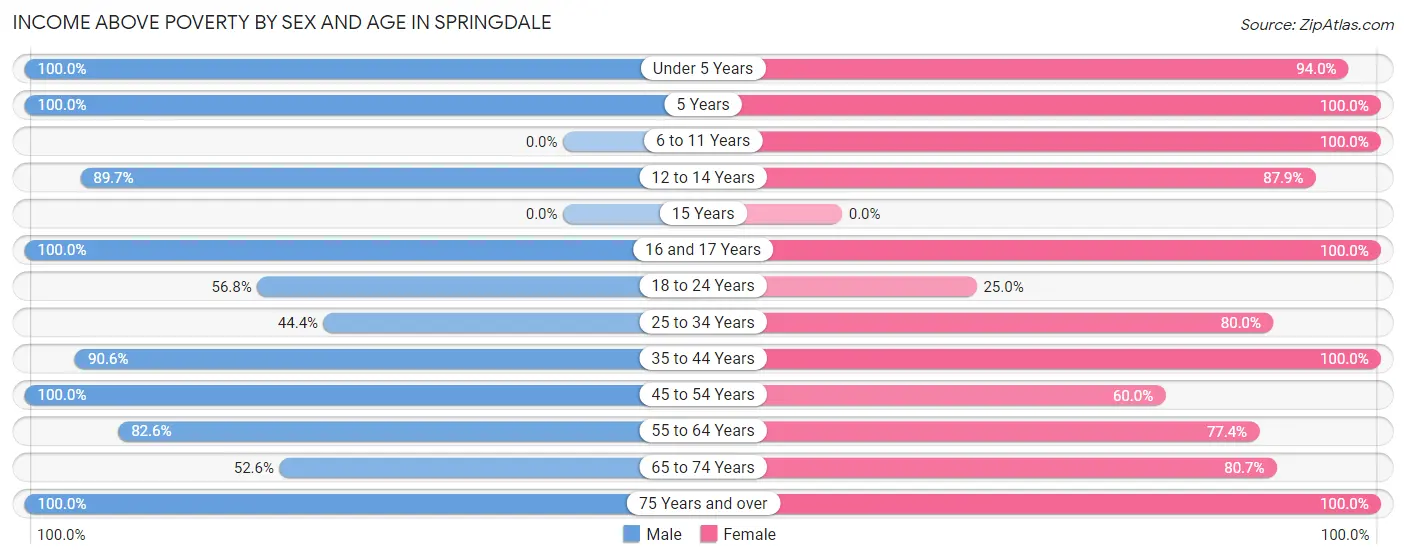
| Age Bracket | Male | Female |
| Under 5 Years | 2 (100.0%) | 63 (94.0%) |
| 5 Years | 18 (100.0%) | 4 (100.0%) |
| 6 to 11 Years | 0 (0.0%) | 37 (100.0%) |
| 12 to 14 Years | 26 (89.7%) | 29 (87.9%) |
| 15 Years | 0 (0.0%) | 0 (0.0%) |
| 16 and 17 Years | 7 (100.0%) | 4 (100.0%) |
| 18 to 24 Years | 21 (56.8%) | 4 (25.0%) |
| 25 to 34 Years | 4 (44.4%) | 20 (80.0%) |
| 35 to 44 Years | 29 (90.6%) | 13 (100.0%) |
| 45 to 54 Years | 11 (100.0%) | 12 (60.0%) |
| 55 to 64 Years | 19 (82.6%) | 24 (77.4%) |
| 65 to 74 Years | 10 (52.6%) | 25 (80.6%) |
| 75 Years and over | 9 (100.0%) | 10 (100.0%) |
| Total | 156 (72.9%) | 245 (84.2%) |
Income Below Poverty Among Married-Couple Families in Springdale
The poverty statistics for married-couple families in Springdale show that 13.6% or 8 of the total 59 families live below the poverty line. Families with 3 or 4 children have the highest poverty rate of 100.0%, comprising of 4 families. On the other hand, families with 1 or 2 children have the lowest poverty rate of 0.0%, which includes 0 families.
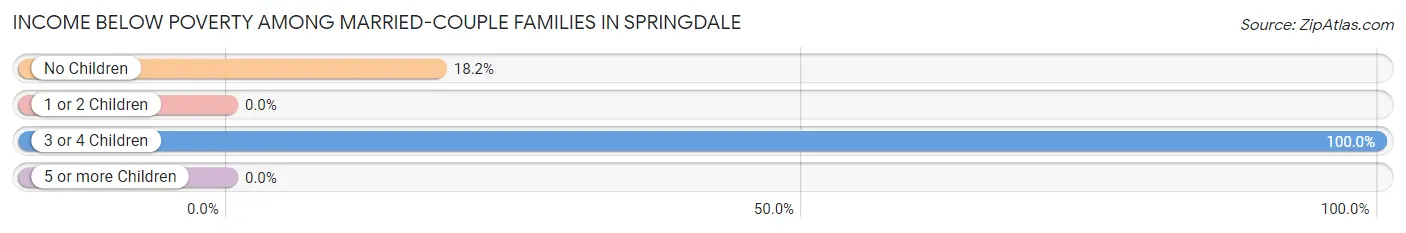
| Children | Above Poverty | Below Poverty |
| No Children | 18 (81.8%) | 4 (18.2%) |
| 1 or 2 Children | 16 (100.0%) | 0 (0.0%) |
| 3 or 4 Children | 0 (0.0%) | 4 (100.0%) |
| 5 or more Children | 17 (100.0%) | 0 (0.0%) |
| Total | 51 (86.4%) | 8 (13.6%) |
Income Below Poverty Among Single-Parent Households in Springdale
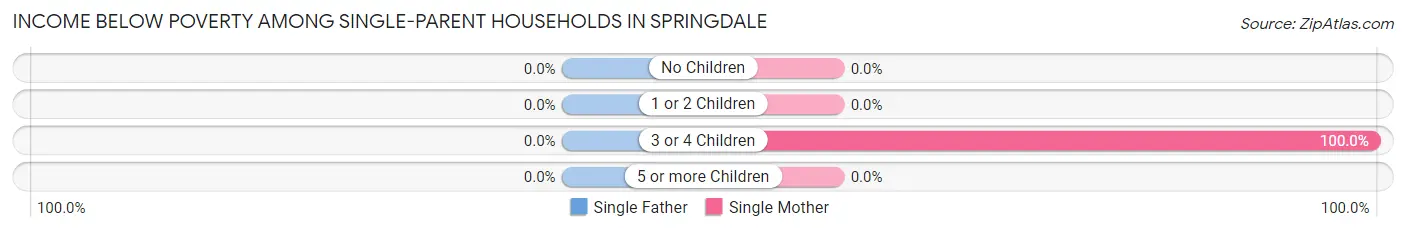
| Children | Single Father | Single Mother |
| No Children | 0 (0.0%) | 0 (0.0%) |
| 1 or 2 Children | 0 (0.0%) | 0 (0.0%) |
| 3 or 4 Children | 0 (0.0%) | 1 (100.0%) |
| 5 or more Children | 0 (0.0%) | 0 (0.0%) |
| Total | 0 (0.0%) | 1 (5.6%) |
Income Below Poverty Among Married-Couple vs Single-Parent Households in Springdale
The poverty data for Springdale shows that 8 of the married-couple family households (13.6%) and 1 of the single-parent households (4.5%) are living below the poverty level. Within the married-couple family households, those with 3 or 4 children have the highest poverty rate, with 4 households (100.0%) falling below the poverty line. Among the single-parent households, those with 3 or 4 children have the highest poverty rate, with 1 household (100.0%) living below poverty.
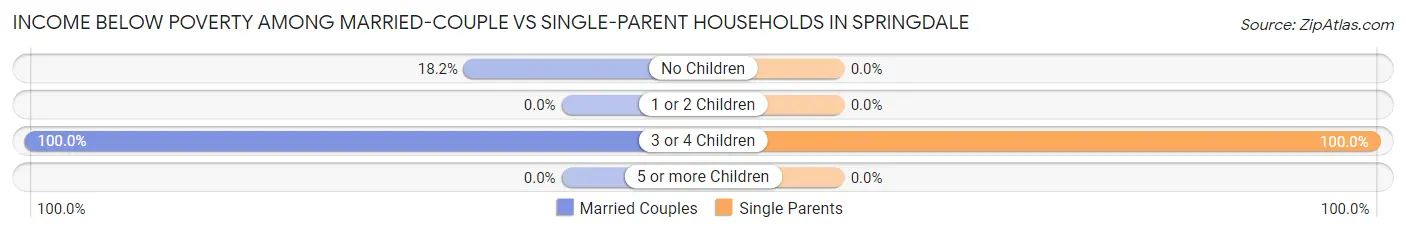
| Children | Married-Couple Families | Single-Parent Households |
| No Children | 4 (18.2%) | 0 (0.0%) |
| 1 or 2 Children | 0 (0.0%) | 0 (0.0%) |
| 3 or 4 Children | 4 (100.0%) | 1 (100.0%) |
| 5 or more Children | 0 (0.0%) | 0 (0.0%) |
| Total | 8 (13.6%) | 1 (4.5%) |
Race in Springdale
The most populous races in Springdale are White / Caucasian (463 | 90.2%), Native / Alaskan (29 | 5.7%), and Hispanic or Latino (18 | 3.5%).
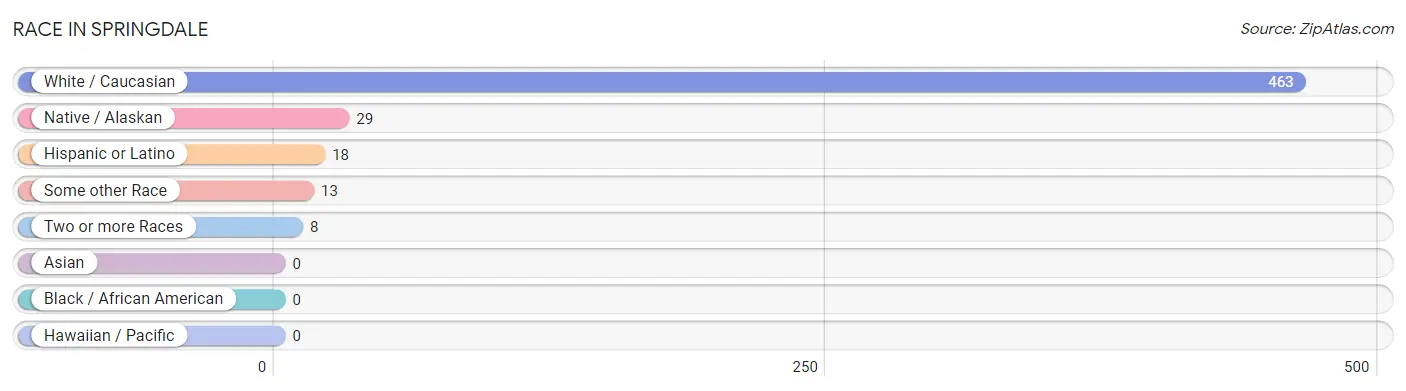
| Race | # Population | % Population |
| Asian | 0 | 0.0% |
| Black / African American | 0 | 0.0% |
| Hawaiian / Pacific | 0 | 0.0% |
| Hispanic or Latino | 18 | 3.5% |
| Native / Alaskan | 29 | 5.7% |
| White / Caucasian | 463 | 90.2% |
| Two or more Races | 8 | 1.6% |
| Some other Race | 13 | 2.5% |
| Total | 513 | 100.0% |
Ancestry in Springdale
The most populous ancestries reported in Springdale are American (266 | 51.8%), Irish (56 | 10.9%), German (53 | 10.3%), English (25 | 4.9%), and Central American (13 | 2.5%), together accounting for 80.5% of all Springdale residents.
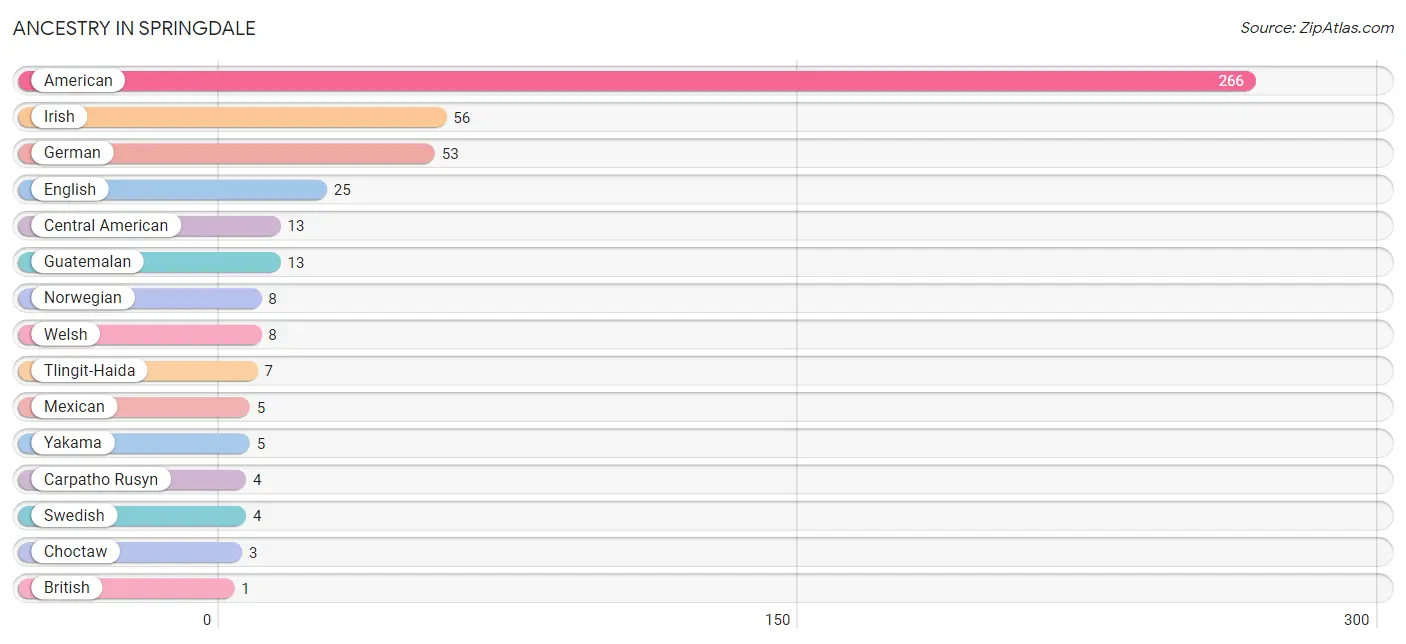
| Ancestry | # Population | % Population |
| American | 266 | 51.8% |
| British | 1 | 0.2% |
| Carpatho Rusyn | 4 | 0.8% |
| Central American | 13 | 2.5% |
| Choctaw | 3 | 0.6% |
| English | 25 | 4.9% |
| German | 53 | 10.3% |
| Guatemalan | 13 | 2.5% |
| Irish | 56 | 10.9% |
| Mexican | 5 | 1.0% |
| Norwegian | 8 | 1.6% |
| Swedish | 4 | 0.8% |
| Tlingit-Haida | 7 | 1.4% |
| Welsh | 8 | 1.6% |
| Yakama | 5 | 1.0% | View All 15 Rows |
Immigrants in Springdale
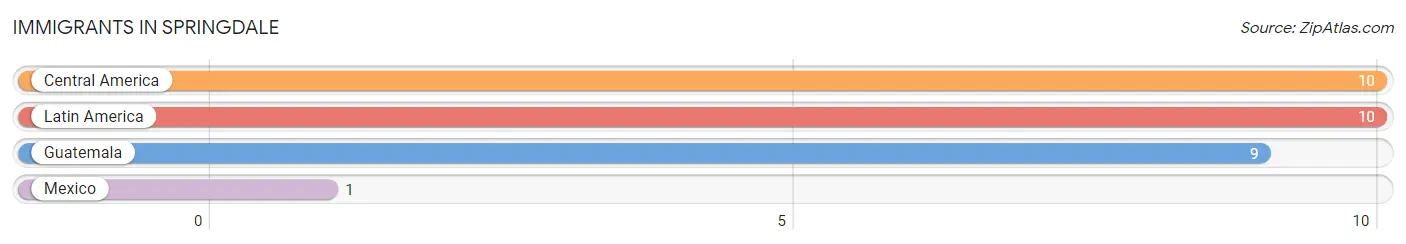
The most numerous immigrant groups reported in Springdale came from Central America (10 | 1.9%), Latin America (10 | 1.9%), Guatemala (9 | 1.8%), and Mexico (1 | 0.2%), together accounting for 5.8% of all Springdale residents.
| Immigration Origin | # Population | % Population |
| Central America | 10 | 1.9% |
| Guatemala | 9 | 1.8% |
| Latin America | 10 | 1.9% |
| Mexico | 1 | 0.2% | View All 4 Rows |
Sex and Age in Springdale
Sex and Age in Springdale
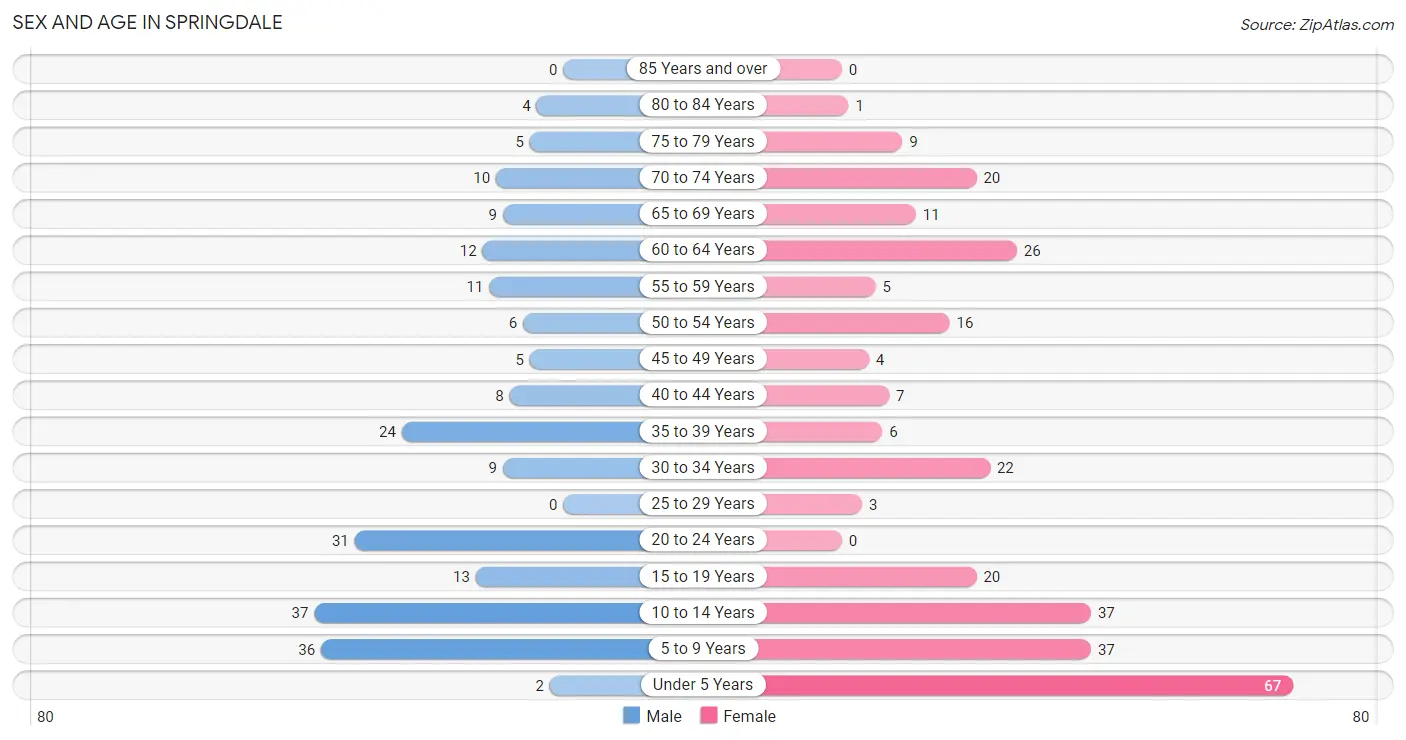
The most populous age groups in Springdale are 10 to 14 Years (37 | 16.7%) for men and Under 5 Years (67 | 23.0%) for women.
| Age Bracket | Male | Female |
| Under 5 Years | 2 (0.9%) | 67 (23.0%) |
| 5 to 9 Years | 36 (16.2%) | 37 (12.7%) |
| 10 to 14 Years | 37 (16.7%) | 37 (12.7%) |
| 15 to 19 Years | 13 (5.9%) | 20 (6.9%) |
| 20 to 24 Years | 31 (14.0%) | 0 (0.0%) |
| 25 to 29 Years | 0 (0.0%) | 3 (1.0%) |
| 30 to 34 Years | 9 (4.1%) | 22 (7.6%) |
| 35 to 39 Years | 24 (10.8%) | 6 (2.1%) |
| 40 to 44 Years | 8 (3.6%) | 7 (2.4%) |
| 45 to 49 Years | 5 (2.2%) | 4 (1.4%) |
| 50 to 54 Years | 6 (2.7%) | 16 (5.5%) |
| 55 to 59 Years | 11 (5.0%) | 5 (1.7%) |
| 60 to 64 Years | 12 (5.4%) | 26 (8.9%) |
| 65 to 69 Years | 9 (4.1%) | 11 (3.8%) |
| 70 to 74 Years | 10 (4.5%) | 20 (6.9%) |
| 75 to 79 Years | 5 (2.2%) | 9 (3.1%) |
| 80 to 84 Years | 4 (1.8%) | 1 (0.3%) |
| 85 Years and over | 0 (0.0%) | 0 (0.0%) |
| Total | 222 (100.0%) | 291 (100.0%) |
Families and Households in Springdale
Median Family Size in Springdale
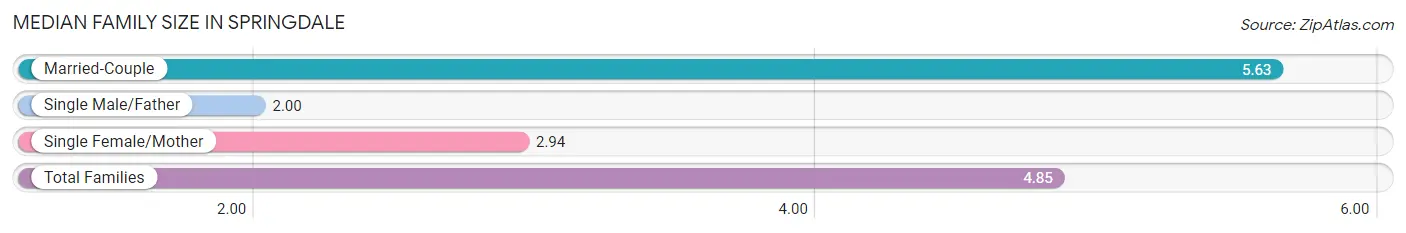
The median family size in Springdale is 4.85 persons per family, with married-couple families (59 | 72.8%) accounting for the largest median family size of 5.63 persons per family. On the other hand, single male/father families (4 | 4.9%) represent the smallest median family size with 2.00 persons per family.
| Family Type | # Families | Family Size |
| Married-Couple | 59 (72.8%) | 5.63 |
| Single Male/Father | 4 (4.9%) | 2.00 |
| Single Female/Mother | 18 (22.2%) | 2.94 |
| Total Families | 81 (100.0%) | 4.85 |
Median Household Size in Springdale
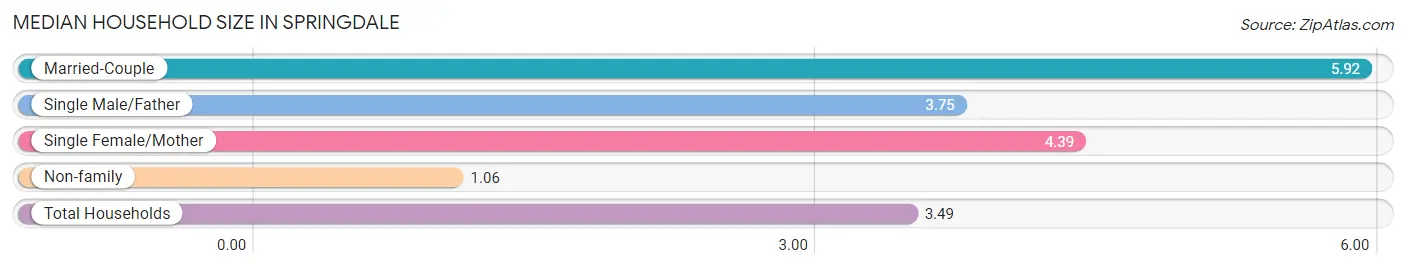
The median household size in Springdale is 3.49 persons per household, with married-couple households (59 | 40.1%) accounting for the largest median household size of 5.92 persons per household. non-family households (66 | 44.9%) represent the smallest median household size with 1.06 persons per household.
| Household Type | # Households | Household Size |
| Married-Couple | 59 (40.1%) | 5.92 |
| Single Male/Father | 4 (2.7%) | 3.75 |
| Single Female/Mother | 18 (12.2%) | 4.39 |
| Non-family | 66 (44.9%) | 1.06 |
| Total Households | 147 (100.0%) | 3.49 |
Household Size by Marriage Status in Springdale
Out of a total of 147 households in Springdale, 81 (55.1%) are family households, while 66 (44.9%) are nonfamily households. The most numerous type of family households are 7+ person households, comprising 34, and the most common type of nonfamily households are 1-person households, comprising 60.
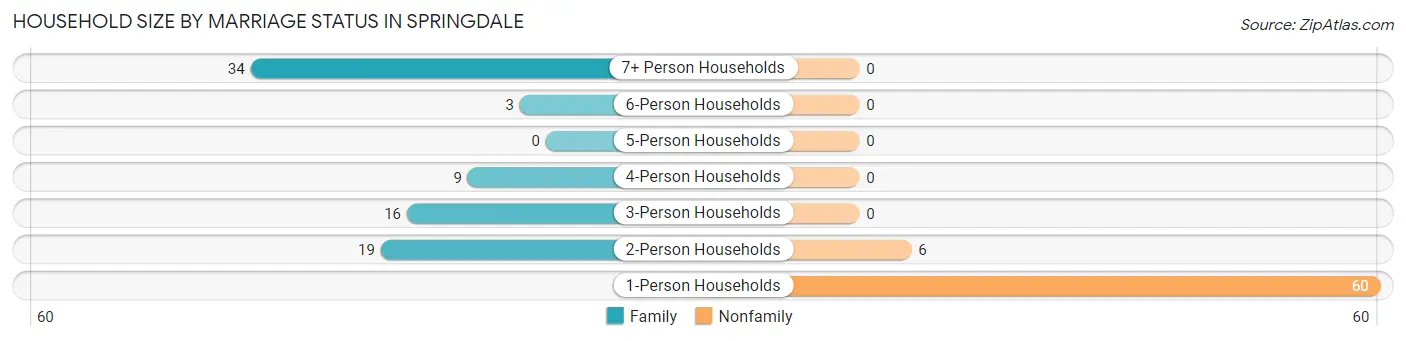
| Household Size | Family Households | Nonfamily Households |
| 1-Person Households | - | 60 (40.8%) |
| 2-Person Households | 19 (12.9%) | 6 (4.1%) |
| 3-Person Households | 16 (10.9%) | 0 (0.0%) |
| 4-Person Households | 9 (6.1%) | 0 (0.0%) |
| 5-Person Households | 0 (0.0%) | 0 (0.0%) |
| 6-Person Households | 3 (2.0%) | 0 (0.0%) |
| 7+ Person Households | 34 (23.1%) | 0 (0.0%) |
| Total | 81 (55.1%) | 66 (44.9%) |
Female Fertility in Springdale
Fertility by Age in Springdale
Average fertility rate in Springdale is 306.0 births per 1,000 women. Women in the age bracket of 20 to 34 years have the highest fertility rate with 520.0 births per 1,000 women. Women in the age bracket of 20 to 34 years acount for 68.4% of all women with births.
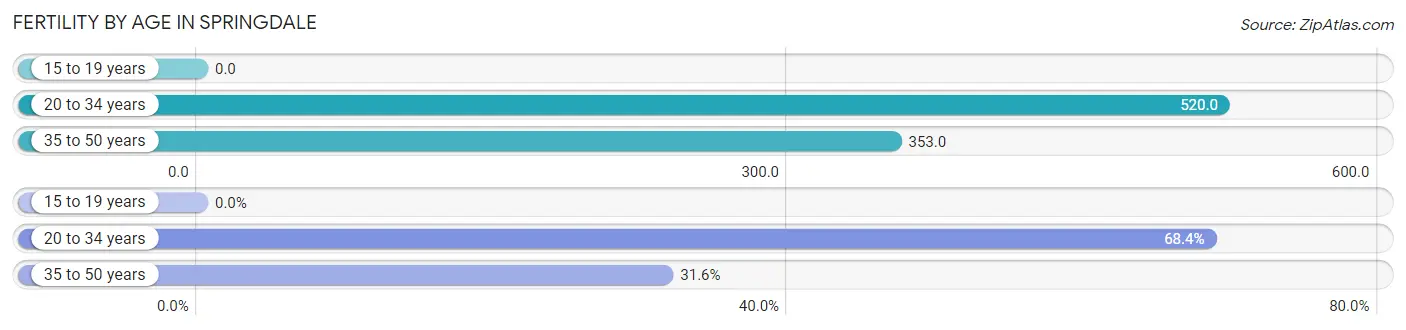
| Age Bracket | Women with Births | Births / 1,000 Women |
| 15 to 19 years | 0 (0.0%) | 0.0 |
| 20 to 34 years | 13 (68.4%) | 520.0 |
| 35 to 50 years | 6 (31.6%) | 353.0 |
| Total | 19 (100.0%) | 306.0 |
Fertility by Age by Marriage Status in Springdale
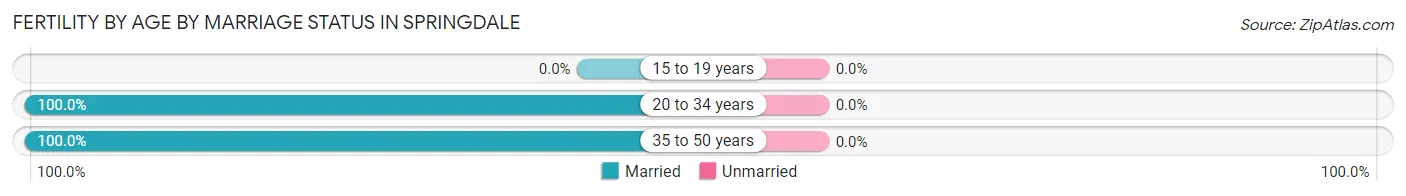
| Age Bracket | Married | Unmarried |
| 15 to 19 years | 0 (0.0%) | 0 (0.0%) |
| 20 to 34 years | 13 (100.0%) | 0 (0.0%) |
| 35 to 50 years | 6 (100.0%) | 0 (0.0%) |
| Total | 19 (100.0%) | 0 (0.0%) |
Fertility by Education in Springdale
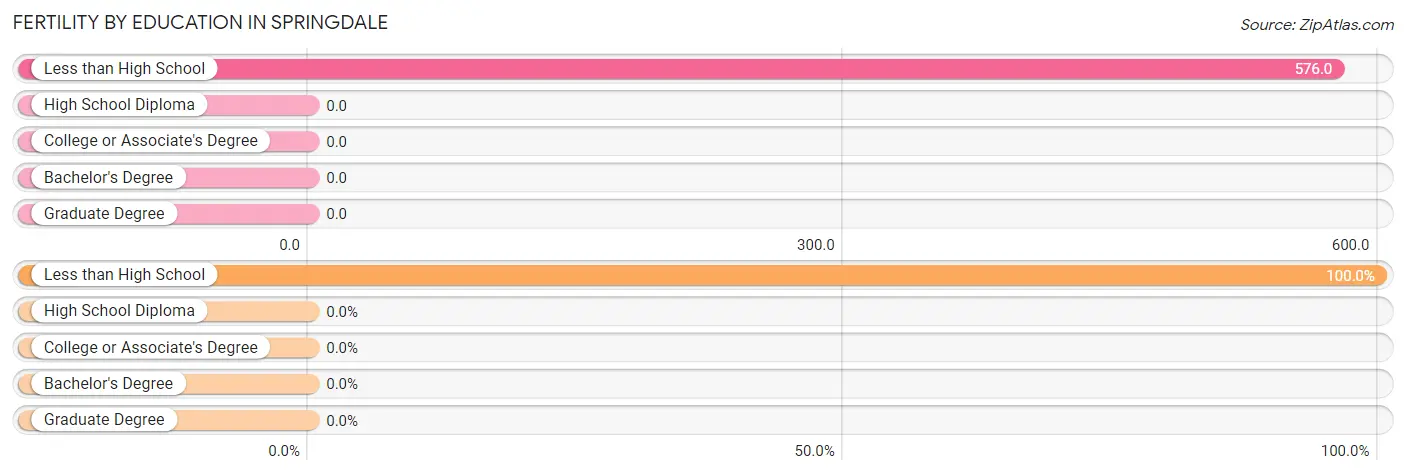
| Educational Attainment | Women with Births | Births / 1,000 Women |
| Less than High School | 19 (100.0%) | 576.0 |
| High School Diploma | 0 (0.0%) | 0.0 |
| College or Associate's Degree | 0 (0.0%) | 0.0 |
| Bachelor's Degree | 0 (0.0%) | 0.0 |
| Graduate Degree | 0 (0.0%) | 0.0 |
| Total | 19 (100.0%) | 306.0 |
Fertility by Education by Marriage Status in Springdale
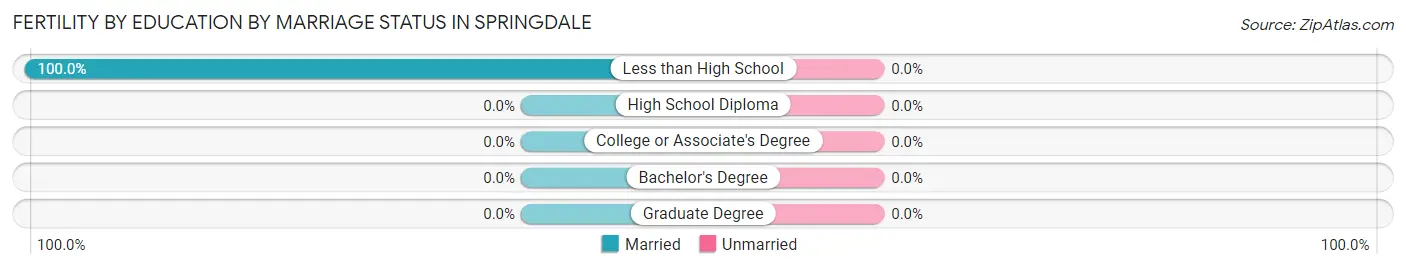
| Educational Attainment | Married | Unmarried |
| Less than High School | 19 (100.0%) | 0 (0.0%) |
| High School Diploma | 0 (0.0%) | 0 (0.0%) |
| College or Associate's Degree | 0 (0.0%) | 0 (0.0%) |
| Bachelor's Degree | 0 (0.0%) | 0 (0.0%) |
| Graduate Degree | 0 (0.0%) | 0 (0.0%) |
| Total | 19 (100.0%) | 0 (0.0%) |
Employment Characteristics in Springdale
Employment by Class of Employer in Springdale
Among the 113 employed individuals in Springdale, private company employees (78 | 69.0%), local government employees (24 | 21.2%), and not-for-profit organizations (7 | 6.2%) make up the most common classes of employment.
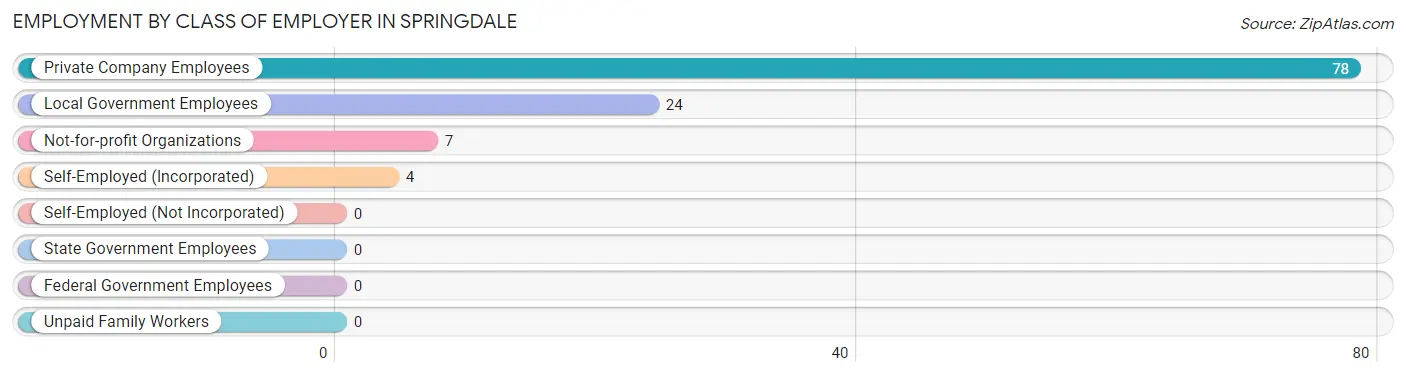
| Employer Class | # Employees | % Employees |
| Private Company Employees | 78 | 69.0% |
| Self-Employed (Incorporated) | 4 | 3.5% |
| Self-Employed (Not Incorporated) | 0 | 0.0% |
| Not-for-profit Organizations | 7 | 6.2% |
| Local Government Employees | 24 | 21.2% |
| State Government Employees | 0 | 0.0% |
| Federal Government Employees | 0 | 0.0% |
| Unpaid Family Workers | 0 | 0.0% |
| Total | 113 | 100.0% |
Employment Status by Age in Springdale
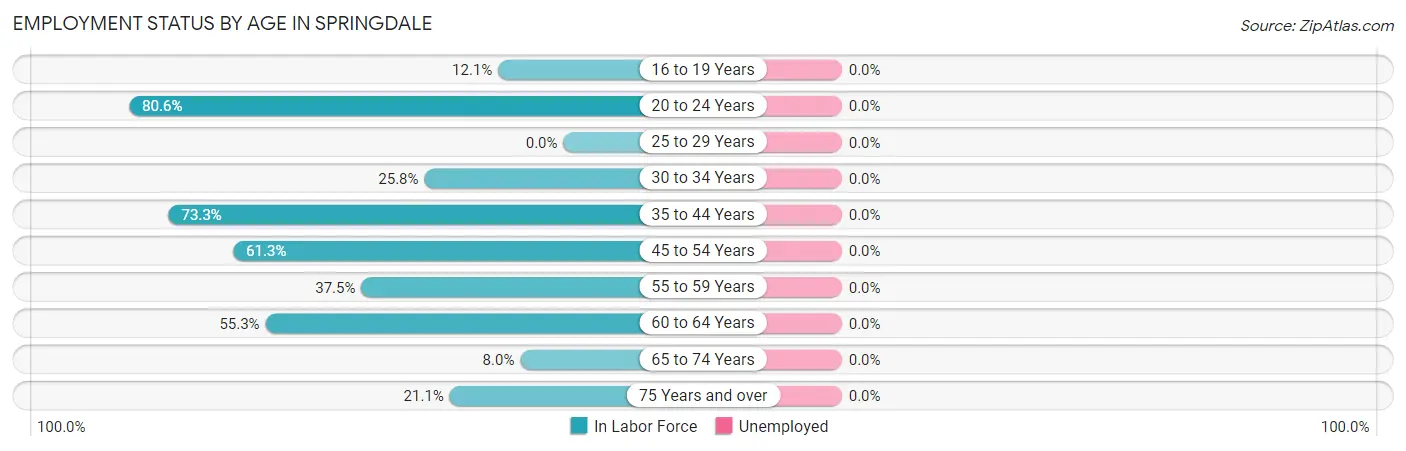
| Age Bracket | In Labor Force | Unemployed |
| 16 to 19 Years | 4 (12.1%) | 0 (0.0%) |
| 20 to 24 Years | 25 (80.6%) | 0 (0.0%) |
| 25 to 29 Years | 0 (0.0%) | 0 (0.0%) |
| 30 to 34 Years | 8 (25.8%) | 0 (0.0%) |
| 35 to 44 Years | 33 (73.3%) | 0 (0.0%) |
| 45 to 54 Years | 19 (61.3%) | 0 (0.0%) |
| 55 to 59 Years | 6 (37.5%) | 0 (0.0%) |
| 60 to 64 Years | 21 (55.3%) | 0 (0.0%) |
| 65 to 74 Years | 4 (8.0%) | 0 (0.0%) |
| 75 Years and over | 4 (21.1%) | 0 (0.0%) |
| Total | 124 (41.8%) | 0 (0.0%) |
Employment Status by Educational Attainment in Springdale
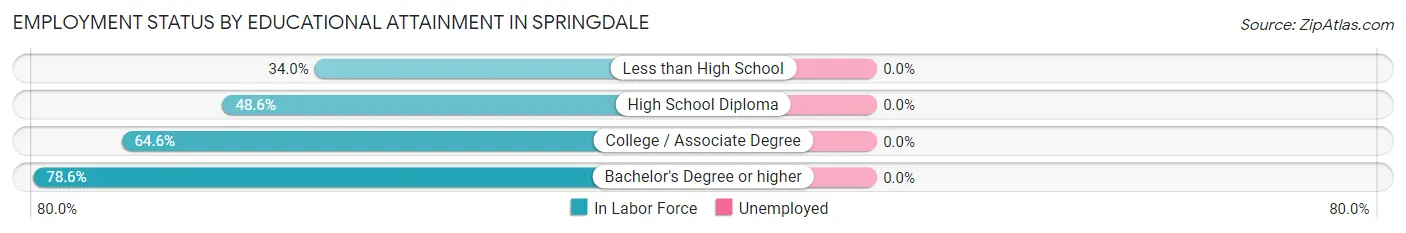
| Educational Attainment | In Labor Force | Unemployed |
| Less than High School | 17 (34.0%) | 0 (0.0%) |
| High School Diploma | 17 (48.6%) | 0 (0.0%) |
| College / Associate Degree | 42 (64.6%) | 0 (0.0%) |
| Bachelor's Degree or higher | 11 (78.6%) | 0 (0.0%) |
| Total | 87 (53.0%) | 0 (0.0%) |
Employment Occupations by Sex in Springdale
Management, Business, Science and Arts Occupations
The most common Management, Business, Science and Arts occupations in Springdale are Community & Social Service (8 | 6.5%), and Education Instruction & Library (8 | 6.5%).
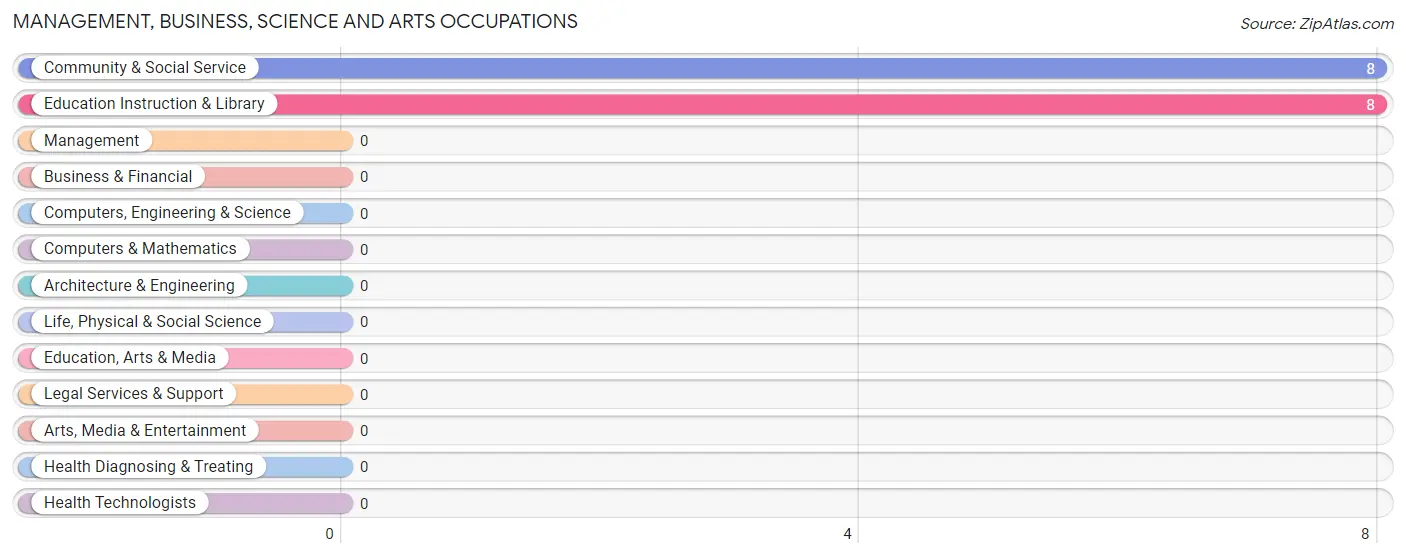
Management, Business, Science and Arts Occupations by Sex
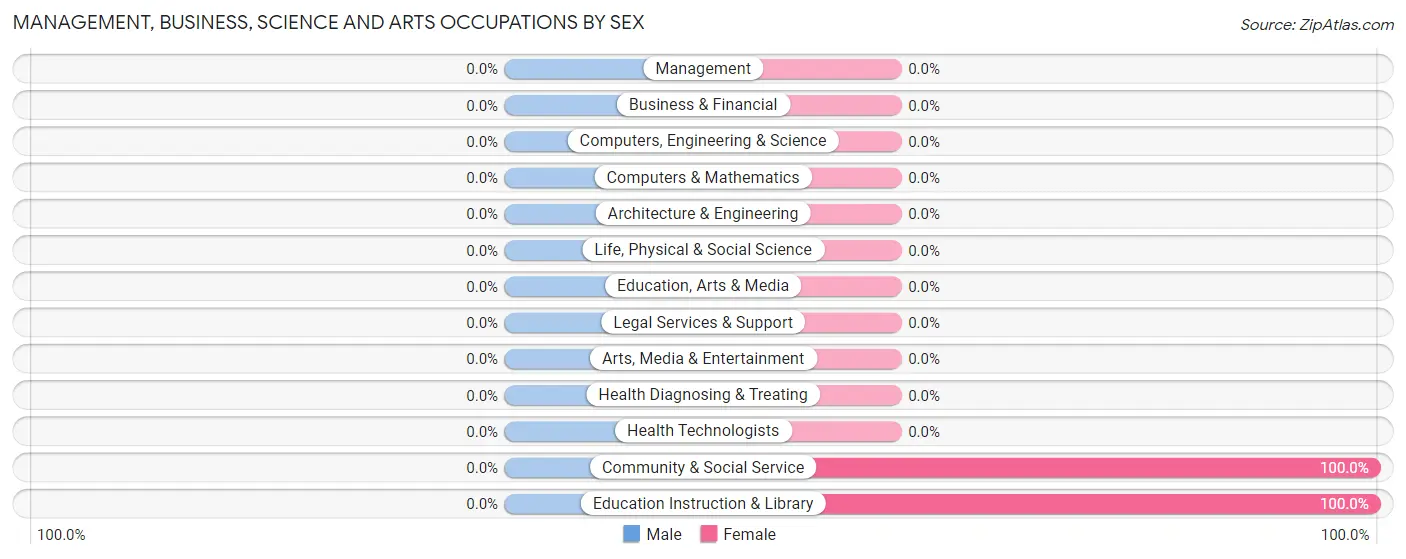
| Occupation | Male | Female |
| Management | 0 (0.0%) | 0 (0.0%) |
| Business & Financial | 0 (0.0%) | 0 (0.0%) |
| Computers, Engineering & Science | 0 (0.0%) | 0 (0.0%) |
| Computers & Mathematics | 0 (0.0%) | 0 (0.0%) |
| Architecture & Engineering | 0 (0.0%) | 0 (0.0%) |
| Life, Physical & Social Science | 0 (0.0%) | 0 (0.0%) |
| Community & Social Service | 0 (0.0%) | 8 (100.0%) |
| Education, Arts & Media | 0 (0.0%) | 0 (0.0%) |
| Legal Services & Support | 0 (0.0%) | 0 (0.0%) |
| Education Instruction & Library | 0 (0.0%) | 8 (100.0%) |
| Arts, Media & Entertainment | 0 (0.0%) | 0 (0.0%) |
| Health Diagnosing & Treating | 0 (0.0%) | 0 (0.0%) |
| Health Technologists | 0 (0.0%) | 0 (0.0%) |
| Total (Category) | 0 (0.0%) | 8 (100.0%) |
| Total (Overall) | 84 (67.7%) | 40 (32.3%) |
Services Occupations
The most common Services occupations in Springdale are Food Preparation & Serving (13 | 10.5%), Cleaning & Maintenance (7 | 5.7%), and Healthcare Support (4 | 3.2%).
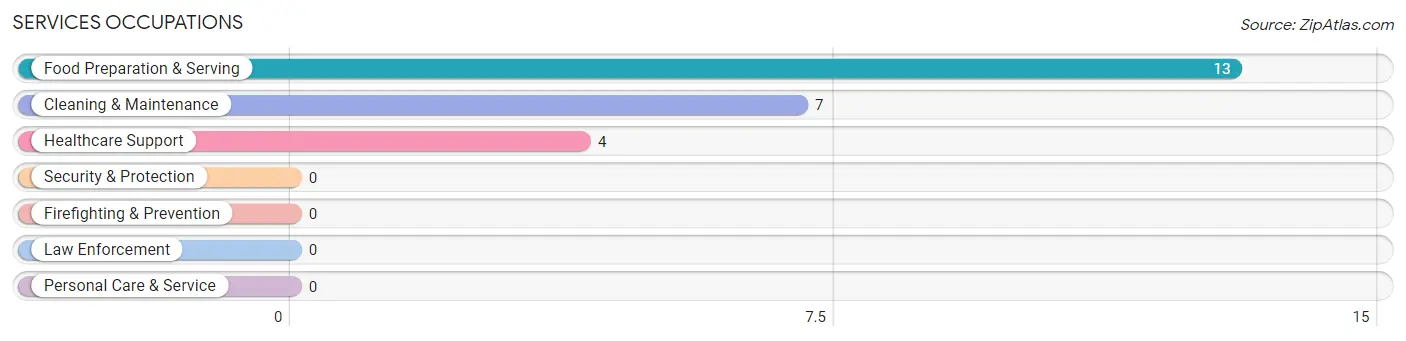
Services Occupations by Sex
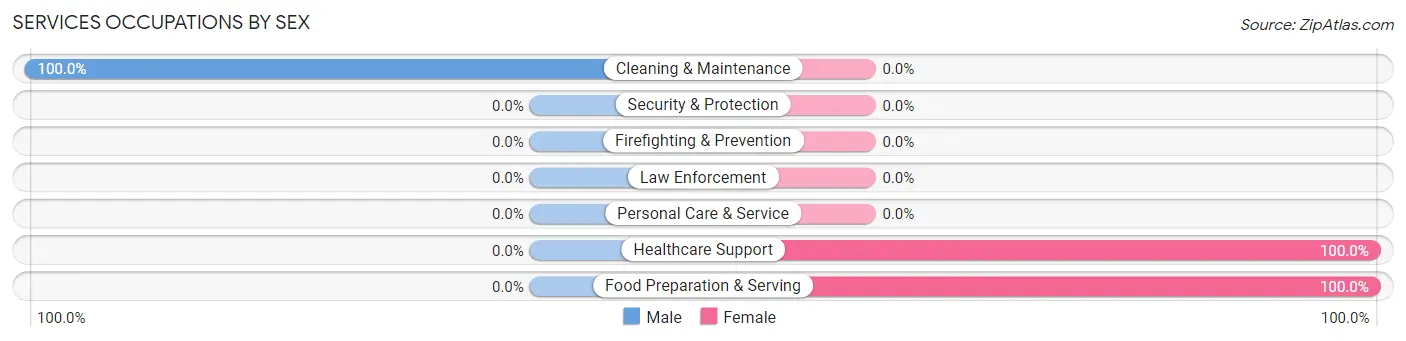
| Occupation | Male | Female |
| Healthcare Support | 0 (0.0%) | 4 (100.0%) |
| Security & Protection | 0 (0.0%) | 0 (0.0%) |
| Firefighting & Prevention | 0 (0.0%) | 0 (0.0%) |
| Law Enforcement | 0 (0.0%) | 0 (0.0%) |
| Food Preparation & Serving | 0 (0.0%) | 13 (100.0%) |
| Cleaning & Maintenance | 7 (100.0%) | 0 (0.0%) |
| Personal Care & Service | 0 (0.0%) | 0 (0.0%) |
| Total (Category) | 7 (29.2%) | 17 (70.8%) |
| Total (Overall) | 84 (67.7%) | 40 (32.3%) |
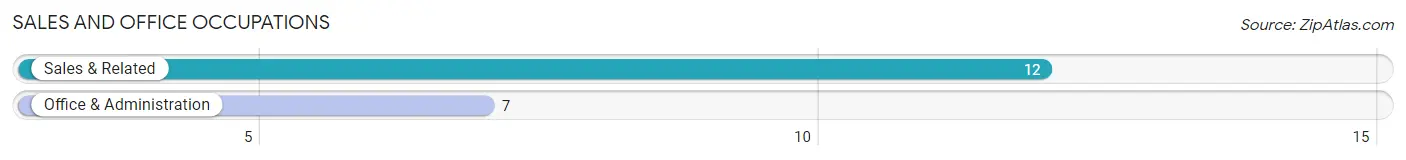
Sales and Office Occupations
The most common Sales and Office occupations in Springdale are Sales & Related (12 | 9.7%), and Office & Administration (7 | 5.7%).
Sales and Office Occupations by Sex
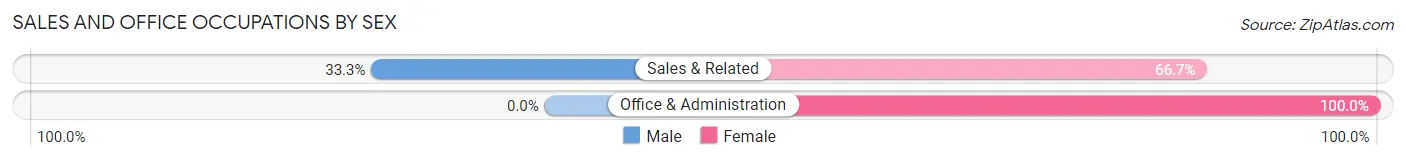
| Occupation | Male | Female |
| Sales & Related | 4 (33.3%) | 8 (66.7%) |
| Office & Administration | 0 (0.0%) | 7 (100.0%) |
| Total (Category) | 4 (21.0%) | 15 (78.9%) |
| Total (Overall) | 84 (67.7%) | 40 (32.3%) |
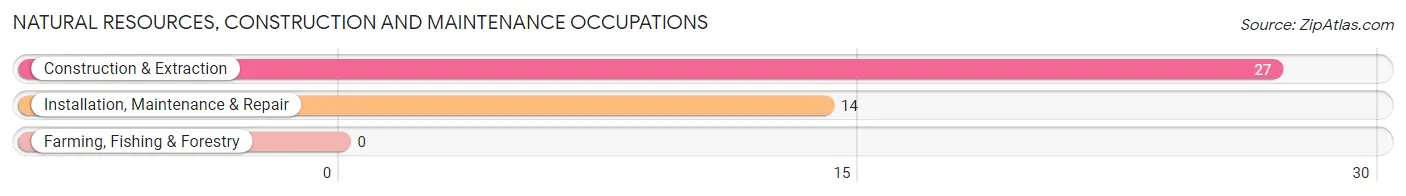
Natural Resources, Construction and Maintenance Occupations
The most common Natural Resources, Construction and Maintenance occupations in Springdale are Construction & Extraction (27 | 21.8%), and Installation, Maintenance & Repair (14 | 11.3%).
Natural Resources, Construction and Maintenance Occupations by Sex
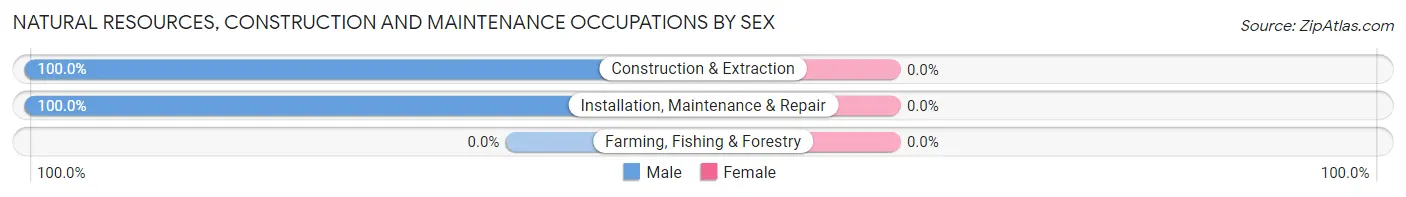
| Occupation | Male | Female |
| Farming, Fishing & Forestry | 0 (0.0%) | 0 (0.0%) |
| Construction & Extraction | 27 (100.0%) | 0 (0.0%) |
| Installation, Maintenance & Repair | 14 (100.0%) | 0 (0.0%) |
| Total (Category) | 41 (100.0%) | 0 (0.0%) |
| Total (Overall) | 84 (67.7%) | 40 (32.3%) |
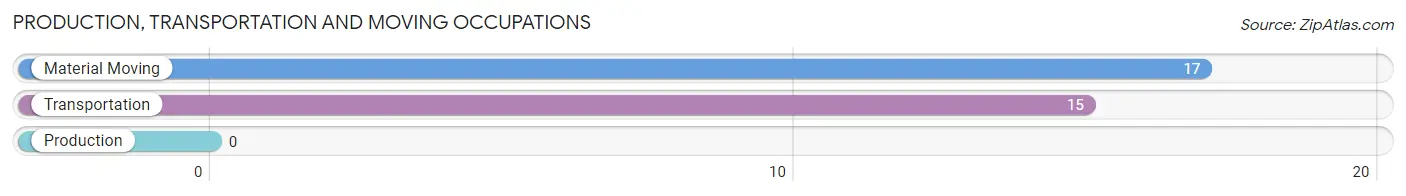
Production, Transportation and Moving Occupations
The most common Production, Transportation and Moving occupations in Springdale are Material Moving (17 | 13.7%), and Transportation (15 | 12.1%).
Production, Transportation and Moving Occupations by Sex
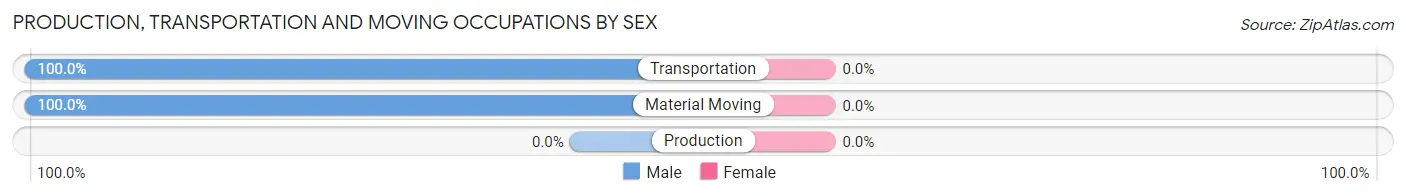
| Occupation | Male | Female |
| Production | 0 (0.0%) | 0 (0.0%) |
| Transportation | 15 (100.0%) | 0 (0.0%) |
| Material Moving | 17 (100.0%) | 0 (0.0%) |
| Total (Category) | 32 (100.0%) | 0 (0.0%) |
| Total (Overall) | 84 (67.7%) | 40 (32.3%) |
Employment Industries by Sex in Springdale
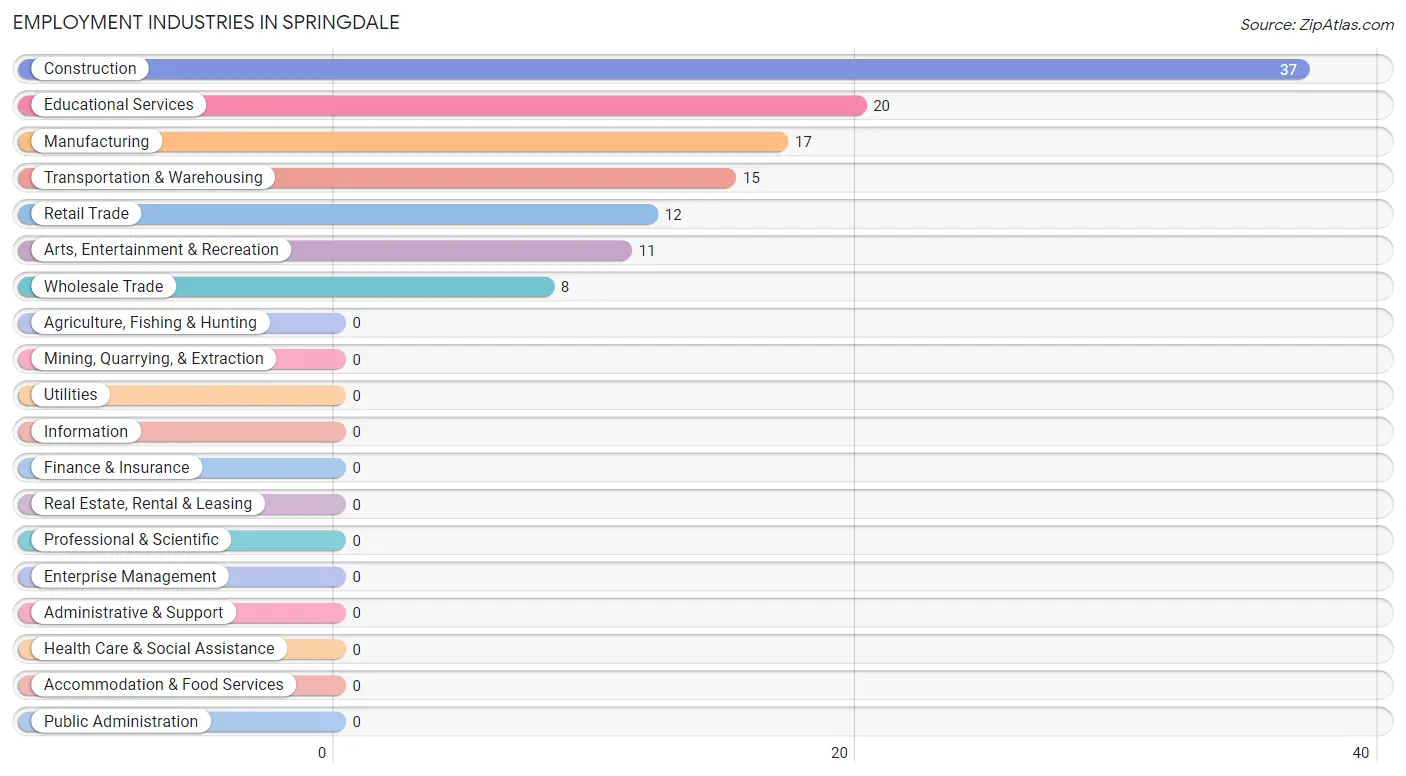
Employment Industries in Springdale
The major employment industries in Springdale include Construction (37 | 29.8%), Educational Services (20 | 16.1%), Manufacturing (17 | 13.7%), Transportation & Warehousing (15 | 12.1%), and Retail Trade (12 | 9.7%).
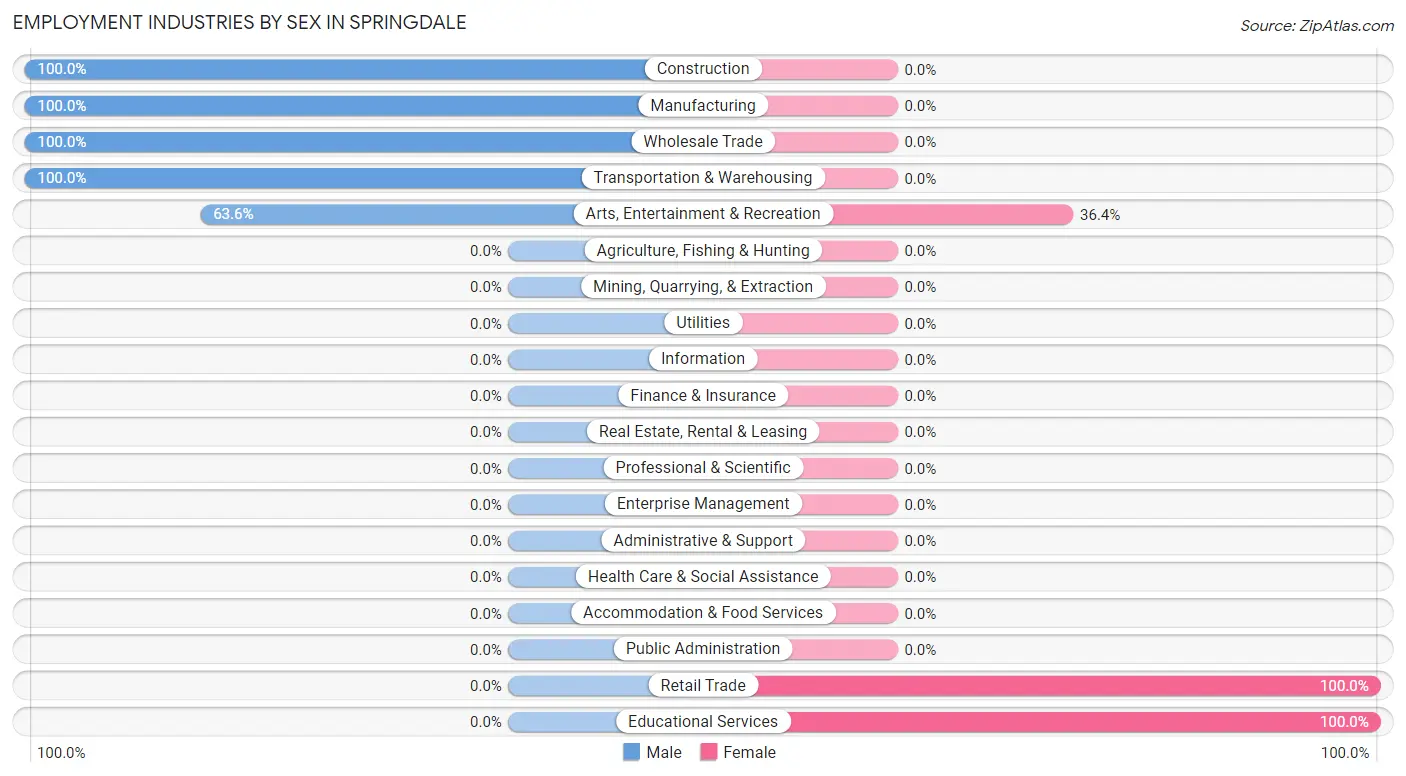
Employment Industries by Sex in Springdale
The Springdale industries that see more men than women are Construction (100.0%), Manufacturing (100.0%), and Wholesale Trade (100.0%), whereas the industries that tend to have a higher number of women are Retail Trade (100.0%), Educational Services (100.0%), and Arts, Entertainment & Recreation (36.4%).
| Industry | Male | Female |
| Agriculture, Fishing & Hunting | 0 (0.0%) | 0 (0.0%) |
| Mining, Quarrying, & Extraction | 0 (0.0%) | 0 (0.0%) |
| Construction | 37 (100.0%) | 0 (0.0%) |
| Manufacturing | 17 (100.0%) | 0 (0.0%) |
| Wholesale Trade | 8 (100.0%) | 0 (0.0%) |
| Retail Trade | 0 (0.0%) | 12 (100.0%) |
| Transportation & Warehousing | 15 (100.0%) | 0 (0.0%) |
| Utilities | 0 (0.0%) | 0 (0.0%) |
| Information | 0 (0.0%) | 0 (0.0%) |
| Finance & Insurance | 0 (0.0%) | 0 (0.0%) |
| Real Estate, Rental & Leasing | 0 (0.0%) | 0 (0.0%) |
| Professional & Scientific | 0 (0.0%) | 0 (0.0%) |
| Enterprise Management | 0 (0.0%) | 0 (0.0%) |
| Administrative & Support | 0 (0.0%) | 0 (0.0%) |
| Educational Services | 0 (0.0%) | 20 (100.0%) |
| Health Care & Social Assistance | 0 (0.0%) | 0 (0.0%) |
| Arts, Entertainment & Recreation | 7 (63.6%) | 4 (36.4%) |
| Accommodation & Food Services | 0 (0.0%) | 0 (0.0%) |
| Public Administration | 0 (0.0%) | 0 (0.0%) |
| Total | 84 (67.7%) | 40 (32.3%) |
Education in Springdale
School Enrollment in Springdale
The most common levels of schooling among the 170 students in Springdale are middle school (72 | 42.3%), high school (51 | 30.0%), and kindergarten (27 | 15.9%).
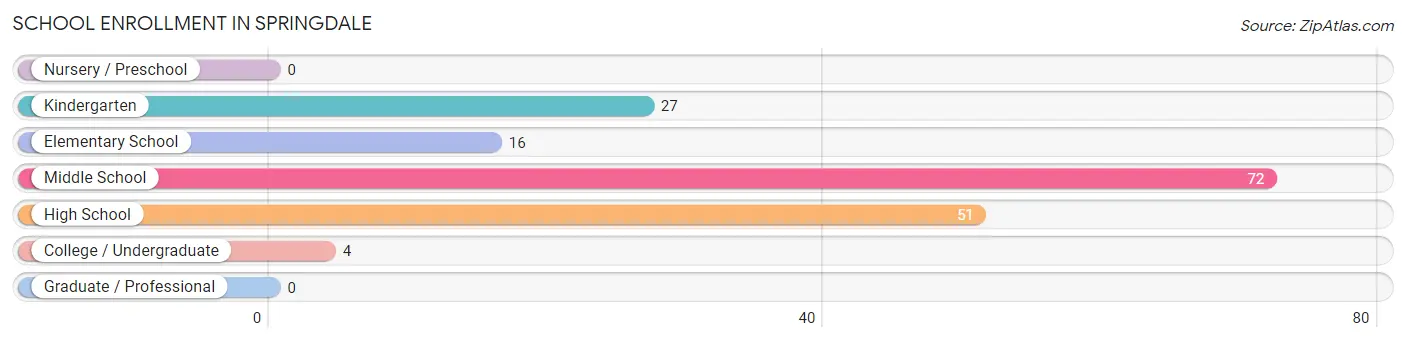
| School Level | # Students | % Students |
| Nursery / Preschool | 0 | 0.0% |
| Kindergarten | 27 | 15.9% |
| Elementary School | 16 | 9.4% |
| Middle School | 72 | 42.3% |
| High School | 51 | 30.0% |
| College / Undergraduate | 4 | 2.4% |
| Graduate / Professional | 0 | 0.0% |
| Total | 170 | 100.0% |
School Enrollment by Age by Funding Source in Springdale
Out of a total of 170 students who are enrolled in schools in Springdale, 7 (4.1%) attend a private institution, while the remaining 163 (95.9%) are enrolled in public schools. The age group of 18 to 19 year olds has the highest likelihood of being enrolled in private schools, with 7 (41.2% in the age bracket) enrolled. Conversely, the age group of 5 to 9 year old has the lowest likelihood of being enrolled in a private school, with 68 (100.0% in the age bracket) attending a public institution.
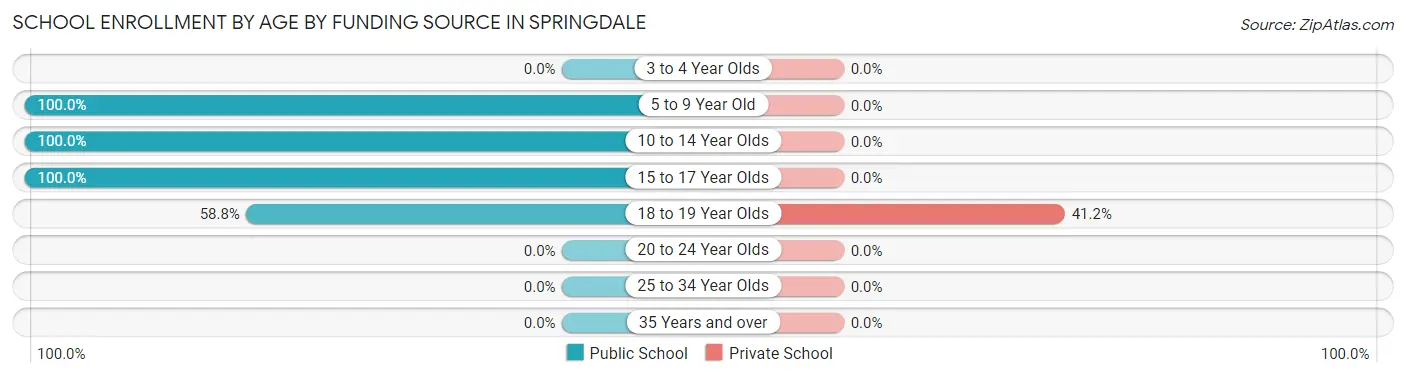
| Age Bracket | Public School | Private School |
| 3 to 4 Year Olds | 0 (0.0%) | 0 (0.0%) |
| 5 to 9 Year Old | 68 (100.0%) | 0 (0.0%) |
| 10 to 14 Year Olds | 74 (100.0%) | 0 (0.0%) |
| 15 to 17 Year Olds | 11 (100.0%) | 0 (0.0%) |
| 18 to 19 Year Olds | 10 (58.8%) | 7 (41.2%) |
| 20 to 24 Year Olds | 0 (0.0%) | 0 (0.0%) |
| 25 to 34 Year Olds | 0 (0.0%) | 0 (0.0%) |
| 35 Years and over | 0 (0.0%) | 0 (0.0%) |
| Total | 163 (95.9%) | 7 (4.1%) |
Educational Attainment by Field of Study in Springdale
Physical & health sciences (7 | 36.8%), communications (5 | 26.3%), liberal arts & history (4 | 21.0%), and education (3 | 15.8%) are the most common fields of study among 19 individuals in Springdale who have obtained a bachelor's degree or higher.
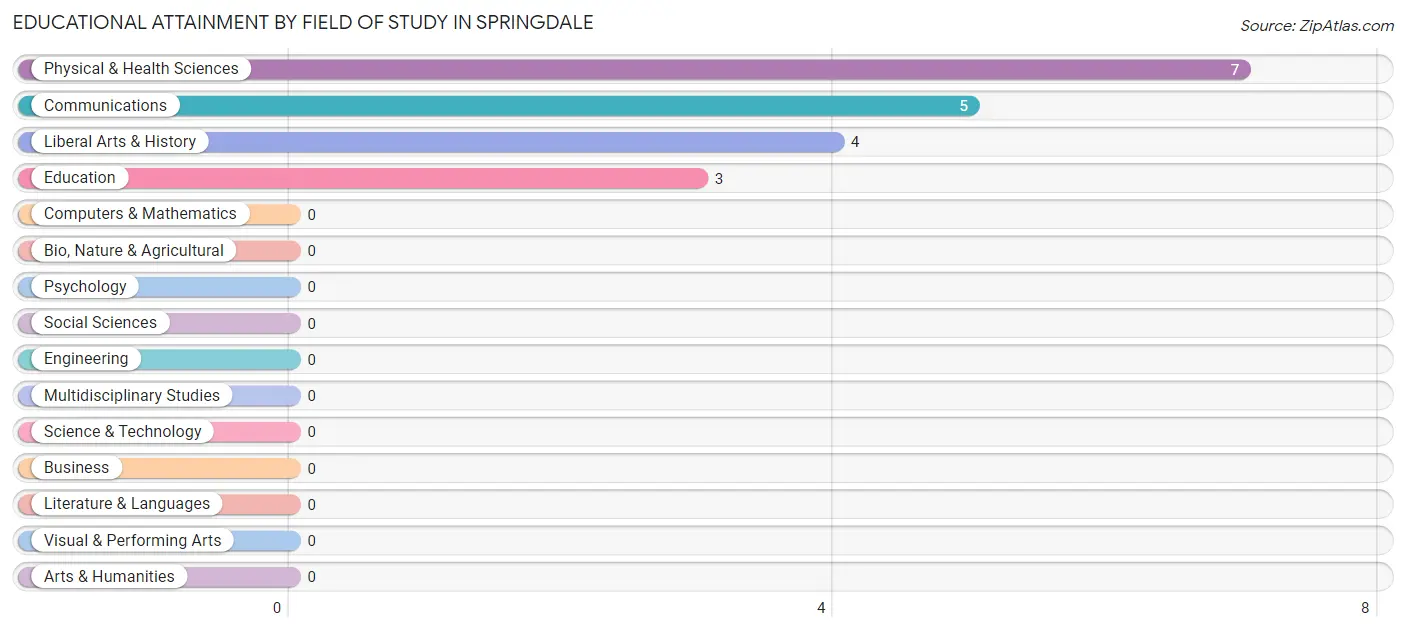
| Field of Study | # Graduates | % Graduates |
| Computers & Mathematics | 0 | 0.0% |
| Bio, Nature & Agricultural | 0 | 0.0% |
| Physical & Health Sciences | 7 | 36.8% |
| Psychology | 0 | 0.0% |
| Social Sciences | 0 | 0.0% |
| Engineering | 0 | 0.0% |
| Multidisciplinary Studies | 0 | 0.0% |
| Science & Technology | 0 | 0.0% |
| Business | 0 | 0.0% |
| Education | 3 | 15.8% |
| Literature & Languages | 0 | 0.0% |
| Liberal Arts & History | 4 | 21.0% |
| Visual & Performing Arts | 0 | 0.0% |
| Communications | 5 | 26.3% |
| Arts & Humanities | 0 | 0.0% |
| Total | 19 | 100.0% |
Transportation & Commute in Springdale
Vehicle Availability by Sex in Springdale
The most prevalent vehicle ownership categories in Springdale are males with 3 vehicles (38, accounting for 52.0%) and females with 3 vehicles (28, making up 95.0%).
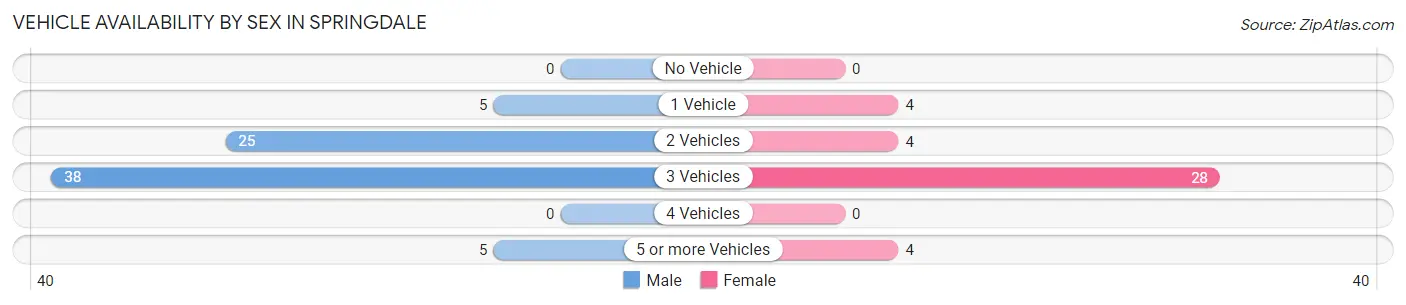
| Vehicles Available | Male | Female |
| No Vehicle | 0 (0.0%) | 0 (0.0%) |
| 1 Vehicle | 5 (6.9%) | 4 (10.0%) |
| 2 Vehicles | 25 (34.3%) | 4 (10.0%) |
| 3 Vehicles | 38 (52.0%) | 28 (70.0%) |
| 4 Vehicles | 0 (0.0%) | 0 (0.0%) |
| 5 or more Vehicles | 5 (6.9%) | 4 (10.0%) |
| Total | 73 (100.0%) | 40 (100.0%) |
Commute Time in Springdale
The most frequently occuring commute durations in Springdale are 60 to 89 minutes (45 commuters, 43.7%), 5 to 9 minutes (17 commuters, 16.5%), and 25 to 29 minutes (17 commuters, 16.5%).
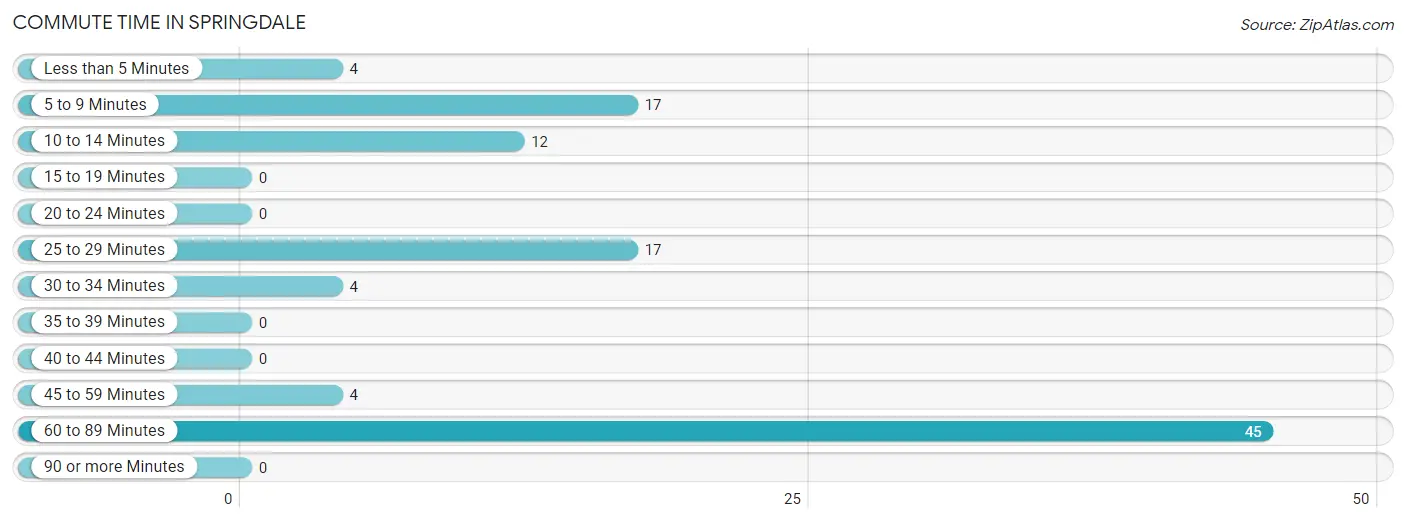
| Commute Time | # Commuters | % Commuters |
| Less than 5 Minutes | 4 | 3.9% |
| 5 to 9 Minutes | 17 | 16.5% |
| 10 to 14 Minutes | 12 | 11.7% |
| 15 to 19 Minutes | 0 | 0.0% |
| 20 to 24 Minutes | 0 | 0.0% |
| 25 to 29 Minutes | 17 | 16.5% |
| 30 to 34 Minutes | 4 | 3.9% |
| 35 to 39 Minutes | 0 | 0.0% |
| 40 to 44 Minutes | 0 | 0.0% |
| 45 to 59 Minutes | 4 | 3.9% |
| 60 to 89 Minutes | 45 | 43.7% |
| 90 or more Minutes | 0 | 0.0% |
Commute Time by Sex in Springdale
The most common commute times in Springdale are 60 to 89 minutes (38 commuters, 60.3%) for males and 5 to 9 minutes (17 commuters, 42.5%) for females.
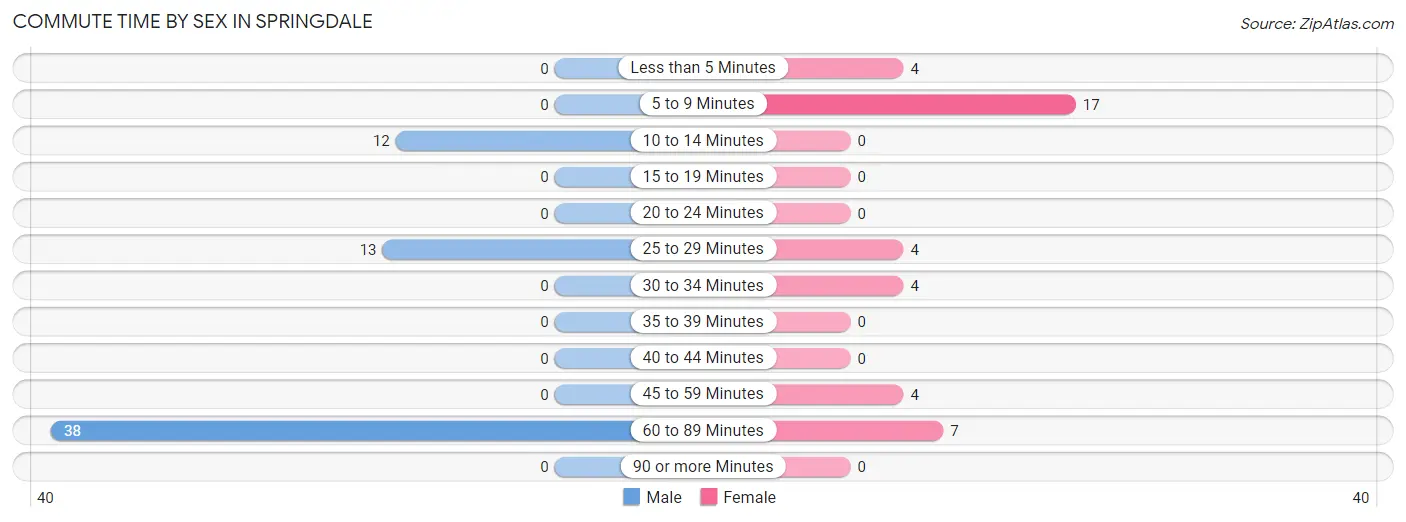
| Commute Time | Male | Female |
| Less than 5 Minutes | 0 (0.0%) | 4 (10.0%) |
| 5 to 9 Minutes | 0 (0.0%) | 17 (42.5%) |
| 10 to 14 Minutes | 12 (19.1%) | 0 (0.0%) |
| 15 to 19 Minutes | 0 (0.0%) | 0 (0.0%) |
| 20 to 24 Minutes | 0 (0.0%) | 0 (0.0%) |
| 25 to 29 Minutes | 13 (20.6%) | 4 (10.0%) |
| 30 to 34 Minutes | 0 (0.0%) | 4 (10.0%) |
| 35 to 39 Minutes | 0 (0.0%) | 0 (0.0%) |
| 40 to 44 Minutes | 0 (0.0%) | 0 (0.0%) |
| 45 to 59 Minutes | 0 (0.0%) | 4 (10.0%) |
| 60 to 89 Minutes | 38 (60.3%) | 7 (17.5%) |
| 90 or more Minutes | 0 (0.0%) | 0 (0.0%) |
Time of Departure to Work by Sex in Springdale
The most frequent times of departure to work in Springdale are 12:00 AM to 4:59 AM (27, 42.9%) for males and 7:30 AM to 7:59 AM (20, 50.0%) for females.
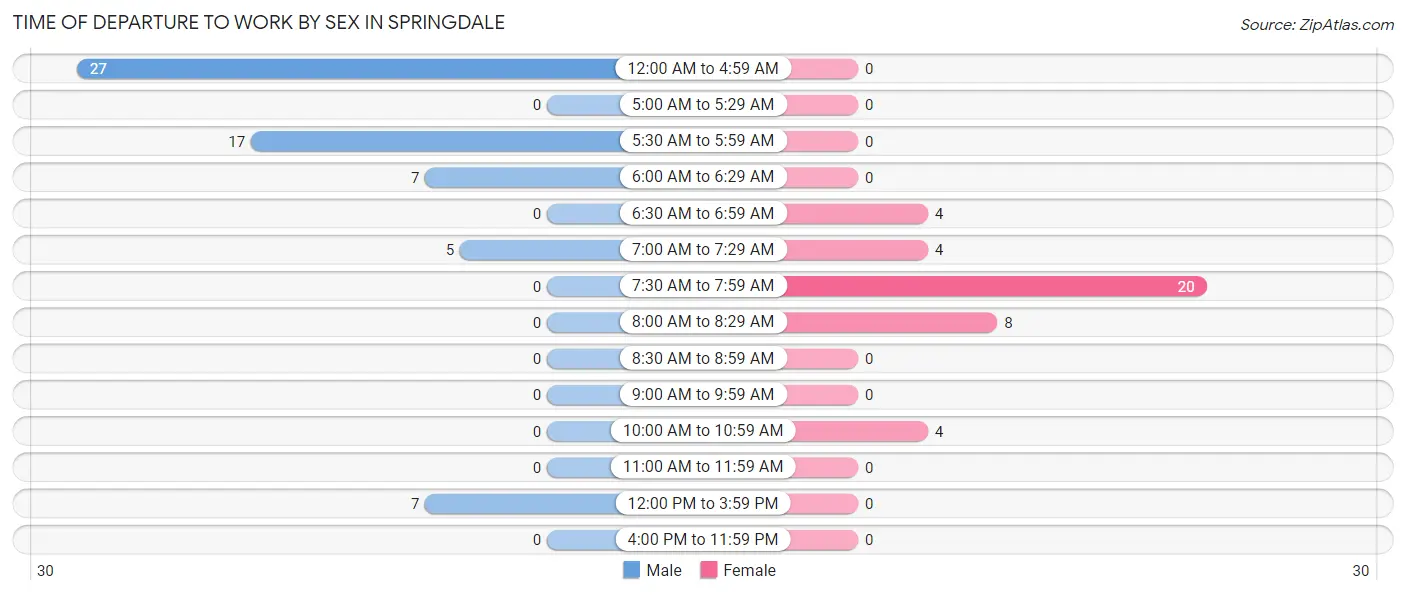
| Time of Departure | Male | Female |
| 12:00 AM to 4:59 AM | 27 (42.9%) | 0 (0.0%) |
| 5:00 AM to 5:29 AM | 0 (0.0%) | 0 (0.0%) |
| 5:30 AM to 5:59 AM | 17 (27.0%) | 0 (0.0%) |
| 6:00 AM to 6:29 AM | 7 (11.1%) | 0 (0.0%) |
| 6:30 AM to 6:59 AM | 0 (0.0%) | 4 (10.0%) |
| 7:00 AM to 7:29 AM | 5 (7.9%) | 4 (10.0%) |
| 7:30 AM to 7:59 AM | 0 (0.0%) | 20 (50.0%) |
| 8:00 AM to 8:29 AM | 0 (0.0%) | 8 (20.0%) |
| 8:30 AM to 8:59 AM | 0 (0.0%) | 0 (0.0%) |
| 9:00 AM to 9:59 AM | 0 (0.0%) | 0 (0.0%) |
| 10:00 AM to 10:59 AM | 0 (0.0%) | 4 (10.0%) |
| 11:00 AM to 11:59 AM | 0 (0.0%) | 0 (0.0%) |
| 12:00 PM to 3:59 PM | 7 (11.1%) | 0 (0.0%) |
| 4:00 PM to 11:59 PM | 0 (0.0%) | 0 (0.0%) |
| Total | 63 (100.0%) | 40 (100.0%) |
Housing Occupancy in Springdale
Occupancy by Ownership in Springdale
Of the total 147 dwellings in Springdale, owner-occupied units account for 98 (66.7%), while renter-occupied units make up 49 (33.3%).
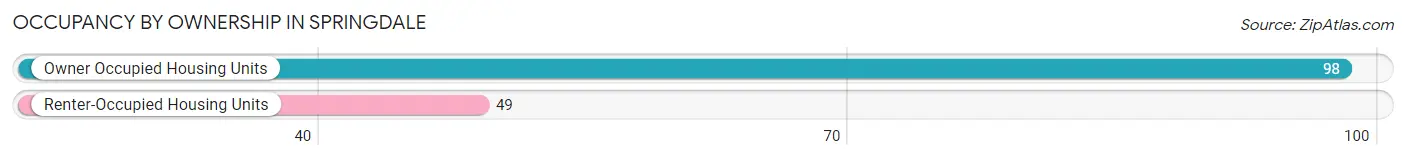
| Occupancy | # Housing Units | % Housing Units |
| Owner Occupied Housing Units | 98 | 66.7% |
| Renter-Occupied Housing Units | 49 | 33.3% |
| Total Occupied Housing Units | 147 | 100.0% |
Occupancy by Household Size in Springdale
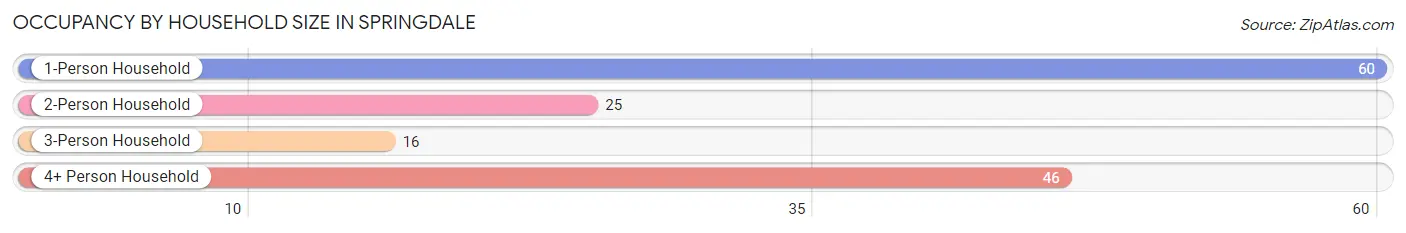
| Household Size | # Housing Units | % Housing Units |
| 1-Person Household | 60 | 40.8% |
| 2-Person Household | 25 | 17.0% |
| 3-Person Household | 16 | 10.9% |
| 4+ Person Household | 46 | 31.3% |
| Total Housing Units | 147 | 100.0% |
Occupancy by Ownership by Household Size in Springdale
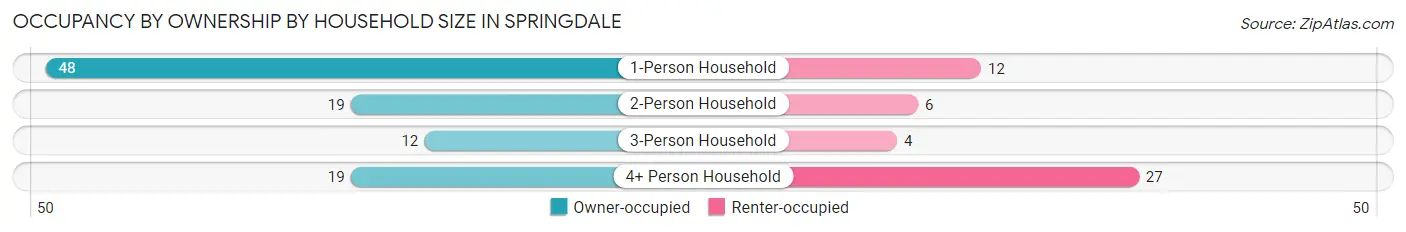
| Household Size | Owner-occupied | Renter-occupied |
| 1-Person Household | 48 (80.0%) | 12 (20.0%) |
| 2-Person Household | 19 (76.0%) | 6 (24.0%) |
| 3-Person Household | 12 (75.0%) | 4 (25.0%) |
| 4+ Person Household | 19 (41.3%) | 27 (58.7%) |
| Total Housing Units | 98 (66.7%) | 49 (33.3%) |
Occupancy by Educational Attainment in Springdale
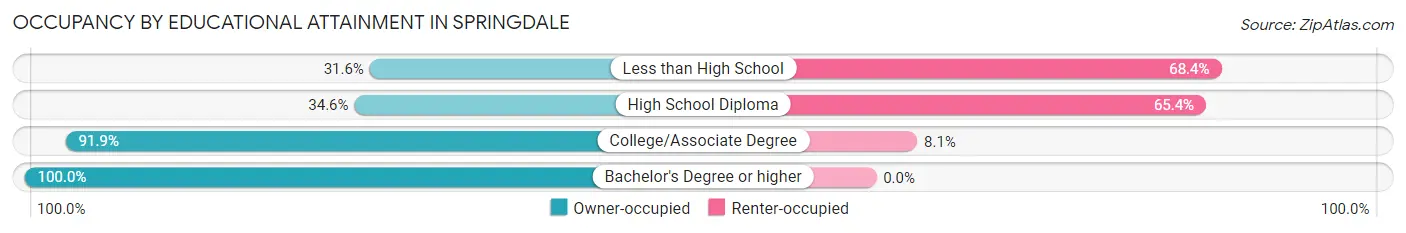
| Household Size | Owner-occupied | Renter-occupied |
| Less than High School | 12 (31.6%) | 26 (68.4%) |
| High School Diploma | 9 (34.6%) | 17 (65.4%) |
| College/Associate Degree | 68 (91.9%) | 6 (8.1%) |
| Bachelor's Degree or higher | 9 (100.0%) | 0 (0.0%) |
Occupancy by Age of Householder in Springdale
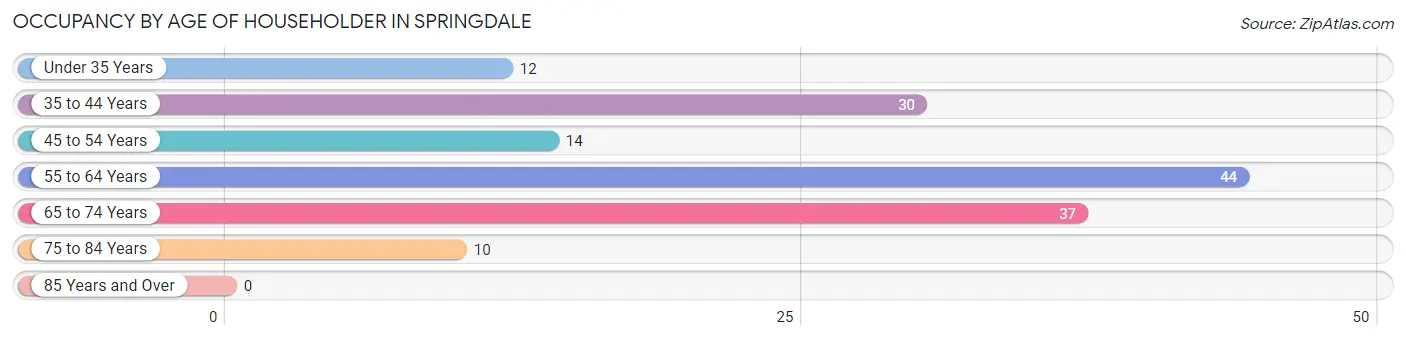
| Age Bracket | # Households | % Households |
| Under 35 Years | 12 | 8.2% |
| 35 to 44 Years | 30 | 20.4% |
| 45 to 54 Years | 14 | 9.5% |
| 55 to 64 Years | 44 | 29.9% |
| 65 to 74 Years | 37 | 25.2% |
| 75 to 84 Years | 10 | 6.8% |
| 85 Years and Over | 0 | 0.0% |
| Total | 147 | 100.0% |
Housing Finances in Springdale
Median Income by Occupancy in Springdale
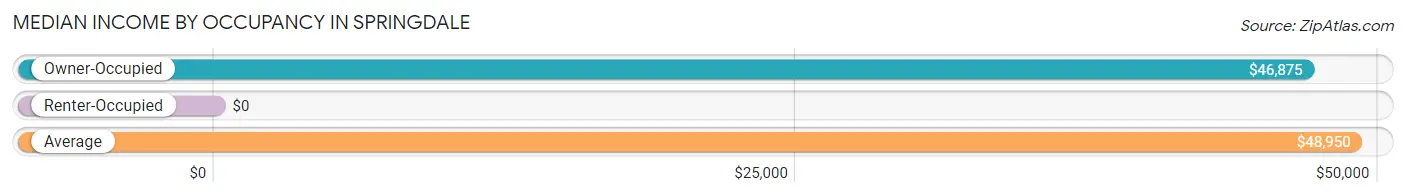
| Occupancy Type | # Households | Median Income |
| Owner-Occupied | 98 (66.7%) | $46,875 |
| Renter-Occupied | 49 (33.3%) | $0 |
| Average | 147 (100.0%) | $48,950 |
Occupancy by Householder Income Bracket in Springdale
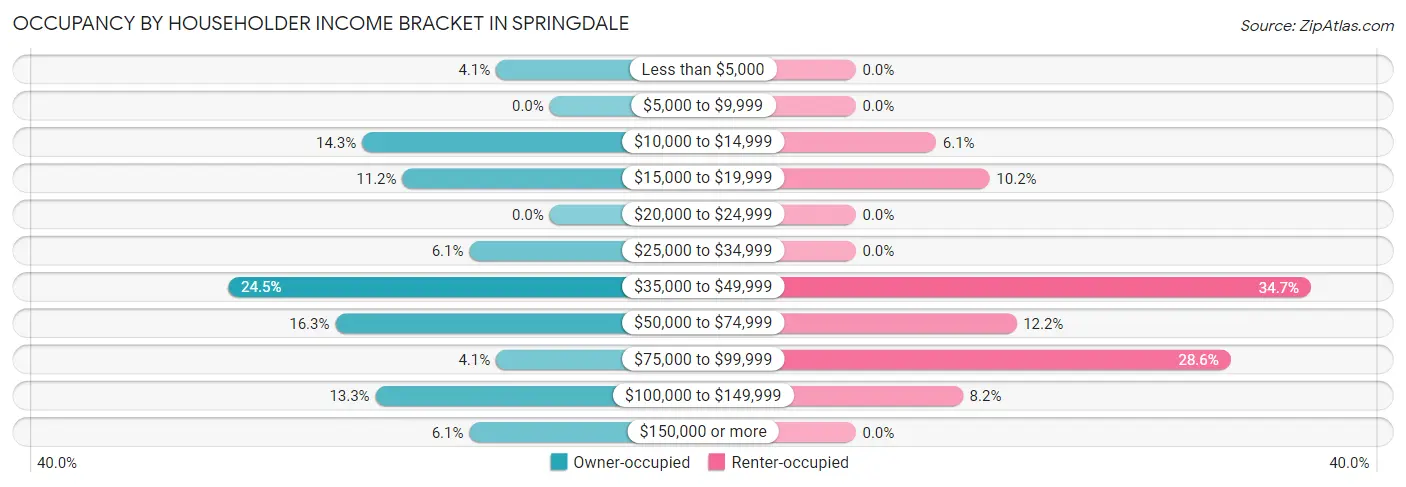
| Income Bracket | Owner-occupied | Renter-occupied |
| Less than $5,000 | 4 (4.1%) | 0 (0.0%) |
| $5,000 to $9,999 | 0 (0.0%) | 0 (0.0%) |
| $10,000 to $14,999 | 14 (14.3%) | 3 (6.1%) |
| $15,000 to $19,999 | 11 (11.2%) | 5 (10.2%) |
| $20,000 to $24,999 | 0 (0.0%) | 0 (0.0%) |
| $25,000 to $34,999 | 6 (6.1%) | 0 (0.0%) |
| $35,000 to $49,999 | 24 (24.5%) | 17 (34.7%) |
| $50,000 to $74,999 | 16 (16.3%) | 6 (12.2%) |
| $75,000 to $99,999 | 4 (4.1%) | 14 (28.6%) |
| $100,000 to $149,999 | 13 (13.3%) | 4 (8.2%) |
| $150,000 or more | 6 (6.1%) | 0 (0.0%) |
| Total | 98 (100.0%) | 49 (100.0%) |
Monthly Housing Cost Tiers in Springdale
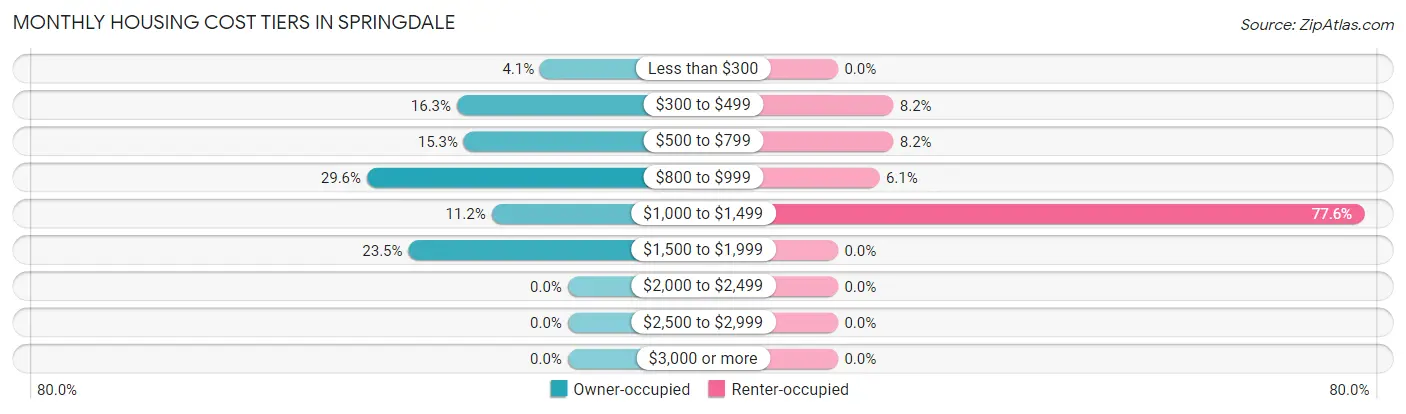
| Monthly Cost | Owner-occupied | Renter-occupied |
| Less than $300 | 4 (4.1%) | 0 (0.0%) |
| $300 to $499 | 16 (16.3%) | 4 (8.2%) |
| $500 to $799 | 15 (15.3%) | 4 (8.2%) |
| $800 to $999 | 29 (29.6%) | 3 (6.1%) |
| $1,000 to $1,499 | 11 (11.2%) | 38 (77.5%) |
| $1,500 to $1,999 | 23 (23.5%) | 0 (0.0%) |
| $2,000 to $2,499 | 0 (0.0%) | 0 (0.0%) |
| $2,500 to $2,999 | 0 (0.0%) | 0 (0.0%) |
| $3,000 or more | 0 (0.0%) | 0 (0.0%) |
| Total | 98 (100.0%) | 49 (100.0%) |
Physical Housing Characteristics in Springdale
Housing Structures in Springdale
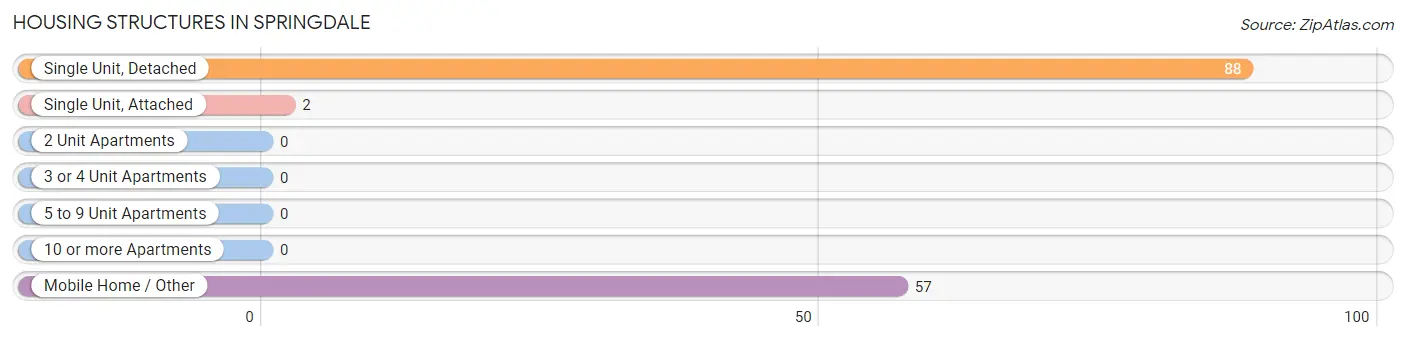
| Structure Type | # Housing Units | % Housing Units |
| Single Unit, Detached | 88 | 59.9% |
| Single Unit, Attached | 2 | 1.4% |
| 2 Unit Apartments | 0 | 0.0% |
| 3 or 4 Unit Apartments | 0 | 0.0% |
| 5 to 9 Unit Apartments | 0 | 0.0% |
| 10 or more Apartments | 0 | 0.0% |
| Mobile Home / Other | 57 | 38.8% |
| Total | 147 | 100.0% |
Housing Structures by Occupancy in Springdale
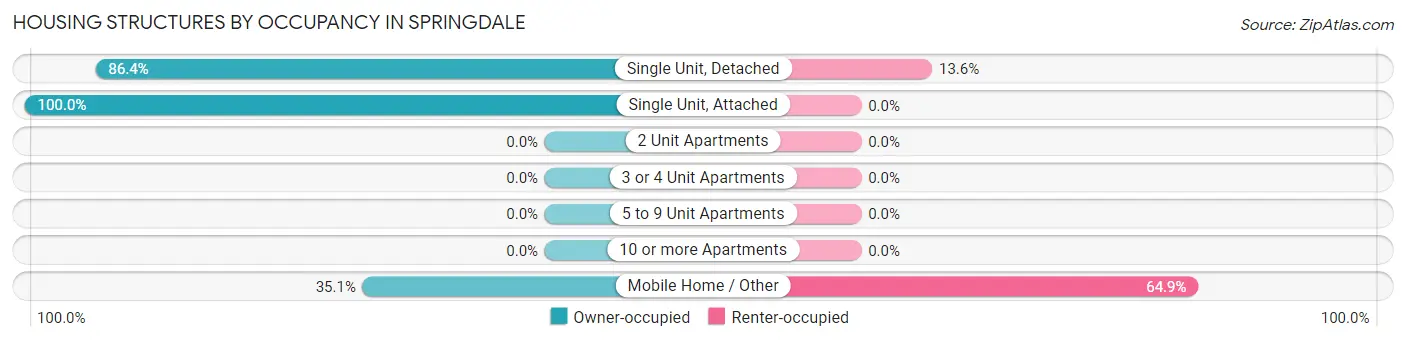
| Structure Type | Owner-occupied | Renter-occupied |
| Single Unit, Detached | 76 (86.4%) | 12 (13.6%) |
| Single Unit, Attached | 2 (100.0%) | 0 (0.0%) |
| 2 Unit Apartments | 0 (0.0%) | 0 (0.0%) |
| 3 or 4 Unit Apartments | 0 (0.0%) | 0 (0.0%) |
| 5 to 9 Unit Apartments | 0 (0.0%) | 0 (0.0%) |
| 10 or more Apartments | 0 (0.0%) | 0 (0.0%) |
| Mobile Home / Other | 20 (35.1%) | 37 (64.9%) |
| Total | 98 (66.7%) | 49 (33.3%) |
Housing Structures by Number of Rooms in Springdale
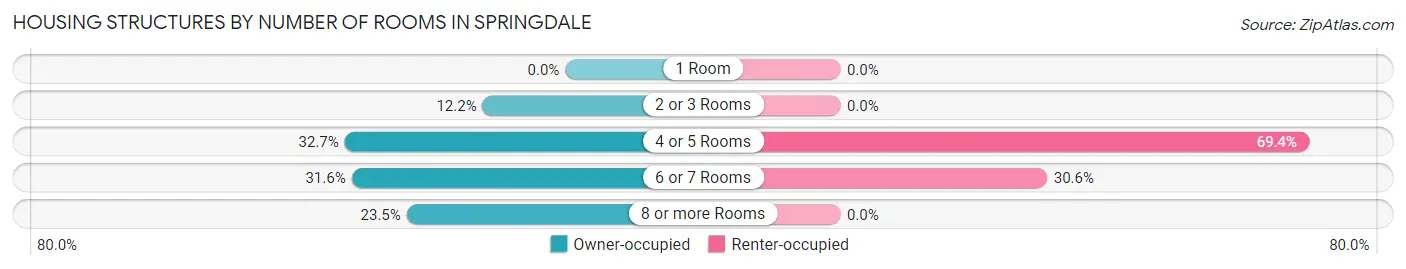
| Number of Rooms | Owner-occupied | Renter-occupied |
| 1 Room | 0 (0.0%) | 0 (0.0%) |
| 2 or 3 Rooms | 12 (12.2%) | 0 (0.0%) |
| 4 or 5 Rooms | 32 (32.7%) | 34 (69.4%) |
| 6 or 7 Rooms | 31 (31.6%) | 15 (30.6%) |
| 8 or more Rooms | 23 (23.5%) | 0 (0.0%) |
| Total | 98 (100.0%) | 49 (100.0%) |
Housing Structure by Heating Type in Springdale
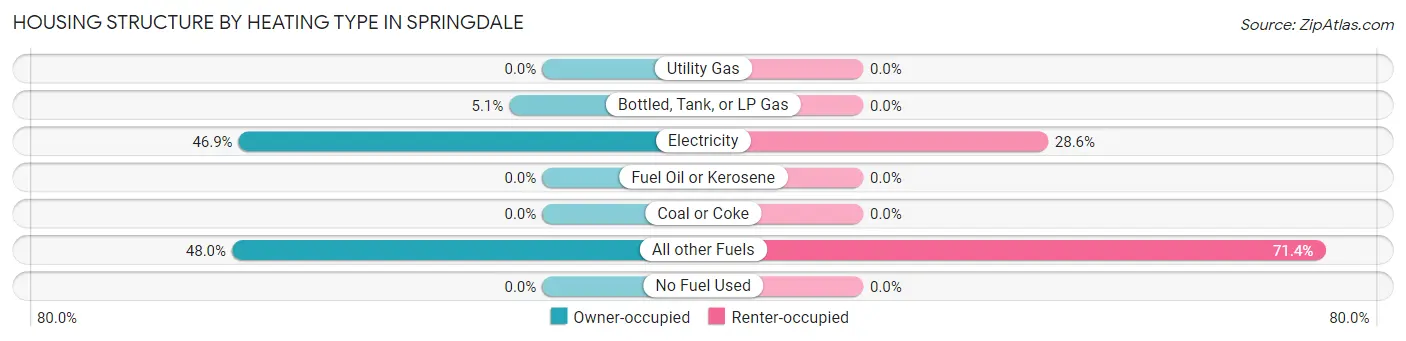
| Heating Type | Owner-occupied | Renter-occupied |
| Utility Gas | 0 (0.0%) | 0 (0.0%) |
| Bottled, Tank, or LP Gas | 5 (5.1%) | 0 (0.0%) |
| Electricity | 46 (46.9%) | 14 (28.6%) |
| Fuel Oil or Kerosene | 0 (0.0%) | 0 (0.0%) |
| Coal or Coke | 0 (0.0%) | 0 (0.0%) |
| All other Fuels | 47 (48.0%) | 35 (71.4%) |
| No Fuel Used | 0 (0.0%) | 0 (0.0%) |
| Total | 98 (100.0%) | 49 (100.0%) |
Household Vehicle Usage in Springdale
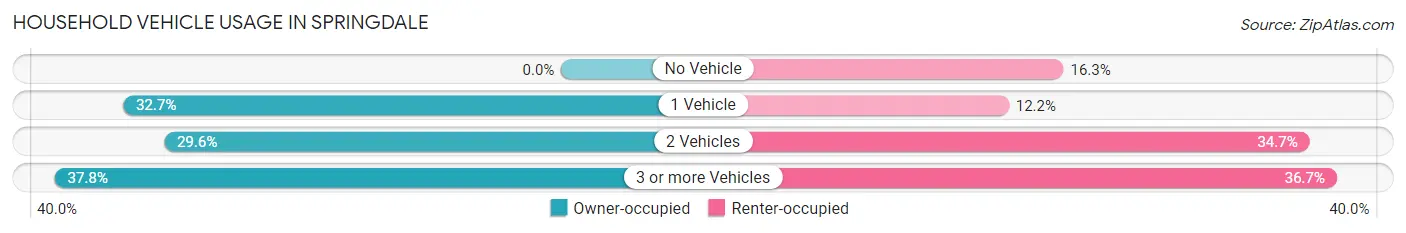
| Vehicles per Household | Owner-occupied | Renter-occupied |
| No Vehicle | 0 (0.0%) | 8 (16.3%) |
| 1 Vehicle | 32 (32.7%) | 6 (12.2%) |
| 2 Vehicles | 29 (29.6%) | 17 (34.7%) |
| 3 or more Vehicles | 37 (37.8%) | 18 (36.7%) |
| Total | 98 (100.0%) | 49 (100.0%) |
Real Estate & Mortgages in Springdale
Real Estate and Mortgage Overview in Springdale
| Characteristic | Without Mortgage | With Mortgage |
| Housing Units | 42 | 56 |
| Median Property Value | $123,800 | $162,500 |
| Median Household Income | $34,500 | $6 |
| Monthly Housing Costs | $508 | $0 |
| Real Estate Taxes | $967 | $0 |
Property Value by Mortgage Status in Springdale
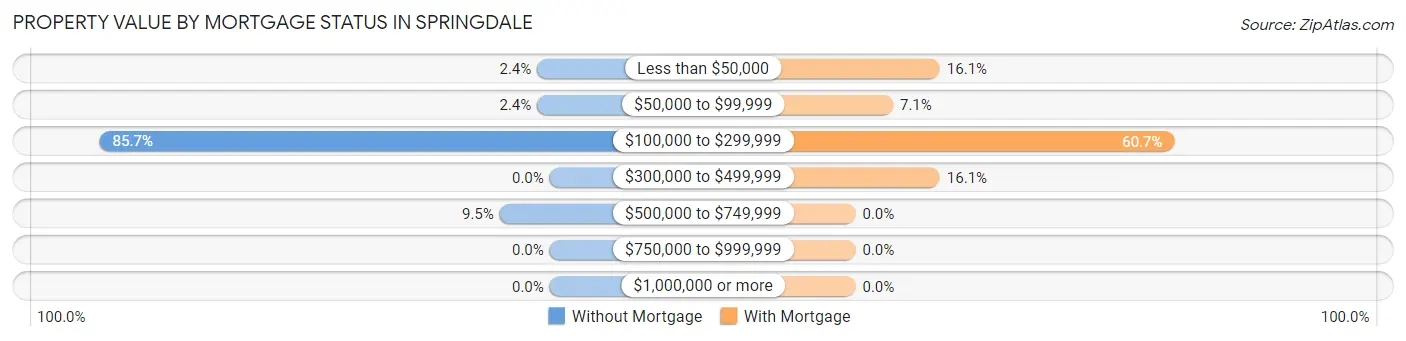
| Property Value | Without Mortgage | With Mortgage |
| Less than $50,000 | 1 (2.4%) | 9 (16.1%) |
| $50,000 to $99,999 | 1 (2.4%) | 4 (7.1%) |
| $100,000 to $299,999 | 36 (85.7%) | 34 (60.7%) |
| $300,000 to $499,999 | 0 (0.0%) | 9 (16.1%) |
| $500,000 to $749,999 | 4 (9.5%) | 0 (0.0%) |
| $750,000 to $999,999 | 0 (0.0%) | 0 (0.0%) |
| $1,000,000 or more | 0 (0.0%) | 0 (0.0%) |
| Total | 42 (100.0%) | 56 (100.0%) |
Household Income by Mortgage Status in Springdale
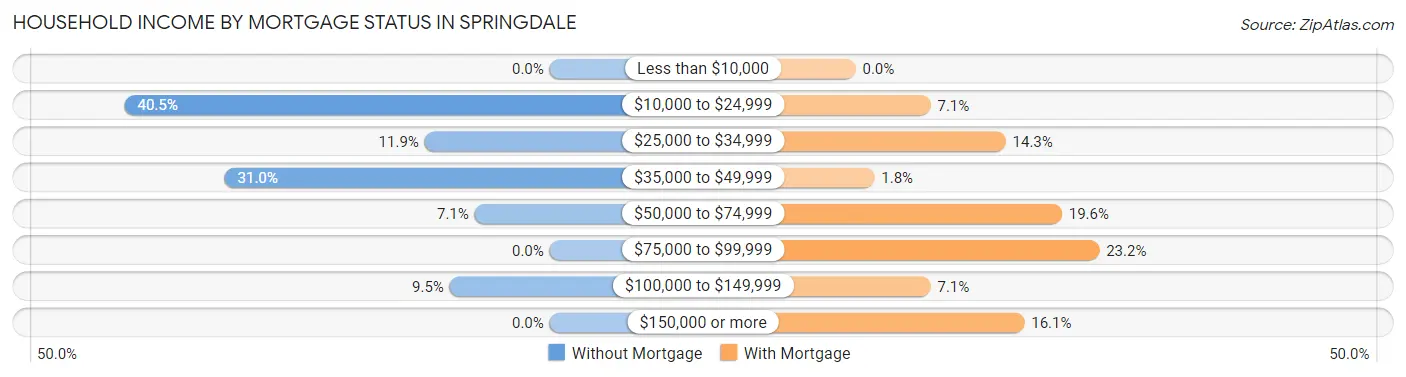
| Household Income | Without Mortgage | With Mortgage |
| Less than $10,000 | 0 (0.0%) | 0 (0.0%) |
| $10,000 to $24,999 | 17 (40.5%) | 4 (7.1%) |
| $25,000 to $34,999 | 5 (11.9%) | 8 (14.3%) |
| $35,000 to $49,999 | 13 (30.9%) | 1 (1.8%) |
| $50,000 to $74,999 | 3 (7.1%) | 11 (19.6%) |
| $75,000 to $99,999 | 0 (0.0%) | 13 (23.2%) |
| $100,000 to $149,999 | 4 (9.5%) | 4 (7.1%) |
| $150,000 or more | 0 (0.0%) | 9 (16.1%) |
| Total | 42 (100.0%) | 56 (100.0%) |
Property Value to Household Income Ratio in Springdale
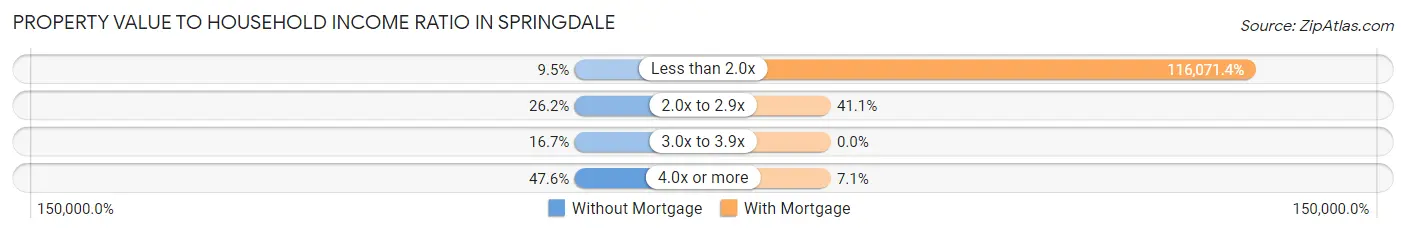
| Value-to-Income Ratio | Without Mortgage | With Mortgage |
| Less than 2.0x | 4 (9.5%) | 65,000 (116,071.4%) |
| 2.0x to 2.9x | 11 (26.2%) | 23 (41.1%) |
| 3.0x to 3.9x | 7 (16.7%) | 0 (0.0%) |
| 4.0x or more | 20 (47.6%) | 4 (7.1%) |
| Total | 42 (100.0%) | 56 (100.0%) |
Real Estate Taxes by Mortgage Status in Springdale
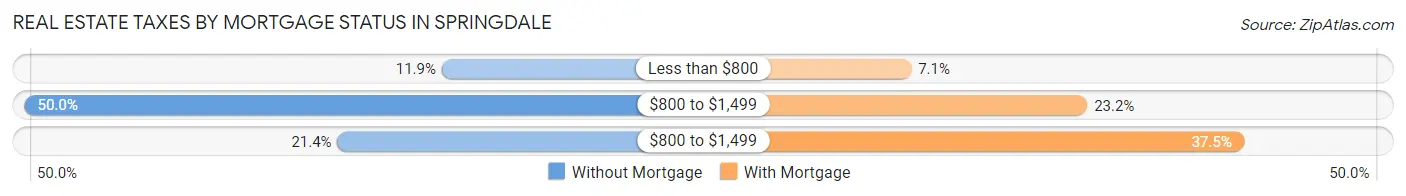
| Property Taxes | Without Mortgage | With Mortgage |
| Less than $800 | 5 (11.9%) | 4 (7.1%) |
| $800 to $1,499 | 21 (50.0%) | 13 (23.2%) |
| $800 to $1,499 | 9 (21.4%) | 21 (37.5%) |
| Total | 42 (100.0%) | 56 (100.0%) |
Health & Disability in Springdale
Health Insurance Coverage by Age in Springdale
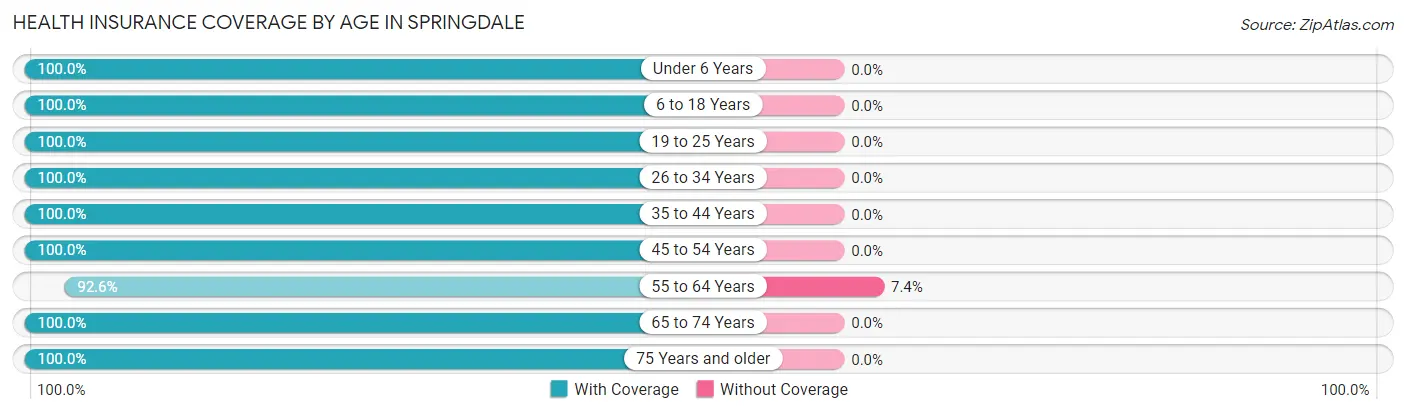
| Age Bracket | With Coverage | Without Coverage |
| Under 6 Years | 91 (100.0%) | 0 (0.0%) |
| 6 to 18 Years | 149 (100.0%) | 0 (0.0%) |
| 19 to 25 Years | 40 (100.0%) | 0 (0.0%) |
| 26 to 34 Years | 34 (100.0%) | 0 (0.0%) |
| 35 to 44 Years | 45 (100.0%) | 0 (0.0%) |
| 45 to 54 Years | 31 (100.0%) | 0 (0.0%) |
| 55 to 64 Years | 50 (92.6%) | 4 (7.4%) |
| 65 to 74 Years | 50 (100.0%) | 0 (0.0%) |
| 75 Years and older | 19 (100.0%) | 0 (0.0%) |
| Total | 509 (99.2%) | 4 (0.8%) |
Health Insurance Coverage by Citizenship Status in Springdale
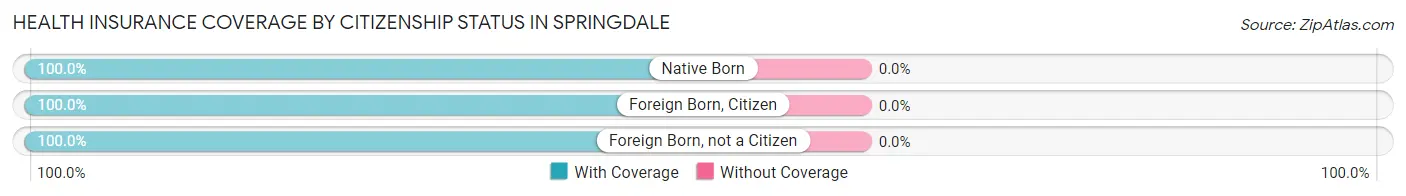
| Citizenship Status | With Coverage | Without Coverage |
| Native Born | 91 (100.0%) | 0 (0.0%) |
| Foreign Born, Citizen | 149 (100.0%) | 0 (0.0%) |
| Foreign Born, not a Citizen | 40 (100.0%) | 0 (0.0%) |
Health Insurance Coverage by Household Income in Springdale
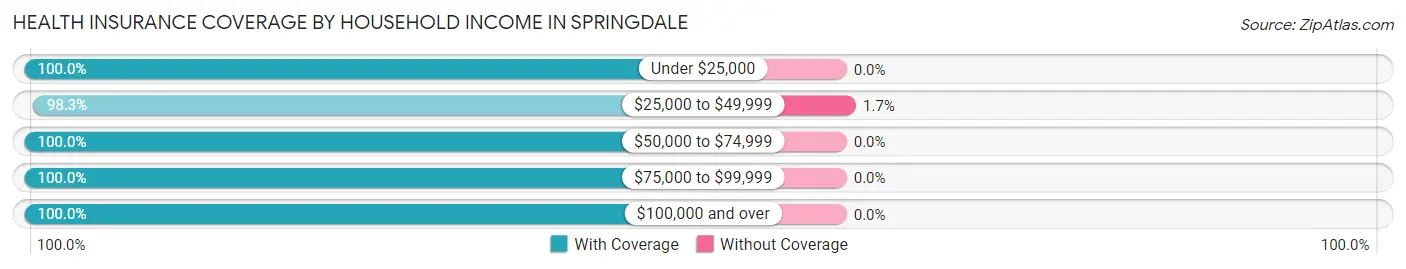
| Household Income | With Coverage | Without Coverage |
| Under $25,000 | 85 (100.0%) | 0 (0.0%) |
| $25,000 to $49,999 | 226 (98.3%) | 4 (1.7%) |
| $50,000 to $74,999 | 65 (100.0%) | 0 (0.0%) |
| $75,000 to $99,999 | 46 (100.0%) | 0 (0.0%) |
| $100,000 and over | 87 (100.0%) | 0 (0.0%) |
Public vs Private Health Insurance Coverage by Age in Springdale
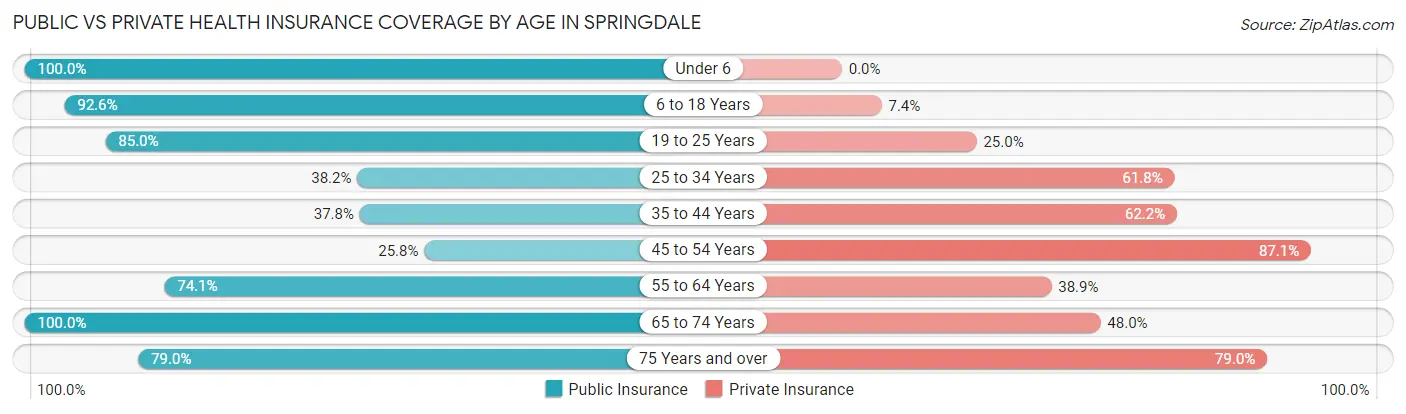
| Age Bracket | Public Insurance | Private Insurance |
| Under 6 | 91 (100.0%) | 0 (0.0%) |
| 6 to 18 Years | 138 (92.6%) | 11 (7.4%) |
| 19 to 25 Years | 34 (85.0%) | 10 (25.0%) |
| 25 to 34 Years | 13 (38.2%) | 21 (61.8%) |
| 35 to 44 Years | 17 (37.8%) | 28 (62.2%) |
| 45 to 54 Years | 8 (25.8%) | 27 (87.1%) |
| 55 to 64 Years | 40 (74.1%) | 21 (38.9%) |
| 65 to 74 Years | 50 (100.0%) | 24 (48.0%) |
| 75 Years and over | 15 (78.9%) | 15 (78.9%) |
| Total | 406 (79.1%) | 157 (30.6%) |
Disability Status by Sex by Age in Springdale
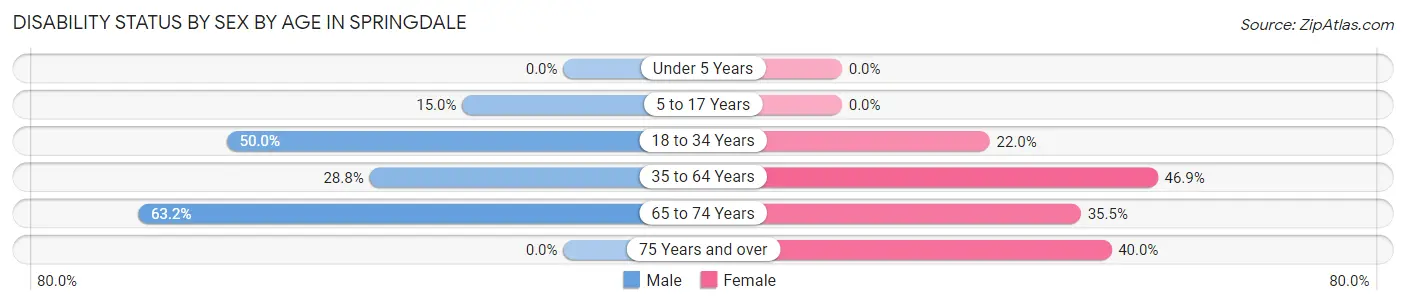
| Age Bracket | Male | Female |
| Under 5 Years | 0 (0.0%) | 0 (0.0%) |
| 5 to 17 Years | 12 (15.0%) | 0 (0.0%) |
| 18 to 34 Years | 23 (50.0%) | 9 (22.0%) |
| 35 to 64 Years | 19 (28.8%) | 30 (46.9%) |
| 65 to 74 Years | 12 (63.2%) | 11 (35.5%) |
| 75 Years and over | 0 (0.0%) | 4 (40.0%) |
Disability Class by Sex by Age in Springdale
Disability Class: Hearing Difficulty
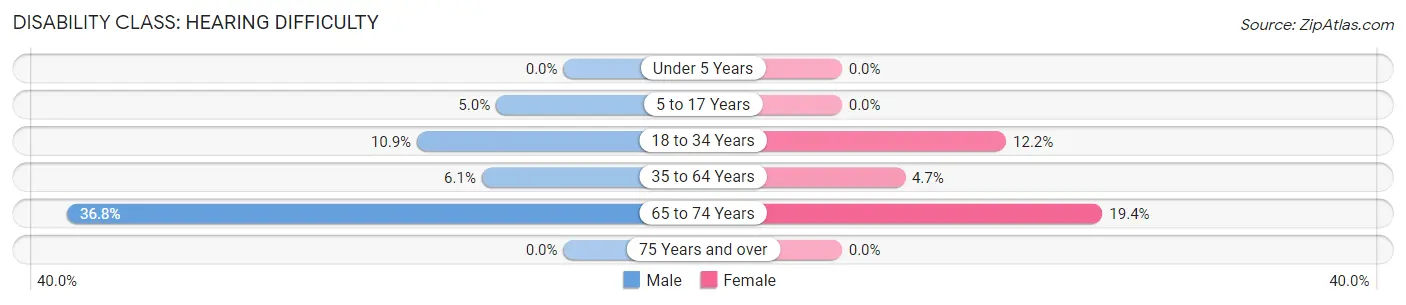
| Age Bracket | Male | Female |
| Under 5 Years | 0 (0.0%) | 0 (0.0%) |
| 5 to 17 Years | 4 (5.0%) | 0 (0.0%) |
| 18 to 34 Years | 5 (10.9%) | 5 (12.2%) |
| 35 to 64 Years | 4 (6.1%) | 3 (4.7%) |
| 65 to 74 Years | 7 (36.8%) | 6 (19.4%) |
| 75 Years and over | 0 (0.0%) | 0 (0.0%) |
Disability Class: Vision Difficulty
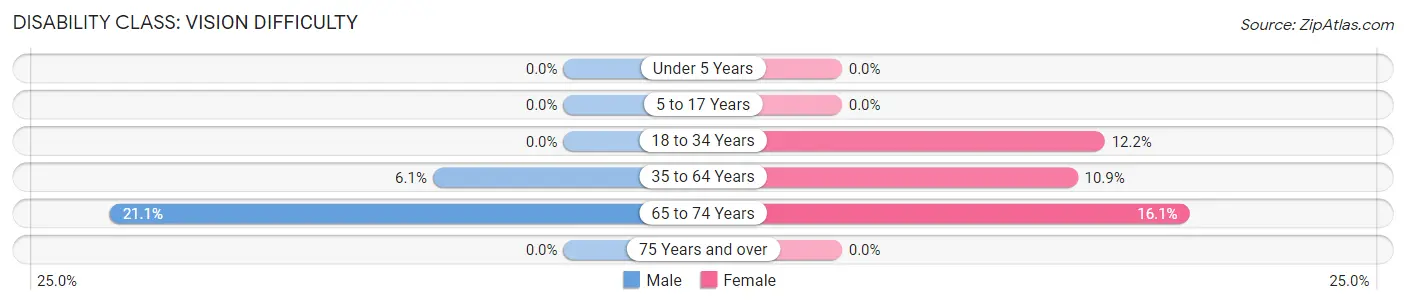
| Age Bracket | Male | Female |
| Under 5 Years | 0 (0.0%) | 0 (0.0%) |
| 5 to 17 Years | 0 (0.0%) | 0 (0.0%) |
| 18 to 34 Years | 0 (0.0%) | 5 (12.2%) |
| 35 to 64 Years | 4 (6.1%) | 7 (10.9%) |
| 65 to 74 Years | 4 (21.0%) | 5 (16.1%) |
| 75 Years and over | 0 (0.0%) | 0 (0.0%) |
Disability Class: Cognitive Difficulty
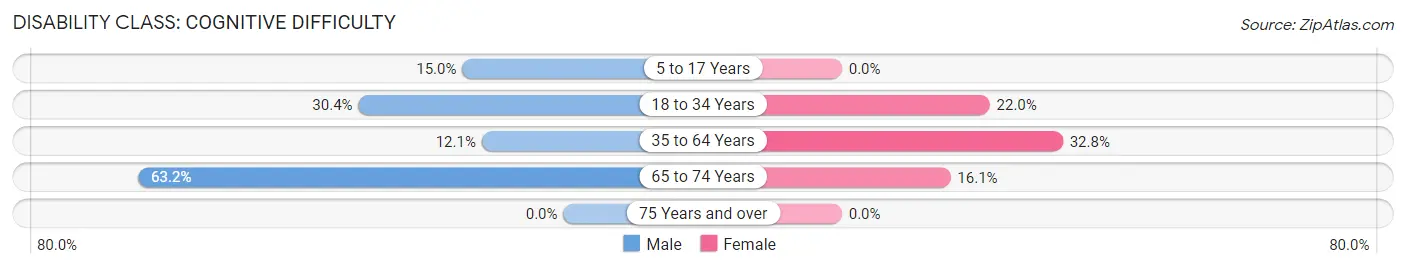
| Age Bracket | Male | Female |
| 5 to 17 Years | 12 (15.0%) | 0 (0.0%) |
| 18 to 34 Years | 14 (30.4%) | 9 (22.0%) |
| 35 to 64 Years | 8 (12.1%) | 21 (32.8%) |
| 65 to 74 Years | 12 (63.2%) | 5 (16.1%) |
| 75 Years and over | 0 (0.0%) | 0 (0.0%) |
Disability Class: Ambulatory Difficulty
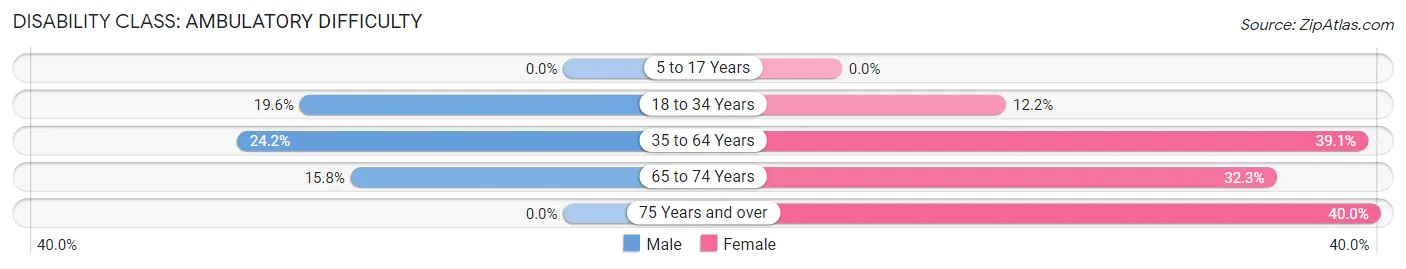
| Age Bracket | Male | Female |
| 5 to 17 Years | 0 (0.0%) | 0 (0.0%) |
| 18 to 34 Years | 9 (19.6%) | 5 (12.2%) |
| 35 to 64 Years | 16 (24.2%) | 25 (39.1%) |
| 65 to 74 Years | 3 (15.8%) | 10 (32.3%) |
| 75 Years and over | 0 (0.0%) | 4 (40.0%) |
Disability Class: Self-Care Difficulty
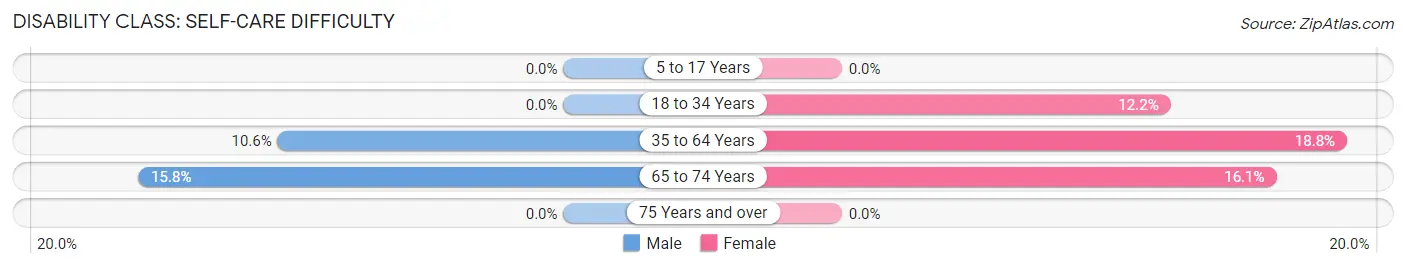
| Age Bracket | Male | Female |
| 5 to 17 Years | 0 (0.0%) | 0 (0.0%) |
| 18 to 34 Years | 0 (0.0%) | 5 (12.2%) |
| 35 to 64 Years | 7 (10.6%) | 12 (18.8%) |
| 65 to 74 Years | 3 (15.8%) | 5 (16.1%) |
| 75 Years and over | 0 (0.0%) | 0 (0.0%) |
Technology Access in Springdale
Computing Device Access in Springdale
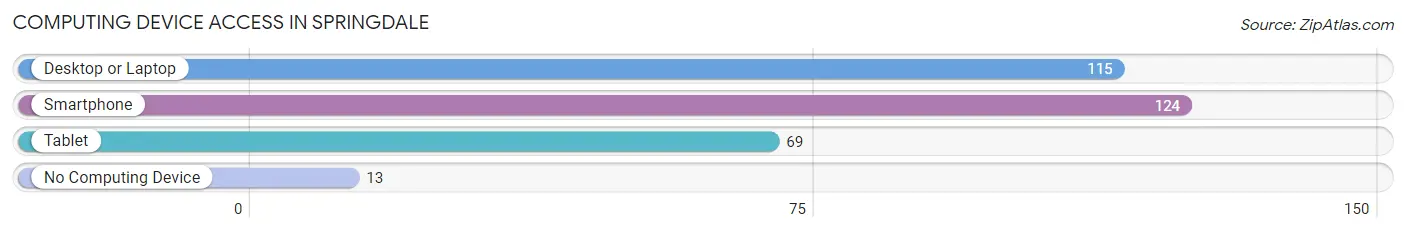
| Device Type | # Households | % Households |
| Desktop or Laptop | 115 | 78.2% |
| Smartphone | 124 | 84.4% |
| Tablet | 69 | 46.9% |
| No Computing Device | 13 | 8.8% |
| Total | 147 | 100.0% |
Internet Access in Springdale

| Internet Type | # Households | % Households |
| Dial-Up Internet | 4 | 2.7% |
| Broadband Home | 101 | 68.7% |
| Cellular Data Only | 5 | 3.4% |
| Satellite Internet | 6 | 4.1% |
| No Internet | 31 | 21.1% |
| Total | 147 | 100.0% |
Springdale Summary
Springdale is a small town located in the state of Washington, United States. It is situated in the northwest corner of the state, near the border with Canada. The town is located in Stevens County, and is part of the Spokane-Spokane Valley Metropolitan Statistical Area. As of the 2010 census, the population of Springdale was 1,845.
Geography
Springdale is located at the intersection of US Highway 395 and State Route 231. It is situated in the northwest corner of the state, near the border with Canada. The town is located in Stevens County, and is part of the Spokane-Spokane Valley Metropolitan Statistical Area. The town is situated in a valley surrounded by hills and mountains. The nearest major city is Spokane, which is located about 40 miles to the south.
The climate in Springdale is generally mild, with warm summers and cold winters. The average annual temperature is around 50 degrees Fahrenheit. The average annual precipitation is around 20 inches.
History
Springdale was founded in 1883 by a group of settlers from the Midwest. The town was originally named "Springdale Station" after the nearby spring. The town was incorporated in 1889.
In the early 1900s, the town was a major stop on the Great Northern Railway. The railway brought in many new settlers and businesses to the area. The town grew rapidly, and by 1910, the population had reached 1,000.
In the 1920s, the town experienced a period of economic growth. Several new businesses opened, including a lumber mill, a flour mill, and a creamery. The town also became a popular tourist destination, with many visitors coming to enjoy the nearby lakes and rivers.
In the 1950s, the town experienced a period of decline. Many of the businesses closed, and the population began to decline. In the 1970s, the town experienced a resurgence, with new businesses opening and the population increasing.
Economy
The economy of Springdale is largely based on agriculture and tourism. The town is home to several farms, which produce a variety of crops, including wheat, barley, and hay. The town is also home to several wineries, which produce a variety of wines.
Tourism is also an important part of the local economy. The town is home to several lakes and rivers, which attract visitors from all over the region. The town is also home to several parks, which offer a variety of recreational activities.
Demographics
As of the 2010 census, the population of Springdale was 1,845. The racial makeup of the town was 94.3% White, 0.7% African American, 0.3% Native American, 0.3% Asian, 0.1% Pacific Islander, 0.7% from other races, and 3.0% from two or more races. Hispanic or Latino of any race were 2.7% of the population.
The median income for a household in the town was $37,500, and the median income for a family was $45,000. The per capita income for the town was $19,000. About 11.3% of families and 14.2% of the population were below the poverty line, including 18.2% of those under age 18 and 8.3% of those age 65 or over.
Common Questions
What is Per Capita Income in Springdale?
Per Capita income in Springdale is $16,690.
What is the Median Family Income in Springdale?
Median Family Income in Springdale is $49,850.
What is the Median Household income in Springdale?
Median Household Income in Springdale is $48,950.
What is Income or Wage Gap in Springdale?
Income or Wage Gap in Springdale is 59.4%.
Women in Springdale earn 40.6 cents for every dollar earned by a man.
What is Inequality or Gini Index in Springdale?
Inequality or Gini Index in Springdale is 0.38.
What is the Total Population of Springdale?
Total Population of Springdale is 513.
What is the Total Male Population of Springdale?
Total Male Population of Springdale is 222.
What is the Total Female Population of Springdale?
Total Female Population of Springdale is 291.
What is the Ratio of Males per 100 Females in Springdale?
There are 76.29 Males per 100 Females in Springdale.
What is the Ratio of Females per 100 Males in Springdale?
There are 131.08 Females per 100 Males in Springdale.
What is the Median Population Age in Springdale?
Median Population Age in Springdale is 20.4 Years.
What is the Average Family Size in Springdale
Average Family Size in Springdale is 4.8 People.
What is the Average Household Size in Springdale
Average Household Size in Springdale is 3.5 People.
How Large is the Labor Force in Springdale?
There are 124 People in the Labor Forcein in Springdale.
What is the Percentage of People in the Labor Force in Springdale?
41.8% of People are in the Labor Force in Springdale.