Cheney, WA Map & Demographics
Cheney Map
Cheney Overview
$24,693
PER CAPITA INCOME
$78,435
AVG FAMILY INCOME
$45,419
AVG HOUSEHOLD INCOME
12.8%
WAGE / INCOME GAP [ % ]
87.2¢/ $1
WAGE / INCOME GAP [ $ ]
$15,967
FAMILY INCOME DEFICIT
0.51
INEQUALITY / GINI INDEX
12,848
TOTAL POPULATION
5,644
MALE POPULATION
7,204
FEMALE POPULATION
78.35
MALES / 100 FEMALES
127.64
FEMALES / 100 MALES
23.8
MEDIAN AGE
2.8
AVG FAMILY SIZE
2.3
AVG HOUSEHOLD SIZE
7,569
LABOR FORCE [ PEOPLE ]
67.8%
PERCENT IN LABOR FORCE
13.0%
UNEMPLOYMENT RATE
Cheney Zip Codes
Cheney Area Codes
Income in Cheney
Income Overview in Cheney
Per Capita Income in Cheney is $24,693, while median incomes of families and households are $78,435 and $45,419 respectively.
| Characteristic | Number | Measure |
| Per Capita Income | 12,848 | $24,693 |
| Median Family Income | 2,205 | $78,435 |
| Mean Family Income | 2,205 | $92,984 |
| Median Household Income | 4,893 | $45,419 |
| Mean Household Income | 4,893 | $62,157 |
| Income Deficit | 2,205 | $15,967 |
| Wage / Income Gap (%) | 12,848 | 12.78% |
| Wage / Income Gap ($) | 12,848 | 87.22¢ per $1 |
| Gini / Inequality Index | 12,848 | 0.51 |
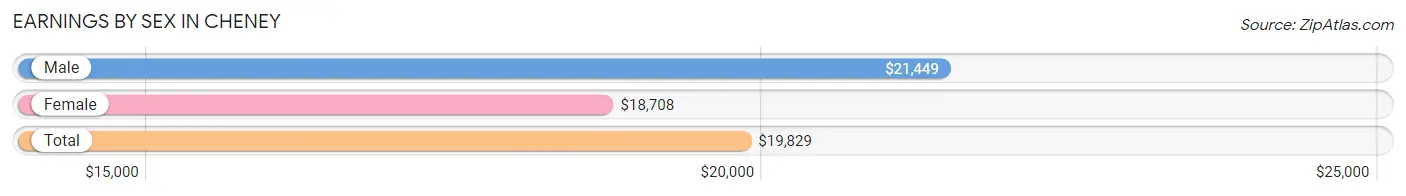
Earnings by Sex in Cheney
Average Earnings in Cheney are $19,829, $21,449 for men and $18,708 for women, a difference of 12.8%.
| Sex | Number | Average Earnings |
| Male | 3,865 (47.5%) | $21,449 |
| Female | 4,264 (52.4%) | $18,708 |
| Total | 8,129 (100.0%) | $19,829 |
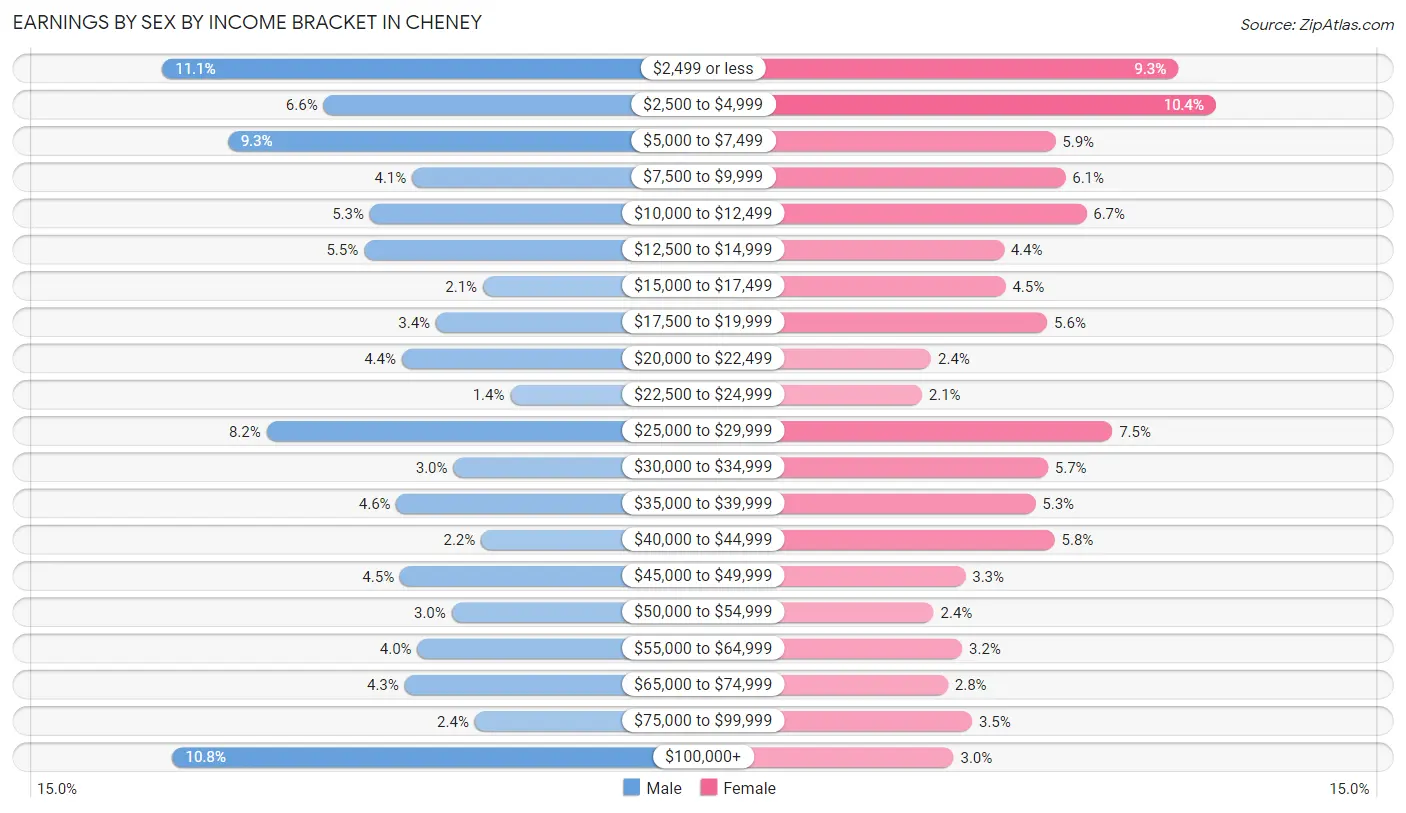
Earnings by Sex by Income Bracket in Cheney
The most common earnings brackets in Cheney are $2,499 or less for men (430 | 11.1%) and $2,500 to $4,999 for women (442 | 10.4%).
| Income | Male | Female |
| $2,499 or less | 430 (11.1%) | 397 (9.3%) |
| $2,500 to $4,999 | 255 (6.6%) | 442 (10.4%) |
| $5,000 to $7,499 | 359 (9.3%) | 250 (5.9%) |
| $7,500 to $9,999 | 159 (4.1%) | 262 (6.1%) |
| $10,000 to $12,499 | 205 (5.3%) | 287 (6.7%) |
| $12,500 to $14,999 | 211 (5.5%) | 188 (4.4%) |
| $15,000 to $17,499 | 82 (2.1%) | 190 (4.5%) |
| $17,500 to $19,999 | 133 (3.4%) | 240 (5.6%) |
| $20,000 to $22,499 | 170 (4.4%) | 101 (2.4%) |
| $22,500 to $24,999 | 52 (1.3%) | 90 (2.1%) |
| $25,000 to $29,999 | 317 (8.2%) | 318 (7.5%) |
| $30,000 to $34,999 | 114 (2.9%) | 241 (5.7%) |
| $35,000 to $39,999 | 176 (4.5%) | 226 (5.3%) |
| $40,000 to $44,999 | 84 (2.2%) | 249 (5.8%) |
| $45,000 to $49,999 | 172 (4.4%) | 142 (3.3%) |
| $50,000 to $54,999 | 116 (3.0%) | 104 (2.4%) |
| $55,000 to $64,999 | 153 (4.0%) | 138 (3.2%) |
| $65,000 to $74,999 | 167 (4.3%) | 121 (2.8%) |
| $75,000 to $99,999 | 91 (2.4%) | 150 (3.5%) |
| $100,000+ | 419 (10.8%) | 128 (3.0%) |
| Total | 3,865 (100.0%) | 4,264 (100.0%) |
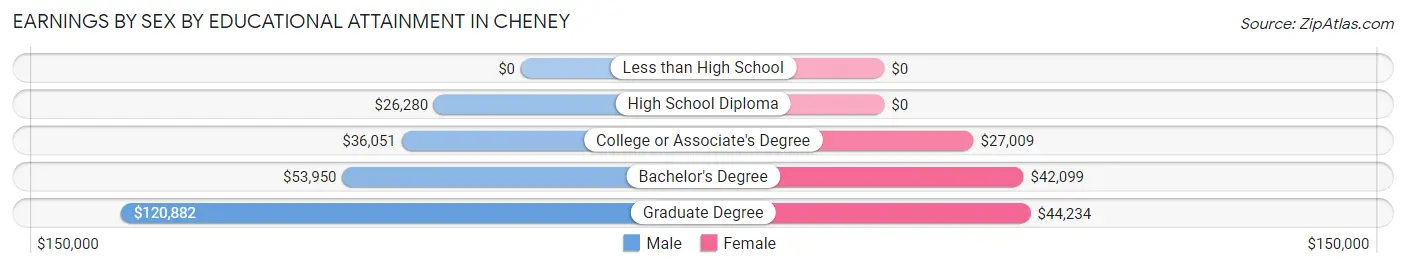
Earnings by Sex by Educational Attainment in Cheney
Average earnings in Cheney are $45,179 for men and $38,205 for women, a difference of 15.4%. Men with an educational attainment of graduate degree enjoy the highest average annual earnings of $120,882, while those with high school diploma education earn the least with $26,280. Women with an educational attainment of graduate degree earn the most with the average annual earnings of $44,234, while those with college or associate's degree education have the smallest earnings of $27,009.
| Educational Attainment | Male Income | Female Income |
| Less than High School | - | - |
| High School Diploma | $26,280 | $0 |
| College or Associate's Degree | $36,051 | $27,009 |
| Bachelor's Degree | $53,950 | $42,099 |
| Graduate Degree | $120,882 | $44,234 |
| Total | $45,179 | $38,205 |
Family Income in Cheney
Family Income Brackets in Cheney
According to the Cheney family income data, there are 474 families falling into the $100,000 to $149,999 income range, which is the most common income bracket and makes up 21.5% of all families. Conversely, the $10,000 to $14,999 income bracket is the least frequent group with only 49 families (2.2%) belonging to this category.
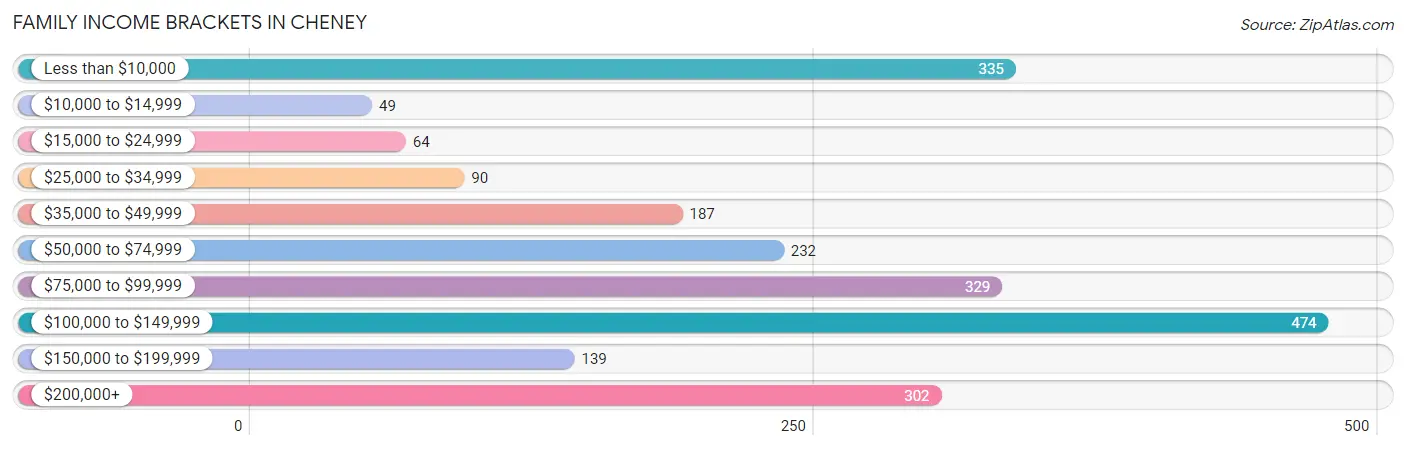
| Income Bracket | # Families | % Families |
| Less than $10,000 | 335 | 15.2% |
| $10,000 to $14,999 | 49 | 2.2% |
| $15,000 to $24,999 | 64 | 2.9% |
| $25,000 to $34,999 | 90 | 4.1% |
| $35,000 to $49,999 | 187 | 8.5% |
| $50,000 to $74,999 | 232 | 10.5% |
| $75,000 to $99,999 | 329 | 14.9% |
| $100,000 to $149,999 | 474 | 21.5% |
| $150,000 to $199,999 | 139 | 6.3% |
| $200,000+ | 302 | 13.7% |
Family Income by Famaliy Size in Cheney
6-person families (73 | 3.3%) account for the highest median family income in Cheney with $200,938 per family, while 2-person families (1,064 | 48.2%) have the highest median income of $39,516 per family member.
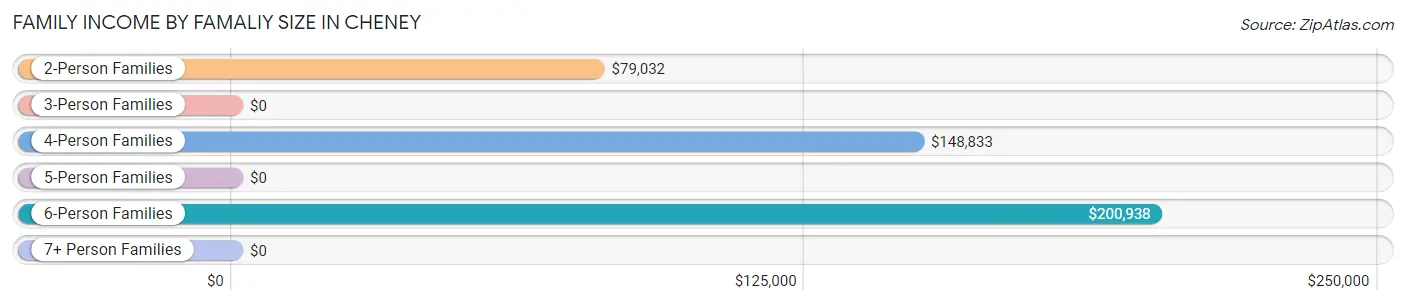
| Income Bracket | # Families | Median Income |
| 2-Person Families | 1,064 (48.2%) | $79,032 |
| 3-Person Families | 701 (31.8%) | $0 |
| 4-Person Families | 274 (12.4%) | $148,833 |
| 5-Person Families | 93 (4.2%) | $0 |
| 6-Person Families | 73 (3.3%) | $200,938 |
| 7+ Person Families | 0 (0.0%) | $0 |
| Total | 2,205 (100.0%) | $78,435 |
Family Income by Number of Earners in Cheney
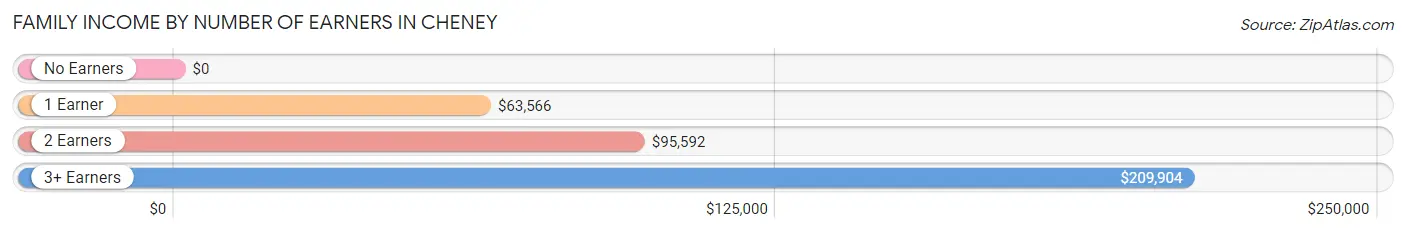
| Number of Earners | # Families | Median Income |
| No Earners | 516 (23.4%) | $0 |
| 1 Earner | 567 (25.7%) | $63,566 |
| 2 Earners | 907 (41.1%) | $95,592 |
| 3+ Earners | 215 (9.8%) | $209,904 |
| Total | 2,205 (100.0%) | $78,435 |
Household Income in Cheney
Household Income Brackets in Cheney
With 856 households falling in the category, the less than $10,000 income range is the most frequent in Cheney, accounting for 17.5% of all households. In contrast, only 108 households (2.2%) fall into the $150,000 to $199,999 income bracket, making it the least populous group.
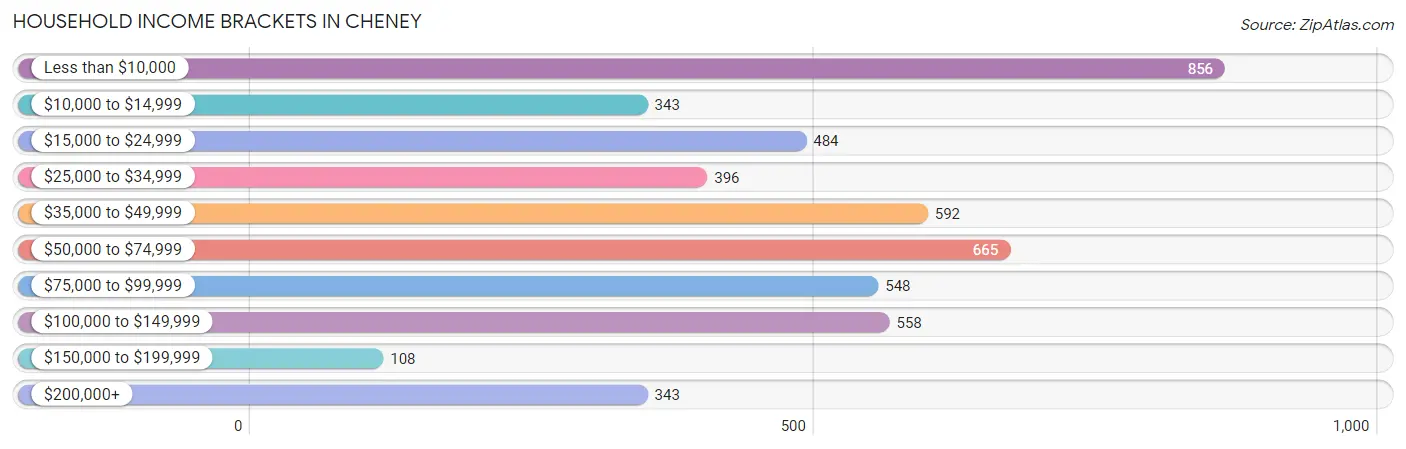
| Income Bracket | # Households | % Households |
| Less than $10,000 | 856 | 17.5% |
| $10,000 to $14,999 | 343 | 7.0% |
| $15,000 to $24,999 | 484 | 9.9% |
| $25,000 to $34,999 | 396 | 8.1% |
| $35,000 to $49,999 | 592 | 12.1% |
| $50,000 to $74,999 | 665 | 13.6% |
| $75,000 to $99,999 | 548 | 11.2% |
| $100,000 to $149,999 | 558 | 11.4% |
| $150,000 to $199,999 | 108 | 2.2% |
| $200,000+ | 343 | 7.0% |
Household Income by Householder Age in Cheney
The median household income in Cheney is $45,419, with the highest median household income of $112,848 found in the 45 to 64 years age bracket for the primary householder. A total of 757 households (15.5%) fall into this category. Meanwhile, the 15 to 24 years age bracket for the primary householder has the lowest median household income of $26,024, with 1,684 households (34.4%) in this group.
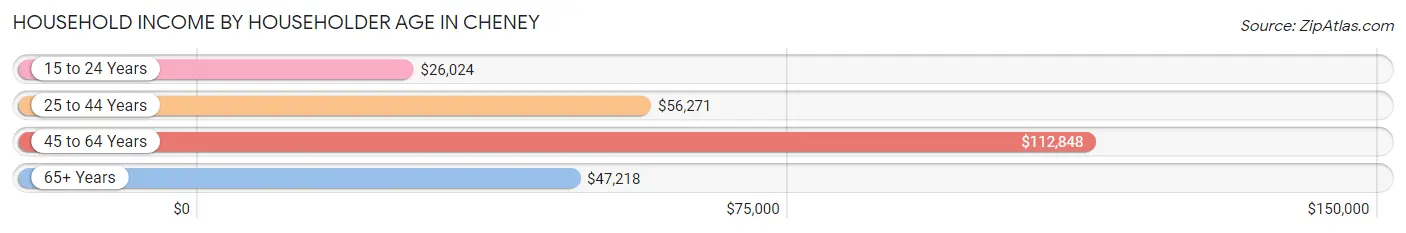
| Income Bracket | # Households | Median Income |
| 15 to 24 Years | 1,684 (34.4%) | $26,024 |
| 25 to 44 Years | 1,612 (33.0%) | $56,271 |
| 45 to 64 Years | 757 (15.5%) | $112,848 |
| 65+ Years | 840 (17.2%) | $47,218 |
| Total | 4,893 (100.0%) | $45,419 |
Poverty in Cheney
Income Below Poverty by Sex and Age in Cheney
With 28.9% poverty level for males and 36.7% for females among the residents of Cheney, 18 to 24 year old males and under 5 year old females are the most vulnerable to poverty, with 927 males (56.3%) and 266 females (69.6%) in their respective age groups living below the poverty level.
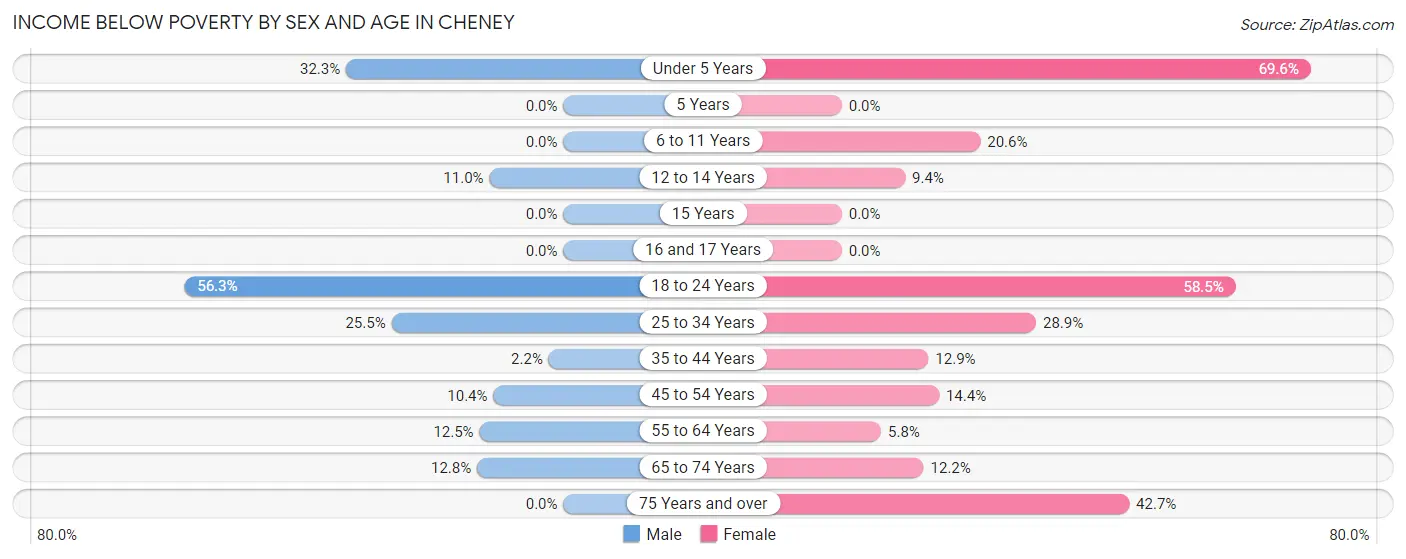
| Age Bracket | Male | Female |
| Under 5 Years | 81 (32.3%) | 266 (69.6%) |
| 5 Years | 0 (0.0%) | 0 (0.0%) |
| 6 to 11 Years | 0 (0.0%) | 58 (20.6%) |
| 12 to 14 Years | 19 (11.0%) | 25 (9.4%) |
| 15 Years | 0 (0.0%) | 0 (0.0%) |
| 16 and 17 Years | 0 (0.0%) | 0 (0.0%) |
| 18 to 24 Years | 927 (56.3%) | 1,351 (58.5%) |
| 25 to 34 Years | 284 (25.5%) | 281 (28.8%) |
| 35 to 44 Years | 9 (2.2%) | 67 (12.9%) |
| 45 to 54 Years | 35 (10.4%) | 42 (14.4%) |
| 55 to 64 Years | 41 (12.5%) | 27 (5.8%) |
| 65 to 74 Years | 40 (12.8%) | 43 (12.1%) |
| 75 Years and over | 0 (0.0%) | 198 (42.7%) |
| Total | 1,436 (28.9%) | 2,358 (36.7%) |
Income Above Poverty by Sex and Age in Cheney
According to the poverty statistics in Cheney, males aged 5 years and females aged 15 years are the age groups that are most secure financially, with 100.0% of males and 100.0% of females in these age groups living above the poverty line.
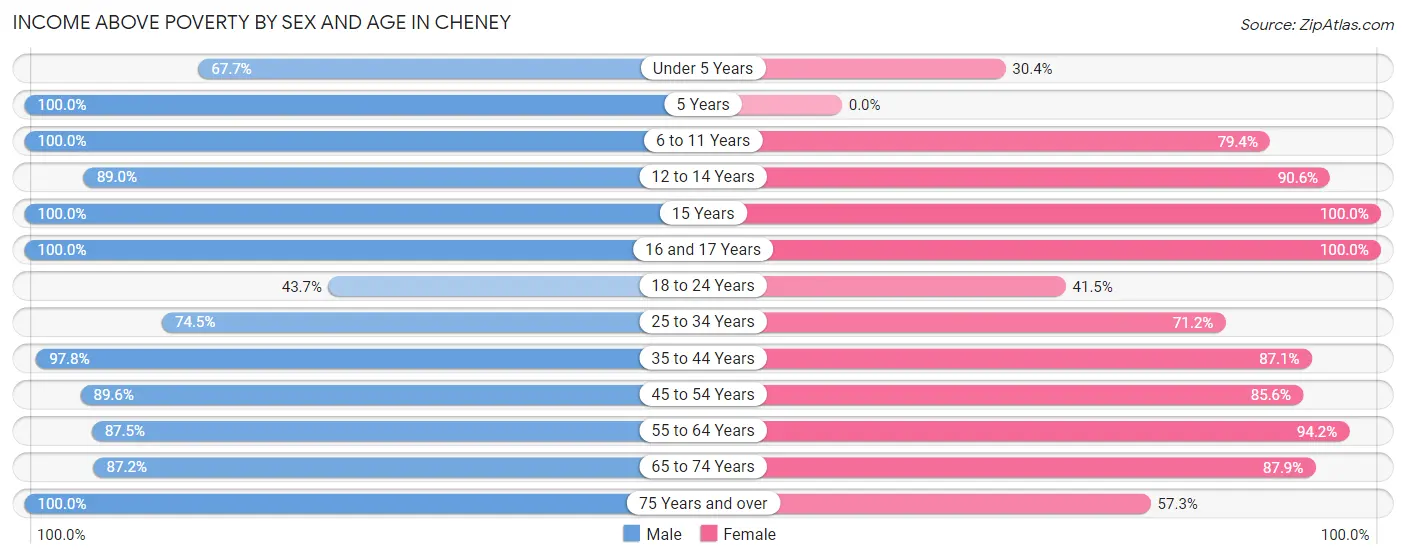
| Age Bracket | Male | Female |
| Under 5 Years | 170 (67.7%) | 116 (30.4%) |
| 5 Years | 7 (100.0%) | 0 (0.0%) |
| 6 to 11 Years | 136 (100.0%) | 224 (79.4%) |
| 12 to 14 Years | 154 (89.0%) | 241 (90.6%) |
| 15 Years | 96 (100.0%) | 38 (100.0%) |
| 16 and 17 Years | 30 (100.0%) | 82 (100.0%) |
| 18 to 24 Years | 720 (43.7%) | 960 (41.5%) |
| 25 to 34 Years | 829 (74.5%) | 693 (71.2%) |
| 35 to 44 Years | 405 (97.8%) | 454 (87.1%) |
| 45 to 54 Years | 302 (89.6%) | 249 (85.6%) |
| 55 to 64 Years | 288 (87.5%) | 435 (94.2%) |
| 65 to 74 Years | 272 (87.2%) | 311 (87.8%) |
| 75 Years and over | 125 (100.0%) | 266 (57.3%) |
| Total | 3,534 (71.1%) | 4,069 (63.3%) |
Income Below Poverty Among Married-Couple Families in Cheney
The poverty statistics for married-couple families in Cheney show that 10.6% or 164 of the total 1,543 families live below the poverty line. Families with 1 or 2 children have the highest poverty rate of 17.5%, comprising of 98 families. On the other hand, families with 3 or 4 children have the lowest poverty rate of 0.0%, which includes 0 families.
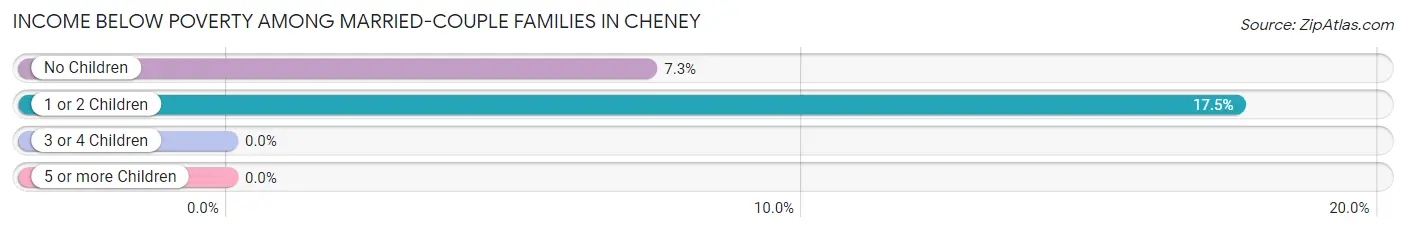
| Children | Above Poverty | Below Poverty |
| No Children | 838 (92.7%) | 66 (7.3%) |
| 1 or 2 Children | 461 (82.5%) | 98 (17.5%) |
| 3 or 4 Children | 80 (100.0%) | 0 (0.0%) |
| 5 or more Children | 0 (0.0%) | 0 (0.0%) |
| Total | 1,379 (89.4%) | 164 (10.6%) |
Income Below Poverty Among Single-Parent Households in Cheney
According to the poverty data in Cheney, 32.8% or 63 single-father households and 40.0% or 188 single-mother households are living below the poverty line. Among single-father households, those with 1 or 2 children have the highest poverty rate, with 54 households (39.4%) experiencing poverty. Likewise, among single-mother households, those with 1 or 2 children have the highest poverty rate, with 173 households (56.0%) falling below the poverty line.
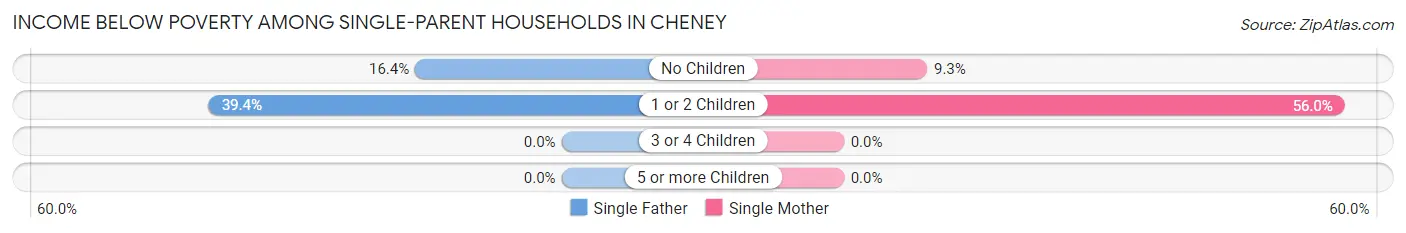
| Children | Single Father | Single Mother |
| No Children | 9 (16.4%) | 15 (9.3%) |
| 1 or 2 Children | 54 (39.4%) | 173 (56.0%) |
| 3 or 4 Children | 0 (0.0%) | 0 (0.0%) |
| 5 or more Children | 0 (0.0%) | 0 (0.0%) |
| Total | 63 (32.8%) | 188 (40.0%) |
Income Below Poverty Among Married-Couple vs Single-Parent Households in Cheney
The poverty data for Cheney shows that 164 of the married-couple family households (10.6%) and 251 of the single-parent households (37.9%) are living below the poverty level. Within the married-couple family households, those with 1 or 2 children have the highest poverty rate, with 98 households (17.5%) falling below the poverty line. Among the single-parent households, those with 1 or 2 children have the highest poverty rate, with 227 household (50.9%) living below poverty.
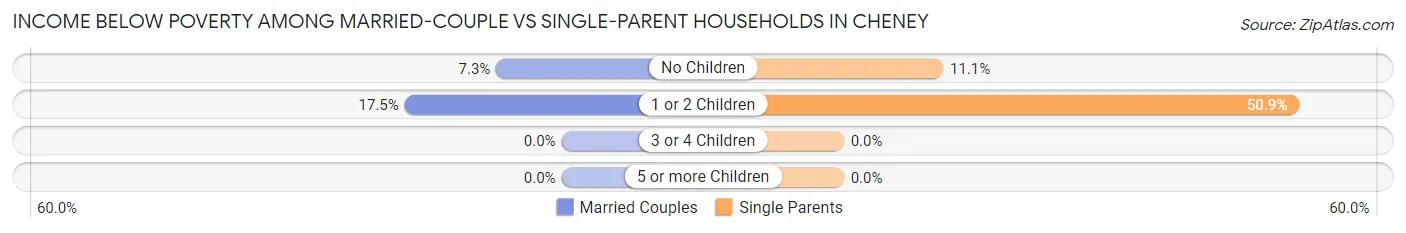
| Children | Married-Couple Families | Single-Parent Households |
| No Children | 66 (7.3%) | 24 (11.1%) |
| 1 or 2 Children | 98 (17.5%) | 227 (50.9%) |
| 3 or 4 Children | 0 (0.0%) | 0 (0.0%) |
| 5 or more Children | 0 (0.0%) | 0 (0.0%) |
| Total | 164 (10.6%) | 251 (37.9%) |
Race in Cheney
The most populous races in Cheney are White / Caucasian (10,040 | 78.1%), Hispanic or Latino (1,493 | 11.6%), and Two or more Races (1,206 | 9.4%).
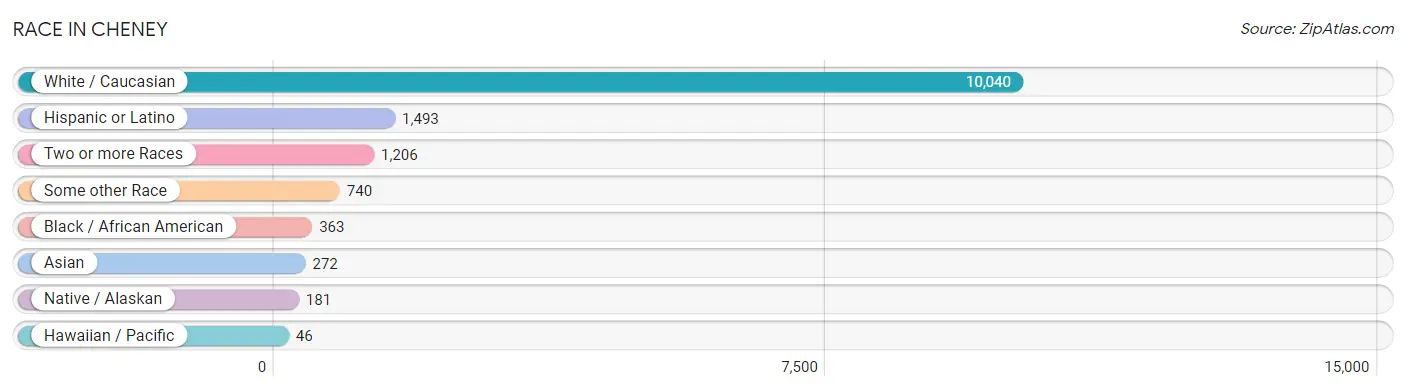
| Race | # Population | % Population |
| Asian | 272 | 2.1% |
| Black / African American | 363 | 2.8% |
| Hawaiian / Pacific | 46 | 0.4% |
| Hispanic or Latino | 1,493 | 11.6% |
| Native / Alaskan | 181 | 1.4% |
| White / Caucasian | 10,040 | 78.1% |
| Two or more Races | 1,206 | 9.4% |
| Some other Race | 740 | 5.8% |
| Total | 12,848 | 100.0% |
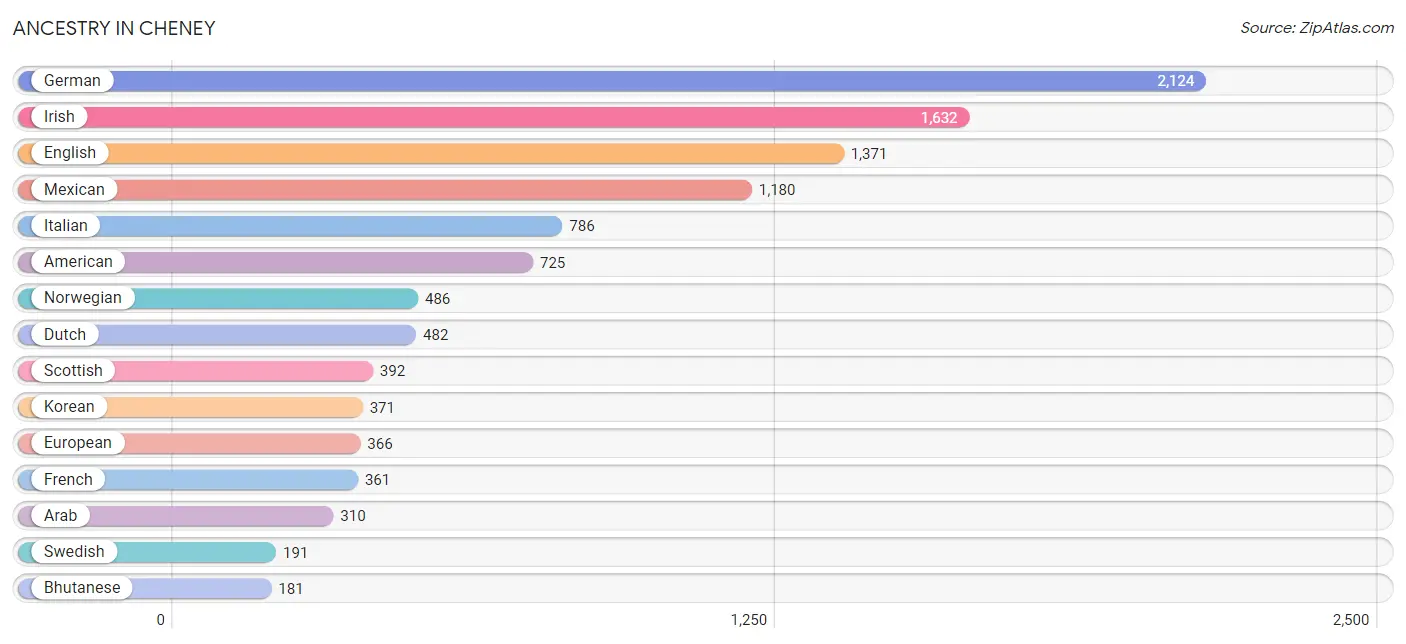
Ancestry in Cheney
The most populous ancestries reported in Cheney are German (2,124 | 16.5%), Irish (1,632 | 12.7%), English (1,371 | 10.7%), Mexican (1,180 | 9.2%), and Italian (786 | 6.1%), together accounting for 55.2% of all Cheney residents.
| Ancestry | # Population | % Population |
| African | 25 | 0.2% |
| Alaskan Athabascan | 16 | 0.1% |
| American | 725 | 5.6% |
| Arab | 310 | 2.4% |
| Armenian | 33 | 0.3% |
| Austrian | 21 | 0.2% |
| Bhutanese | 181 | 1.4% |
| Blackfeet | 81 | 0.6% |
| British | 135 | 1.1% |
| Burmese | 63 | 0.5% |
| Cambodian | 57 | 0.4% |
| Canadian | 19 | 0.2% |
| Cherokee | 23 | 0.2% |
| Choctaw | 10 | 0.1% |
| Colombian | 26 | 0.2% |
| Colville | 24 | 0.2% |
| Comanche | 26 | 0.2% |
| Croatian | 26 | 0.2% |
| Czech | 148 | 1.1% |
| Czechoslovakian | 30 | 0.2% |
| Danish | 67 | 0.5% |
| Delaware | 8 | 0.1% |
| Dominican | 3 | 0.0% |
| Dutch | 482 | 3.7% |
| Eastern European | 9 | 0.1% |
| English | 1,371 | 10.7% |
| European | 366 | 2.9% |
| Finnish | 73 | 0.6% |
| French | 361 | 2.8% |
| French Canadian | 136 | 1.1% |
| German | 2,124 | 16.5% |
| Greek | 64 | 0.5% |
| Guamanian / Chamorro | 146 | 1.1% |
| Icelander | 6 | 0.1% |
| Indian (Asian) | 39 | 0.3% |
| Irish | 1,632 | 12.7% |
| Italian | 786 | 6.1% |
| Jamaican | 14 | 0.1% |
| Japanese | 7 | 0.1% |
| Kenyan | 7 | 0.1% |
| Korean | 371 | 2.9% |
| Laotian | 9 | 0.1% |
| Lithuanian | 15 | 0.1% |
| Malaysian | 7 | 0.1% |
| Mexican | 1,180 | 9.2% |
| Mongolian | 17 | 0.1% |
| Native Hawaiian | 61 | 0.5% |
| Northern European | 37 | 0.3% |
| Norwegian | 486 | 3.8% |
| Osage | 52 | 0.4% |
| Paiute | 65 | 0.5% |
| Pakistani | 15 | 0.1% |
| Peruvian | 26 | 0.2% |
| Polish | 159 | 1.2% |
| Portuguese | 17 | 0.1% |
| Puerto Rican | 66 | 0.5% |
| Puget Sound Salish | 10 | 0.1% |
| Russian | 143 | 1.1% |
| Scandinavian | 113 | 0.9% |
| Scotch-Irish | 127 | 1.0% |
| Scottish | 392 | 3.0% |
| Sioux | 5 | 0.0% |
| Slovene | 9 | 0.1% |
| South American | 52 | 0.4% |
| Spanish | 43 | 0.3% |
| Sri Lankan | 81 | 0.6% |
| Subsaharan African | 32 | 0.3% |
| Swedish | 191 | 1.5% |
| Swiss | 47 | 0.4% |
| Thai | 3 | 0.0% |
| Ukrainian | 23 | 0.2% |
| Welsh | 89 | 0.7% |
| Yugoslavian | 23 | 0.2% | View All 73 Rows |
Immigrants in Cheney
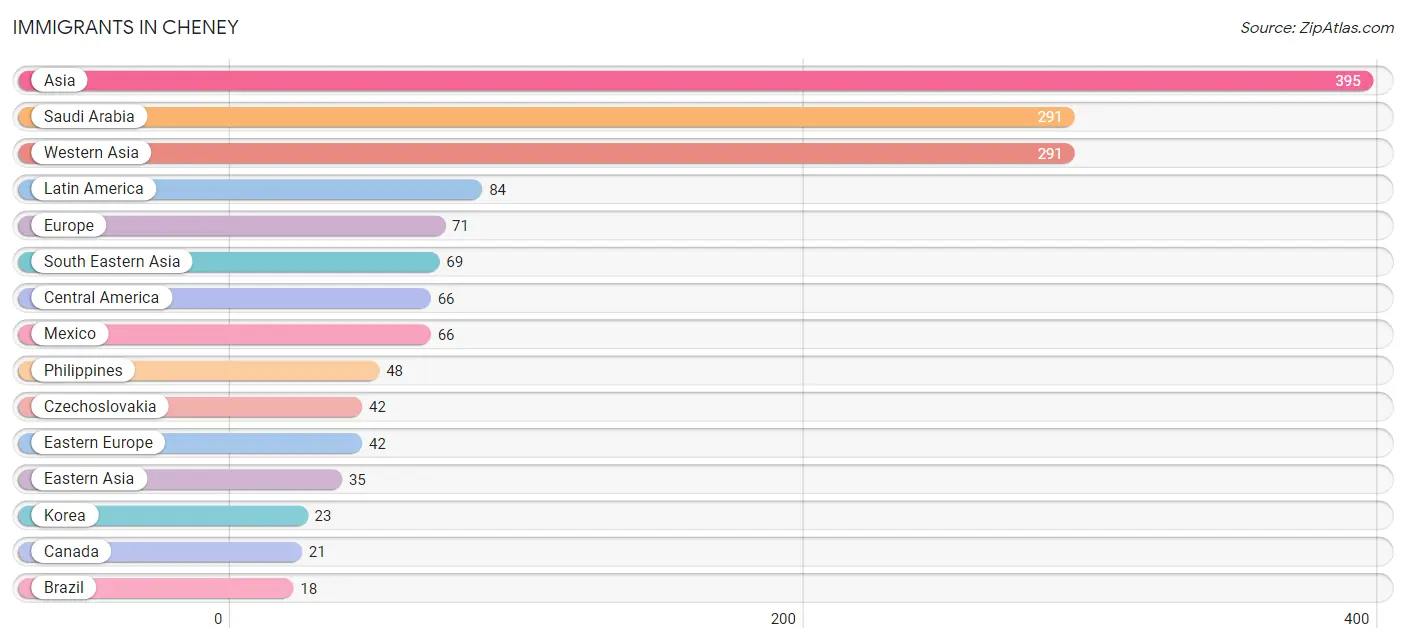
The most numerous immigrant groups reported in Cheney came from Asia (395 | 3.1%), Saudi Arabia (291 | 2.3%), Western Asia (291 | 2.3%), Latin America (84 | 0.6%), and Europe (71 | 0.5%), together accounting for 8.8% of all Cheney residents.
| Immigration Origin | # Population | % Population |
| Africa | 7 | 0.1% |
| Asia | 395 | 3.1% |
| Australia | 8 | 0.1% |
| Brazil | 18 | 0.1% |
| Canada | 21 | 0.2% |
| Central America | 66 | 0.5% |
| China | 9 | 0.1% |
| Czechoslovakia | 42 | 0.3% |
| Eastern Africa | 7 | 0.1% |
| Eastern Asia | 35 | 0.3% |
| Eastern Europe | 42 | 0.3% |
| Europe | 71 | 0.5% |
| Japan | 3 | 0.0% |
| Kenya | 7 | 0.1% |
| Korea | 23 | 0.2% |
| Latin America | 84 | 0.6% |
| Malaysia | 17 | 0.1% |
| Mexico | 66 | 0.5% |
| Netherlands | 10 | 0.1% |
| Oceania | 15 | 0.1% |
| Philippines | 48 | 0.4% |
| Saudi Arabia | 291 | 2.3% |
| South America | 18 | 0.1% |
| South Eastern Asia | 69 | 0.5% |
| Vietnam | 4 | 0.0% |
| Western Asia | 291 | 2.3% |
| Western Europe | 10 | 0.1% | View All 27 Rows |
Sex and Age in Cheney
Sex and Age in Cheney
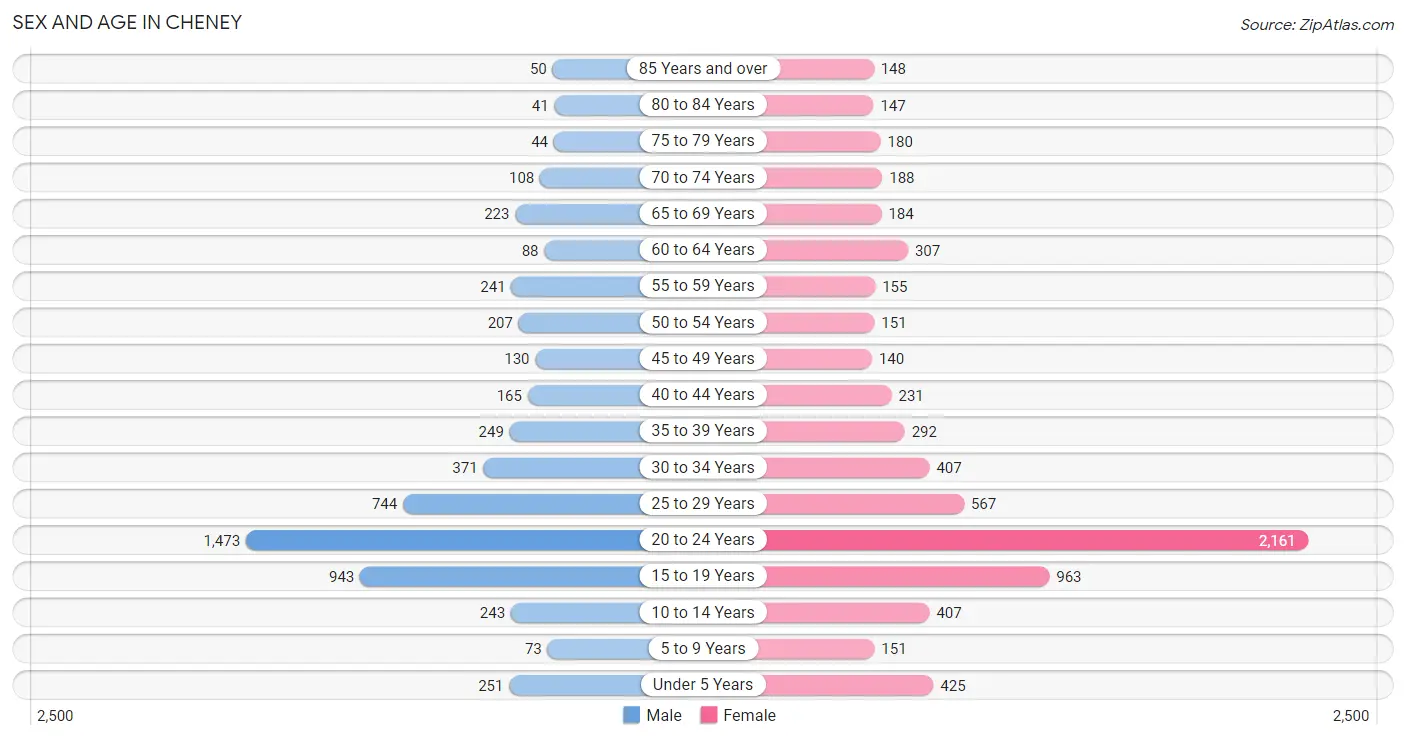
The most populous age groups in Cheney are 20 to 24 Years (1,473 | 26.1%) for men and 20 to 24 Years (2,161 | 30.0%) for women.
| Age Bracket | Male | Female |
| Under 5 Years | 251 (4.4%) | 425 (5.9%) |
| 5 to 9 Years | 73 (1.3%) | 151 (2.1%) |
| 10 to 14 Years | 243 (4.3%) | 407 (5.7%) |
| 15 to 19 Years | 943 (16.7%) | 963 (13.4%) |
| 20 to 24 Years | 1,473 (26.1%) | 2,161 (30.0%) |
| 25 to 29 Years | 744 (13.2%) | 567 (7.9%) |
| 30 to 34 Years | 371 (6.6%) | 407 (5.7%) |
| 35 to 39 Years | 249 (4.4%) | 292 (4.1%) |
| 40 to 44 Years | 165 (2.9%) | 231 (3.2%) |
| 45 to 49 Years | 130 (2.3%) | 140 (1.9%) |
| 50 to 54 Years | 207 (3.7%) | 151 (2.1%) |
| 55 to 59 Years | 241 (4.3%) | 155 (2.1%) |
| 60 to 64 Years | 88 (1.6%) | 307 (4.3%) |
| 65 to 69 Years | 223 (4.0%) | 184 (2.5%) |
| 70 to 74 Years | 108 (1.9%) | 188 (2.6%) |
| 75 to 79 Years | 44 (0.8%) | 180 (2.5%) |
| 80 to 84 Years | 41 (0.7%) | 147 (2.0%) |
| 85 Years and over | 50 (0.9%) | 148 (2.1%) |
| Total | 5,644 (100.0%) | 7,204 (100.0%) |
Families and Households in Cheney
Median Family Size in Cheney
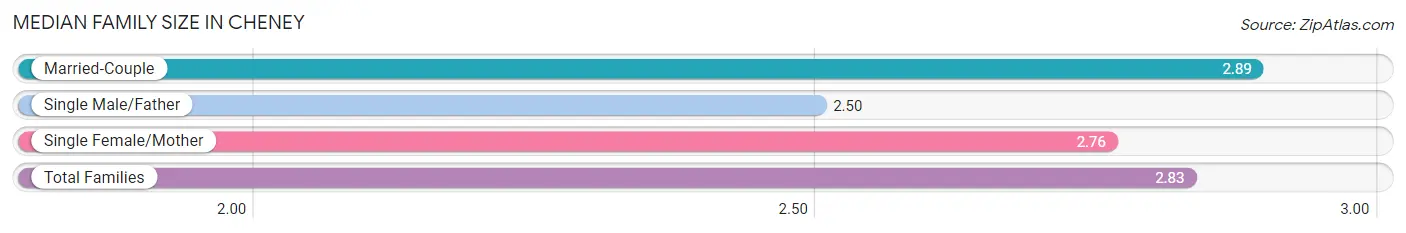
The median family size in Cheney is 2.83 persons per family, with married-couple families (1,543 | 70.0%) accounting for the largest median family size of 2.89 persons per family. On the other hand, single male/father families (192 | 8.7%) represent the smallest median family size with 2.50 persons per family.
| Family Type | # Families | Family Size |
| Married-Couple | 1,543 (70.0%) | 2.89 |
| Single Male/Father | 192 (8.7%) | 2.50 |
| Single Female/Mother | 470 (21.3%) | 2.76 |
| Total Families | 2,205 (100.0%) | 2.83 |
Median Household Size in Cheney
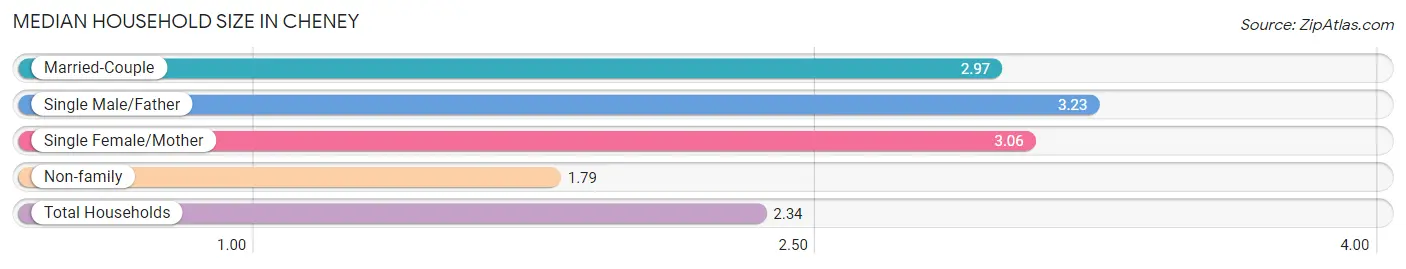
The median household size in Cheney is 2.34 persons per household, with single male/father households (192 | 3.9%) accounting for the largest median household size of 3.23 persons per household. non-family households (2,688 | 54.9%) represent the smallest median household size with 1.79 persons per household.
| Household Type | # Households | Household Size |
| Married-Couple | 1,543 (31.5%) | 2.97 |
| Single Male/Father | 192 (3.9%) | 3.23 |
| Single Female/Mother | 470 (9.6%) | 3.06 |
| Non-family | 2,688 (54.9%) | 1.79 |
| Total Households | 4,893 (100.0%) | 2.34 |
Household Size by Marriage Status in Cheney
Out of a total of 4,893 households in Cheney, 2,205 (45.1%) are family households, while 2,688 (54.9%) are nonfamily households. The most numerous type of family households are 2-person households, comprising 867, and the most common type of nonfamily households are 1-person households, comprising 1,459.
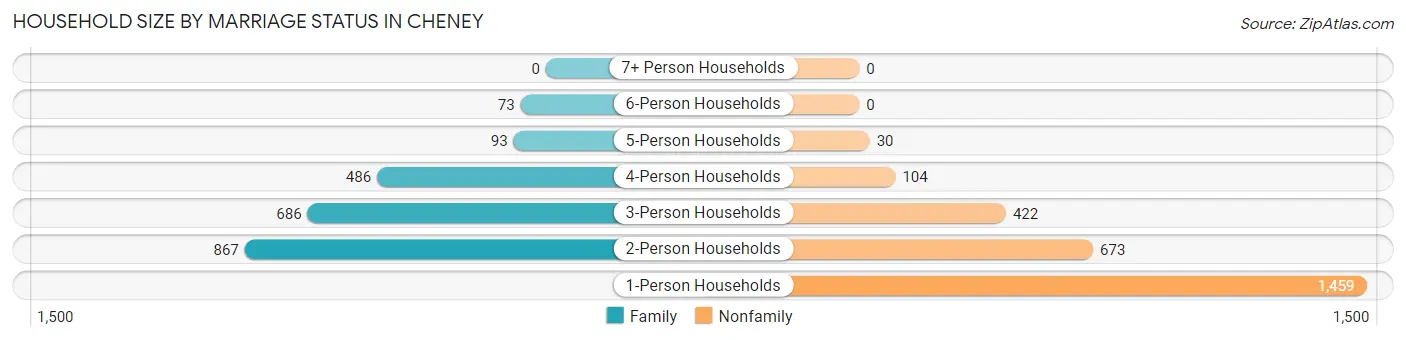
| Household Size | Family Households | Nonfamily Households |
| 1-Person Households | - | 1,459 (29.8%) |
| 2-Person Households | 867 (17.7%) | 673 (13.8%) |
| 3-Person Households | 686 (14.0%) | 422 (8.6%) |
| 4-Person Households | 486 (9.9%) | 104 (2.1%) |
| 5-Person Households | 93 (1.9%) | 30 (0.6%) |
| 6-Person Households | 73 (1.5%) | 0 (0.0%) |
| 7+ Person Households | 0 (0.0%) | 0 (0.0%) |
| Total | 2,205 (45.1%) | 2,688 (54.9%) |
Female Fertility in Cheney
Fertility by Age in Cheney
Average fertility rate in Cheney is 36.0 births per 1,000 women. Women in the age bracket of 20 to 34 years have the highest fertility rate with 55.0 births per 1,000 women. Women in the age bracket of 20 to 34 years acount for 100.0% of all women with births.
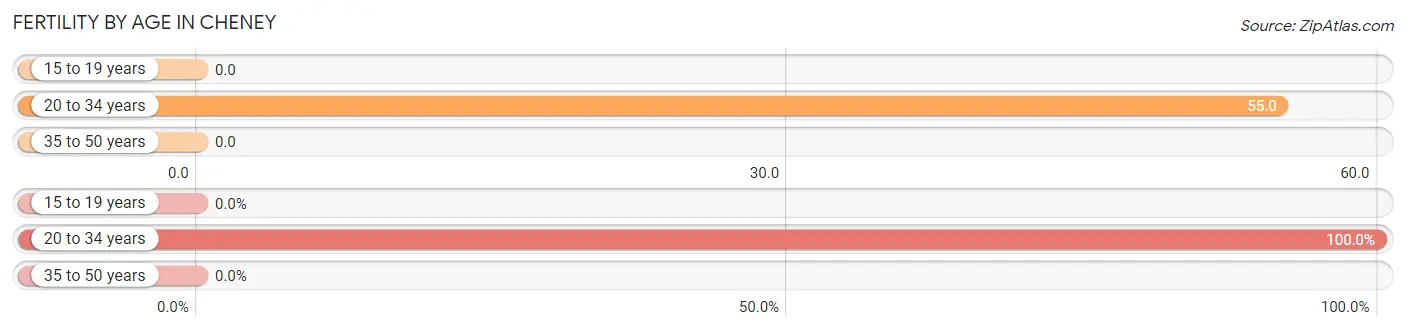
| Age Bracket | Women with Births | Births / 1,000 Women |
| 15 to 19 years | 0 (0.0%) | 0.0 |
| 20 to 34 years | 172 (100.0%) | 55.0 |
| 35 to 50 years | 0 (0.0%) | 0.0 |
| Total | 172 (100.0%) | 36.0 |
Fertility by Age by Marriage Status in Cheney
22.7% of women with births (172) in Cheney are married. The highest percentage of unmarried women with births falls into 20 to 34 years age bracket with 77.3% of them unmarried at the time of birth, while the lowest percentage of unmarried women with births belong to 20 to 34 years age bracket with 77.3% of them unmarried.
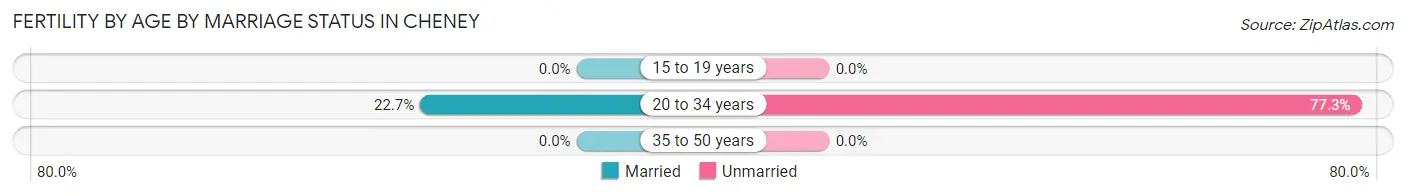
| Age Bracket | Married | Unmarried |
| 15 to 19 years | 0 (0.0%) | 0 (0.0%) |
| 20 to 34 years | 39 (22.7%) | 133 (77.3%) |
| 35 to 50 years | 0 (0.0%) | 0 (0.0%) |
| Total | 39 (22.7%) | 133 (77.3%) |
Fertility by Education in Cheney
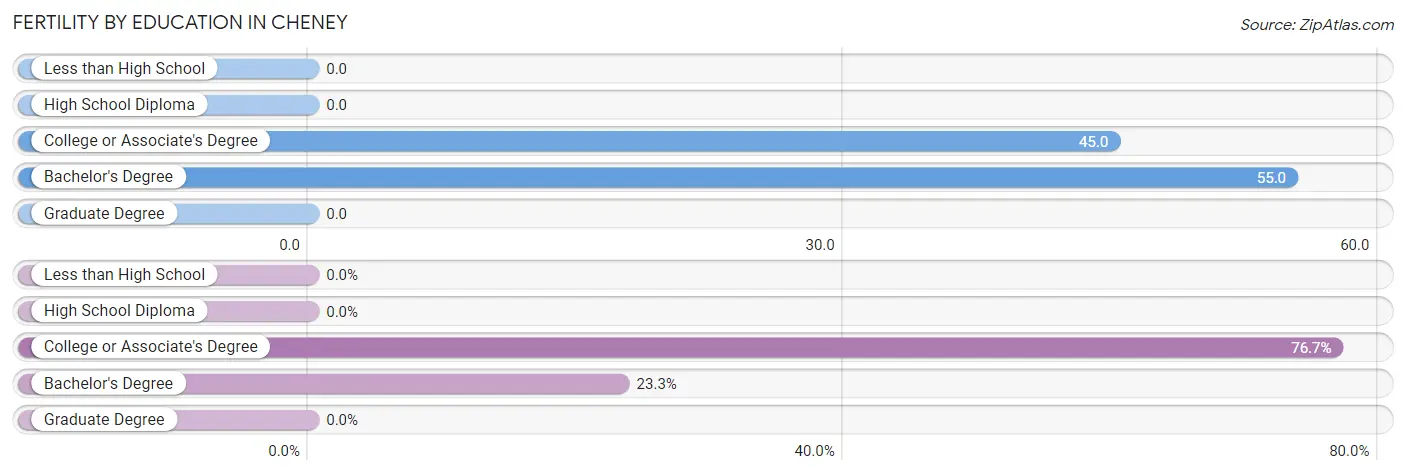
| Educational Attainment | Women with Births | Births / 1,000 Women |
| Less than High School | 0 (0.0%) | 0.0 |
| High School Diploma | 0 (0.0%) | 0.0 |
| College or Associate's Degree | 132 (76.7%) | 45.0 |
| Bachelor's Degree | 40 (23.3%) | 55.0 |
| Graduate Degree | 0 (0.0%) | 0.0 |
| Total | 172 (100.0%) | 36.0 |
Fertility by Education by Marriage Status in Cheney
77.3% of women with births in Cheney are unmarried. Women with the educational attainment of bachelor's degree are most likely to be married with 40.0% of them married at childbirth, while women with the educational attainment of college or associate's degree are least likely to be married with 82.6% of them unmarried at childbirth.
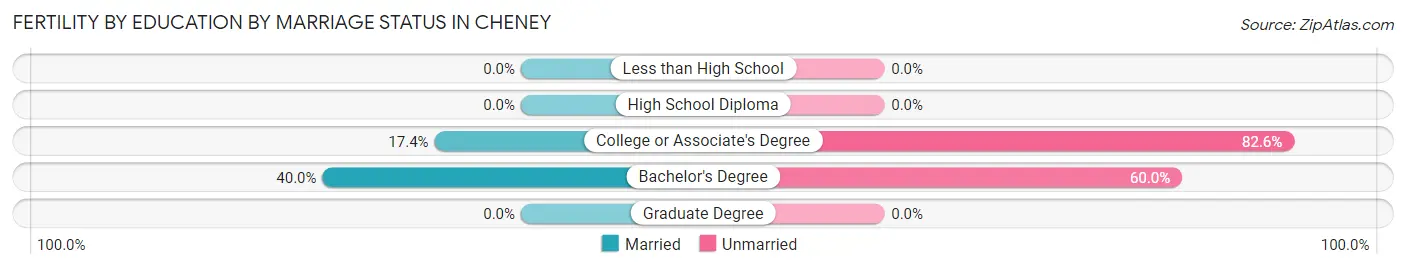
| Educational Attainment | Married | Unmarried |
| Less than High School | 0 (0.0%) | 0 (0.0%) |
| High School Diploma | 0 (0.0%) | 0 (0.0%) |
| College or Associate's Degree | 23 (17.4%) | 109 (82.6%) |
| Bachelor's Degree | 16 (40.0%) | 24 (60.0%) |
| Graduate Degree | 0 (0.0%) | 0 (0.0%) |
| Total | 39 (22.7%) | 133 (77.3%) |
Employment Characteristics in Cheney
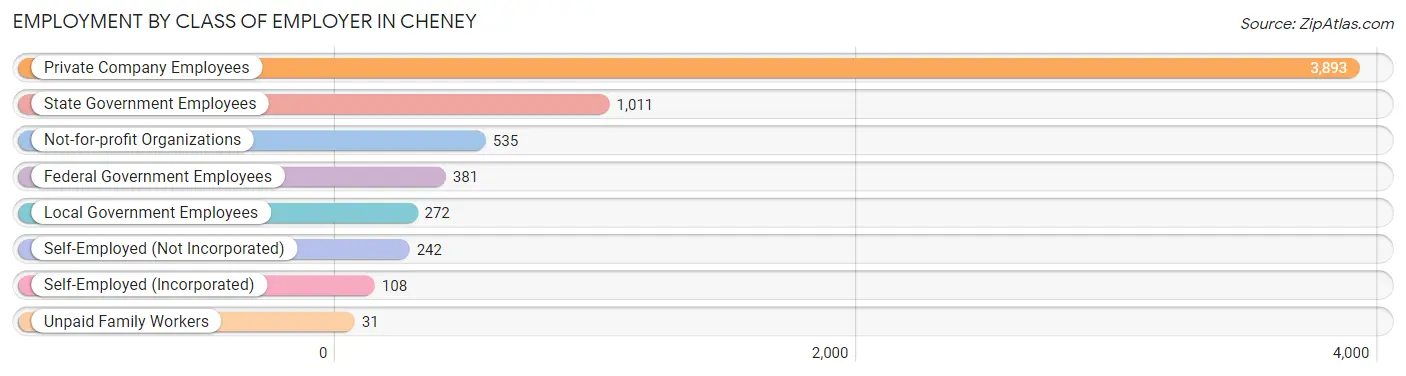
Employment by Class of Employer in Cheney
Among the 6,473 employed individuals in Cheney, private company employees (3,893 | 60.1%), state government employees (1,011 | 15.6%), and not-for-profit organizations (535 | 8.3%) make up the most common classes of employment.
| Employer Class | # Employees | % Employees |
| Private Company Employees | 3,893 | 60.1% |
| Self-Employed (Incorporated) | 108 | 1.7% |
| Self-Employed (Not Incorporated) | 242 | 3.7% |
| Not-for-profit Organizations | 535 | 8.3% |
| Local Government Employees | 272 | 4.2% |
| State Government Employees | 1,011 | 15.6% |
| Federal Government Employees | 381 | 5.9% |
| Unpaid Family Workers | 31 | 0.5% |
| Total | 6,473 | 100.0% |
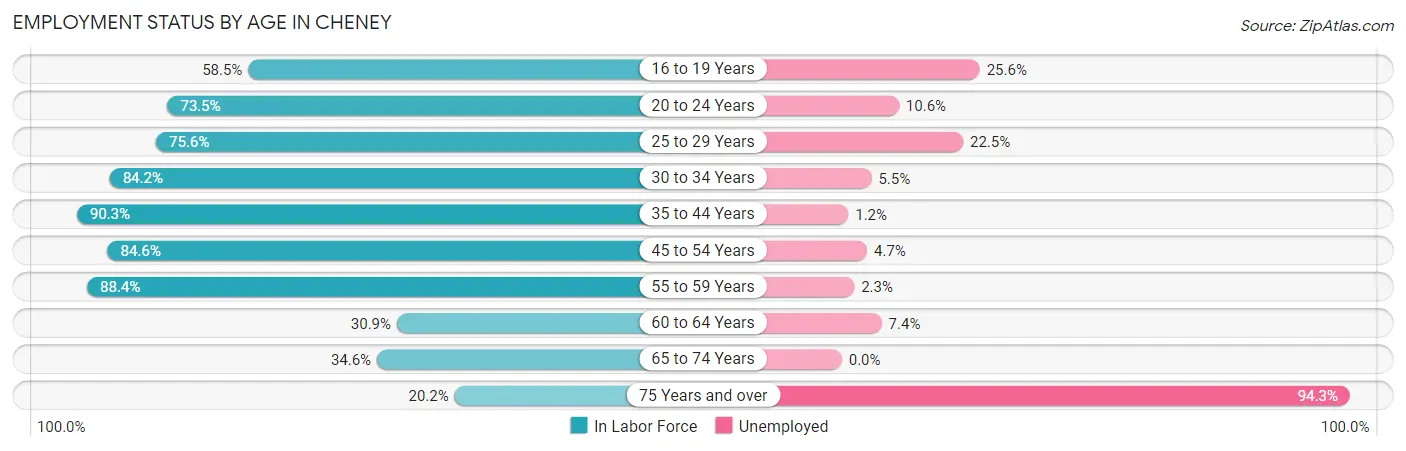
Employment Status by Age in Cheney
According to the labor force statistics for Cheney, out of the total population over 16 years of age (11,164), 67.8% or 7,569 individuals are in the labor force, with 13.0% or 984 of them unemployed. The age group with the highest labor force participation rate is 35 to 44 years, with 90.3% or 846 individuals in the labor force. Within the labor force, the 75 years and over age range has the highest percentage of unemployed individuals, with 94.3% or 116 of them being unemployed.
| Age Bracket | In Labor Force | Unemployed |
| 16 to 19 Years | 1,037 (58.5%) | 265 (25.6%) |
| 20 to 24 Years | 2,671 (73.5%) | 283 (10.6%) |
| 25 to 29 Years | 991 (75.6%) | 223 (22.5%) |
| 30 to 34 Years | 655 (84.2%) | 36 (5.5%) |
| 35 to 44 Years | 846 (90.3%) | 10 (1.2%) |
| 45 to 54 Years | 531 (84.6%) | 25 (4.7%) |
| 55 to 59 Years | 350 (88.4%) | 8 (2.3%) |
| 60 to 64 Years | 122 (30.9%) | 9 (7.4%) |
| 65 to 74 Years | 243 (34.6%) | 0 (0.0%) |
| 75 Years and over | 123 (20.2%) | 116 (94.3%) |
| Total | 7,569 (67.8%) | 984 (13.0%) |
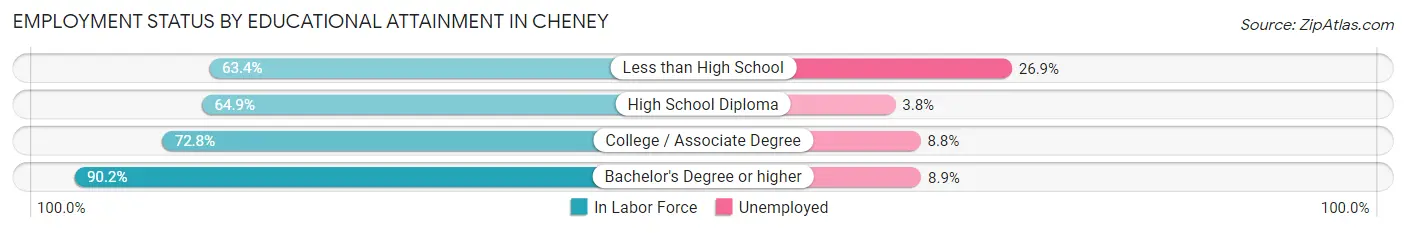
Employment Status by Educational Attainment in Cheney
According to labor force statistics for Cheney, 78.6% of individuals (3,494) out of the total population between 25 and 64 years of age (4,445) are in the labor force, with 8.9% or 311 of them being unemployed. The group with the highest labor force participation rate are those with the educational attainment of bachelor's degree or higher, with 90.2% or 1,727 individuals in the labor force. Within the labor force, individuals with less than high school education have the highest percentage of unemployment, with 26.9% or 35 of them being unemployed.
| Educational Attainment | In Labor Force | Unemployed |
| Less than High School | 130 (63.4%) | 55 (26.9%) |
| High School Diploma | 451 (64.9%) | 26 (3.8%) |
| College / Associate Degree | 1,187 (72.8%) | 143 (8.8%) |
| Bachelor's Degree or higher | 1,727 (90.2%) | 170 (8.9%) |
| Total | 3,494 (78.6%) | 396 (8.9%) |
Employment Occupations by Sex in Cheney
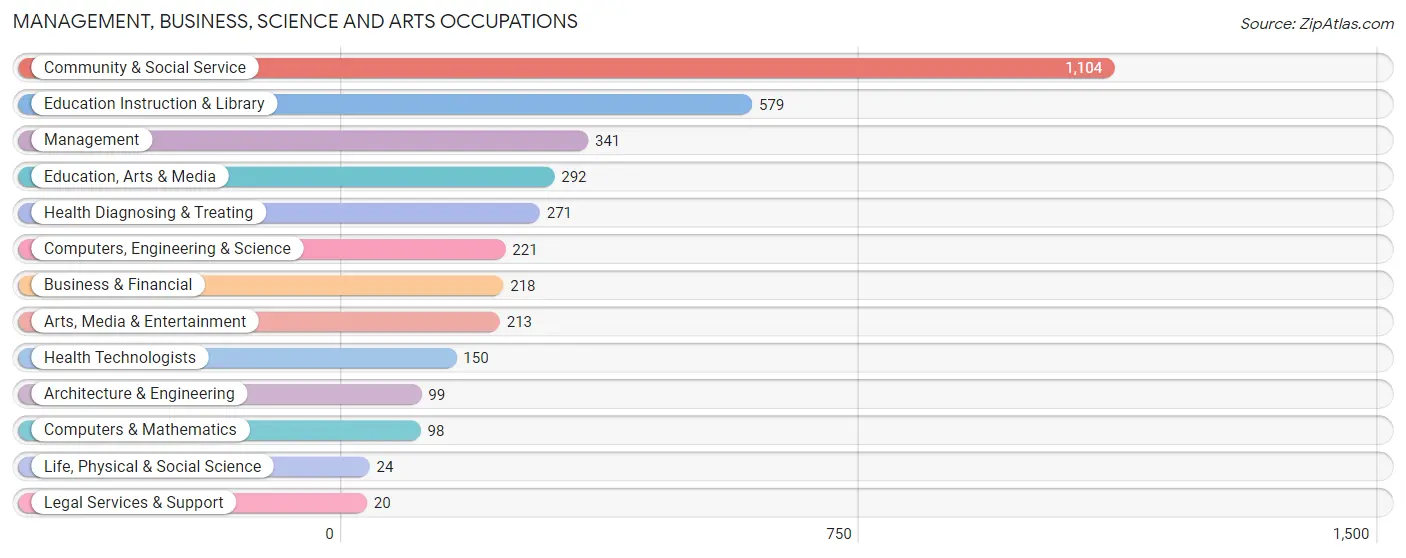
Management, Business, Science and Arts Occupations
The most common Management, Business, Science and Arts occupations in Cheney are Community & Social Service (1,104 | 17.3%), Education Instruction & Library (579 | 9.1%), Management (341 | 5.3%), Education, Arts & Media (292 | 4.6%), and Health Diagnosing & Treating (271 | 4.2%).
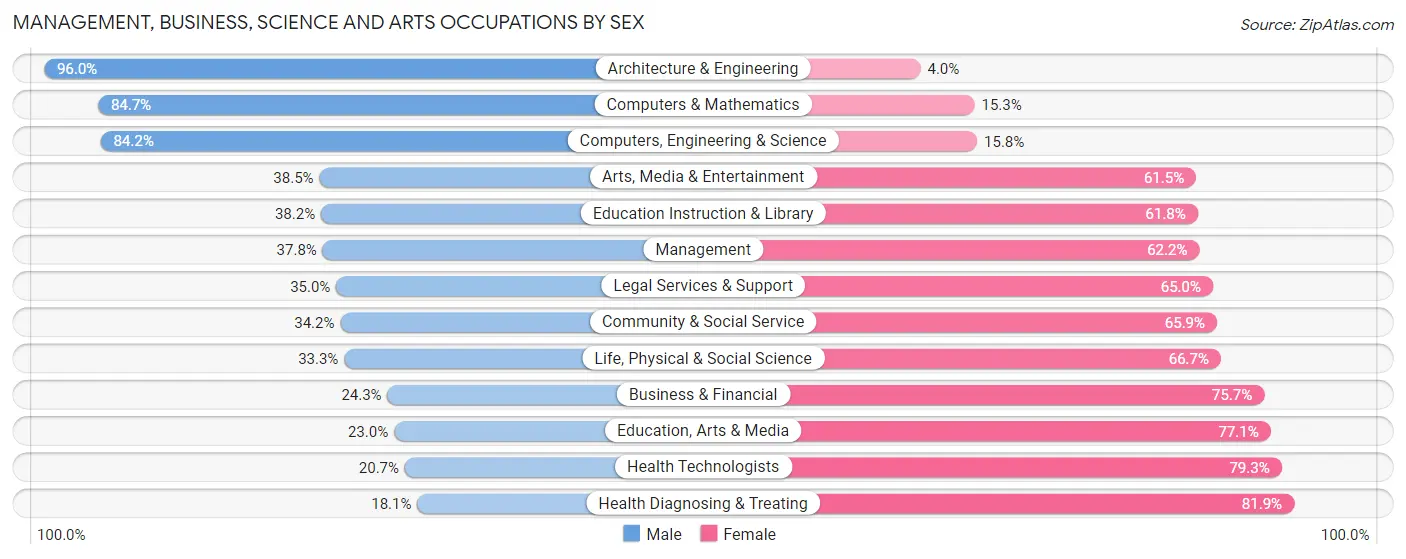
Management, Business, Science and Arts Occupations by Sex
Within the Management, Business, Science and Arts occupations in Cheney, the most male-oriented occupations are Architecture & Engineering (96.0%), Computers & Mathematics (84.7%), and Computers, Engineering & Science (84.2%), while the most female-oriented occupations are Health Diagnosing & Treating (81.9%), Health Technologists (79.3%), and Education, Arts & Media (77.0%).
| Occupation | Male | Female |
| Management | 129 (37.8%) | 212 (62.2%) |
| Business & Financial | 53 (24.3%) | 165 (75.7%) |
| Computers, Engineering & Science | 186 (84.2%) | 35 (15.8%) |
| Computers & Mathematics | 83 (84.7%) | 15 (15.3%) |
| Architecture & Engineering | 95 (96.0%) | 4 (4.0%) |
| Life, Physical & Social Science | 8 (33.3%) | 16 (66.7%) |
| Community & Social Service | 377 (34.2%) | 727 (65.8%) |
| Education, Arts & Media | 67 (23.0%) | 225 (77.0%) |
| Legal Services & Support | 7 (35.0%) | 13 (65.0%) |
| Education Instruction & Library | 221 (38.2%) | 358 (61.8%) |
| Arts, Media & Entertainment | 82 (38.5%) | 131 (61.5%) |
| Health Diagnosing & Treating | 49 (18.1%) | 222 (81.9%) |
| Health Technologists | 31 (20.7%) | 119 (79.3%) |
| Total (Category) | 794 (36.8%) | 1,361 (63.2%) |
| Total (Overall) | 2,838 (44.4%) | 3,556 (55.6%) |
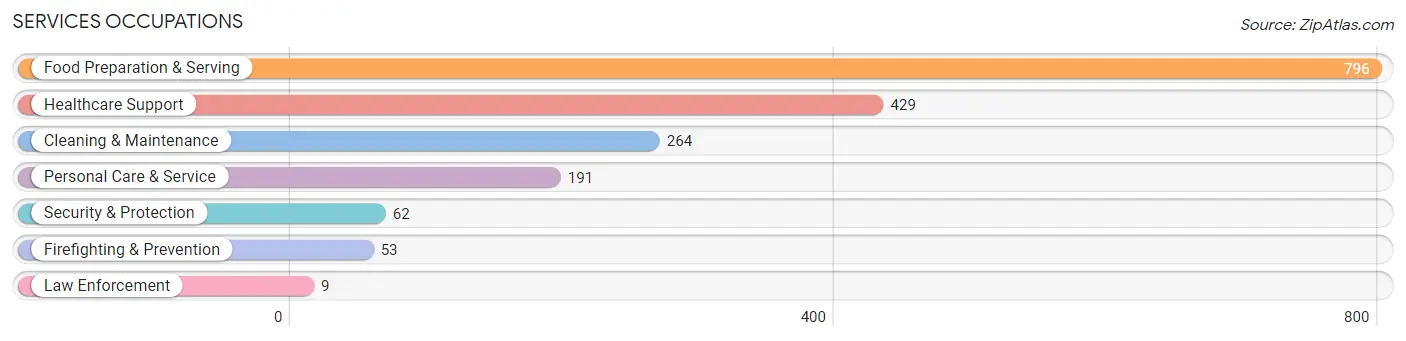
Services Occupations
The most common Services occupations in Cheney are Food Preparation & Serving (796 | 12.4%), Healthcare Support (429 | 6.7%), Cleaning & Maintenance (264 | 4.1%), Personal Care & Service (191 | 3.0%), and Security & Protection (62 | 1.0%).
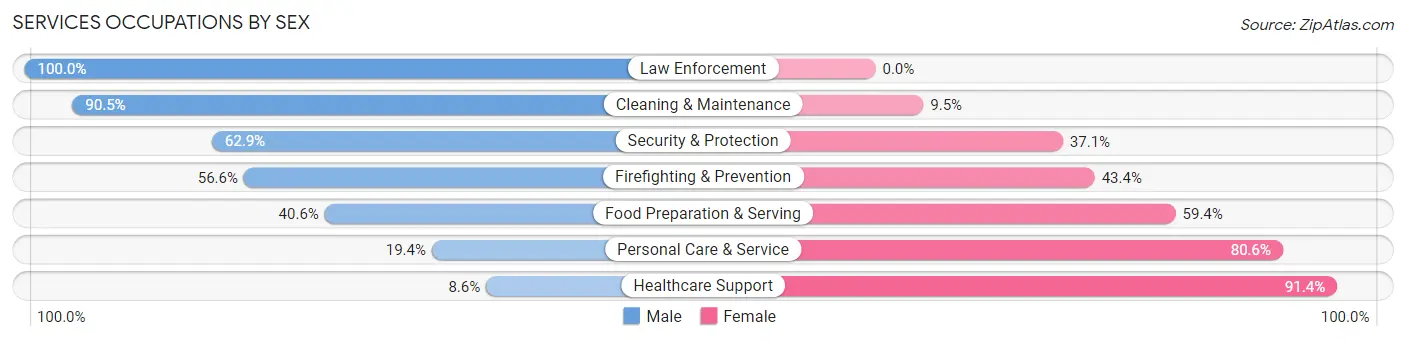
Services Occupations by Sex
Within the Services occupations in Cheney, the most male-oriented occupations are Law Enforcement (100.0%), Cleaning & Maintenance (90.5%), and Security & Protection (62.9%), while the most female-oriented occupations are Healthcare Support (91.4%), Personal Care & Service (80.6%), and Food Preparation & Serving (59.4%).
| Occupation | Male | Female |
| Healthcare Support | 37 (8.6%) | 392 (91.4%) |
| Security & Protection | 39 (62.9%) | 23 (37.1%) |
| Firefighting & Prevention | 30 (56.6%) | 23 (43.4%) |
| Law Enforcement | 9 (100.0%) | 0 (0.0%) |
| Food Preparation & Serving | 323 (40.6%) | 473 (59.4%) |
| Cleaning & Maintenance | 239 (90.5%) | 25 (9.5%) |
| Personal Care & Service | 37 (19.4%) | 154 (80.6%) |
| Total (Category) | 675 (38.8%) | 1,067 (61.3%) |
| Total (Overall) | 2,838 (44.4%) | 3,556 (55.6%) |
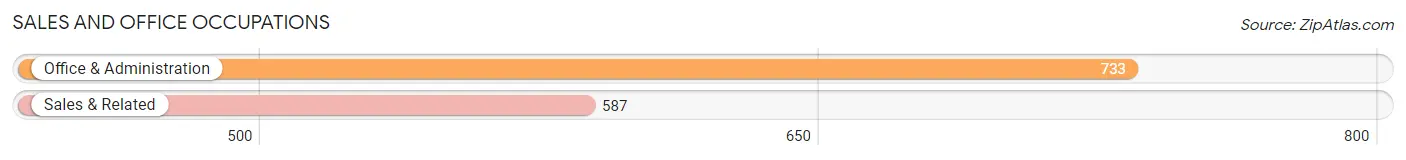
Sales and Office Occupations
The most common Sales and Office occupations in Cheney are Office & Administration (733 | 11.5%), and Sales & Related (587 | 9.2%).
Sales and Office Occupations by Sex
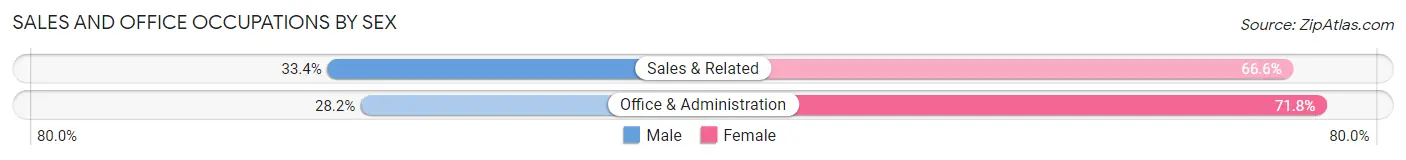
| Occupation | Male | Female |
| Sales & Related | 196 (33.4%) | 391 (66.6%) |
| Office & Administration | 207 (28.2%) | 526 (71.8%) |
| Total (Category) | 403 (30.5%) | 917 (69.5%) |
| Total (Overall) | 2,838 (44.4%) | 3,556 (55.6%) |
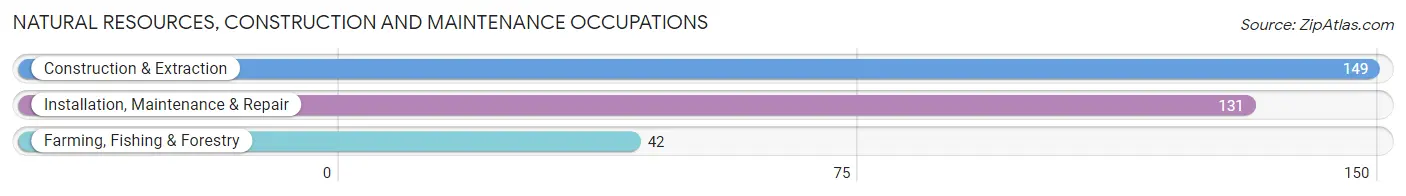
Natural Resources, Construction and Maintenance Occupations
The most common Natural Resources, Construction and Maintenance occupations in Cheney are Construction & Extraction (149 | 2.3%), Installation, Maintenance & Repair (131 | 2.1%), and Farming, Fishing & Forestry (42 | 0.7%).
Natural Resources, Construction and Maintenance Occupations by Sex
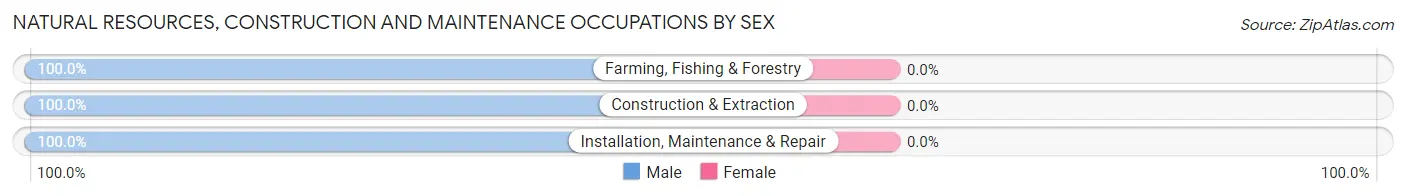
| Occupation | Male | Female |
| Farming, Fishing & Forestry | 42 (100.0%) | 0 (0.0%) |
| Construction & Extraction | 149 (100.0%) | 0 (0.0%) |
| Installation, Maintenance & Repair | 131 (100.0%) | 0 (0.0%) |
| Total (Category) | 322 (100.0%) | 0 (0.0%) |
| Total (Overall) | 2,838 (44.4%) | 3,556 (55.6%) |
Production, Transportation and Moving Occupations
The most common Production, Transportation and Moving occupations in Cheney are Transportation (395 | 6.2%), Material Moving (247 | 3.9%), and Production (213 | 3.3%).
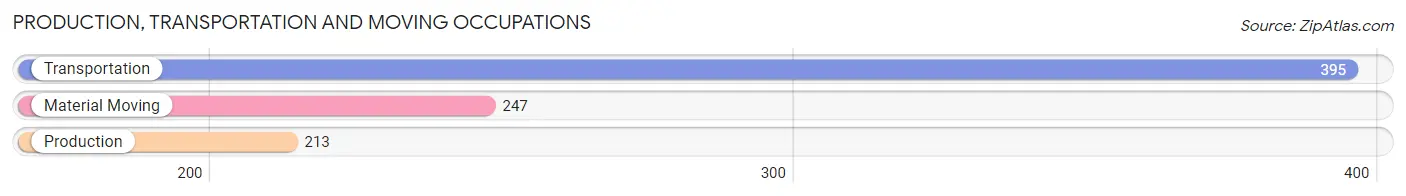
Production, Transportation and Moving Occupations by Sex
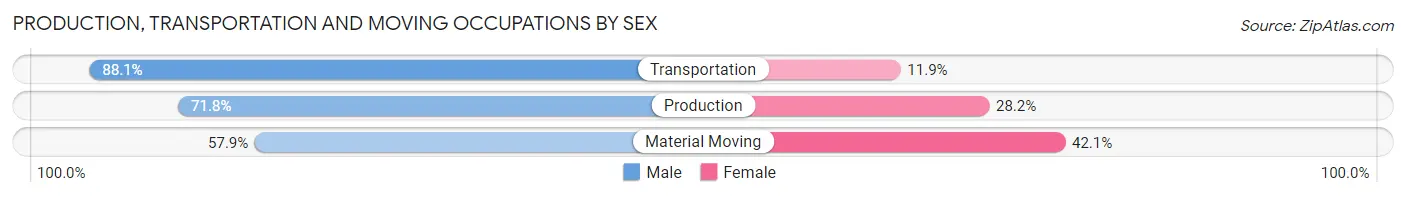
| Occupation | Male | Female |
| Production | 153 (71.8%) | 60 (28.2%) |
| Transportation | 348 (88.1%) | 47 (11.9%) |
| Material Moving | 143 (57.9%) | 104 (42.1%) |
| Total (Category) | 644 (75.3%) | 211 (24.7%) |
| Total (Overall) | 2,838 (44.4%) | 3,556 (55.6%) |
Employment Industries by Sex in Cheney
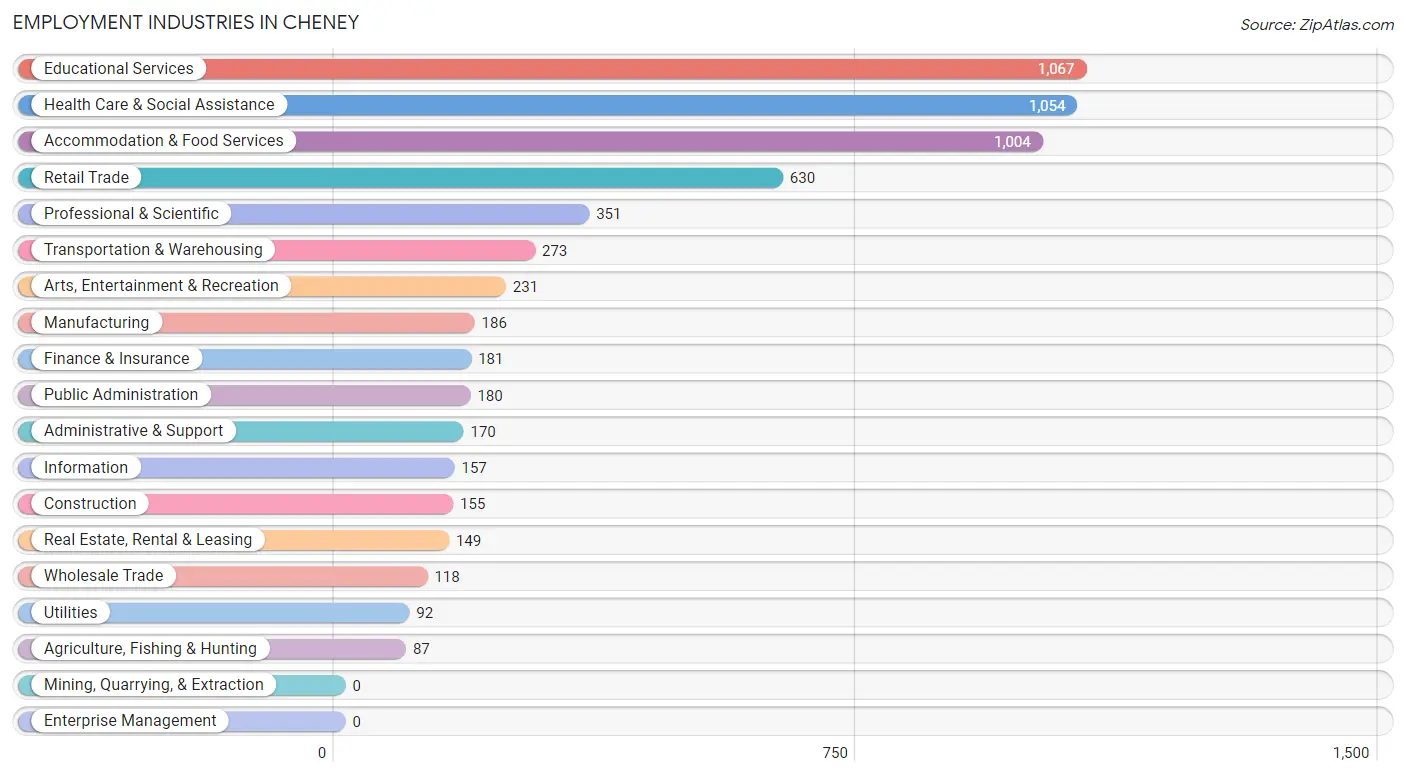
Employment Industries in Cheney
The major employment industries in Cheney include Educational Services (1,067 | 16.7%), Health Care & Social Assistance (1,054 | 16.5%), Accommodation & Food Services (1,004 | 15.7%), Retail Trade (630 | 9.9%), and Professional & Scientific (351 | 5.5%).
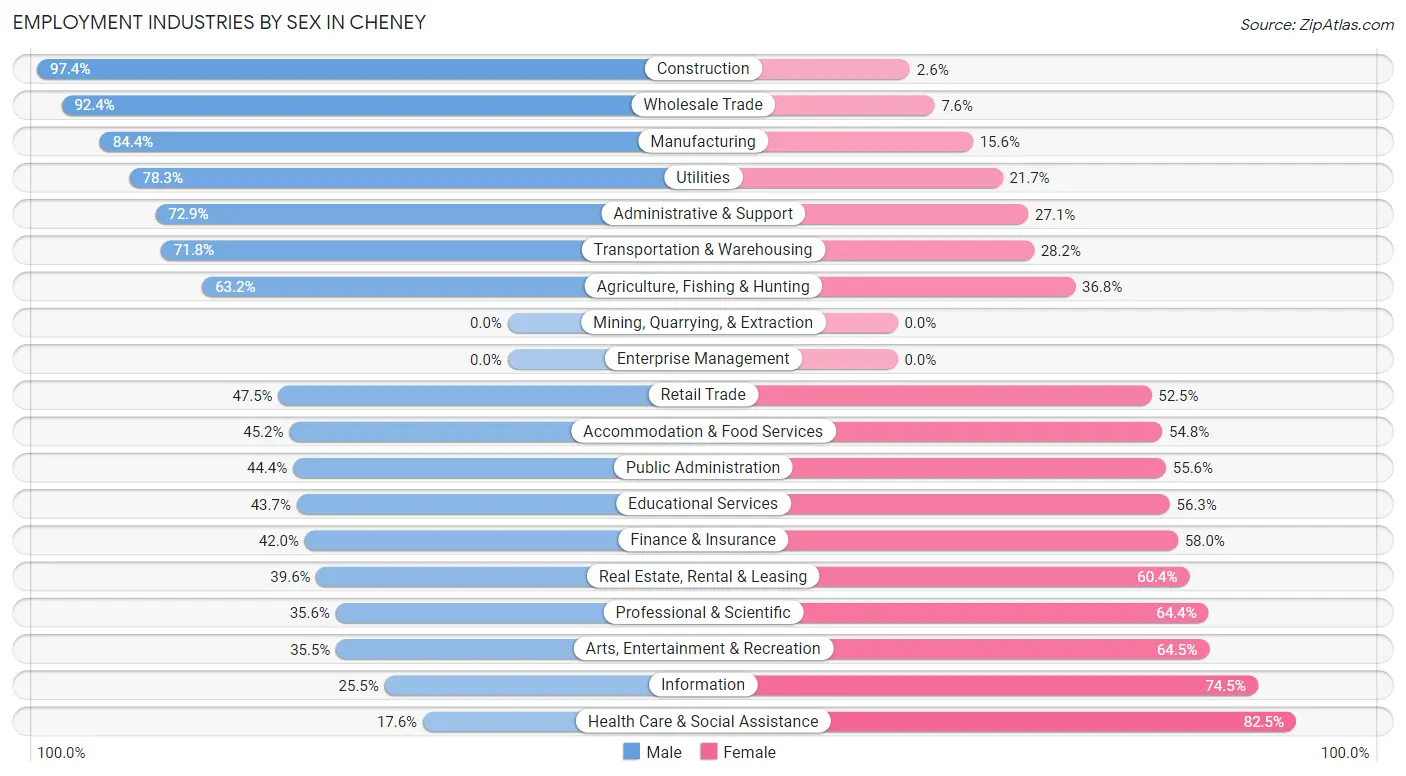
Employment Industries by Sex in Cheney
The Cheney industries that see more men than women are Construction (97.4%), Wholesale Trade (92.4%), and Manufacturing (84.4%), whereas the industries that tend to have a higher number of women are Health Care & Social Assistance (82.5%), Information (74.5%), and Arts, Entertainment & Recreation (64.5%).
| Industry | Male | Female |
| Agriculture, Fishing & Hunting | 55 (63.2%) | 32 (36.8%) |
| Mining, Quarrying, & Extraction | 0 (0.0%) | 0 (0.0%) |
| Construction | 151 (97.4%) | 4 (2.6%) |
| Manufacturing | 157 (84.4%) | 29 (15.6%) |
| Wholesale Trade | 109 (92.4%) | 9 (7.6%) |
| Retail Trade | 299 (47.5%) | 331 (52.5%) |
| Transportation & Warehousing | 196 (71.8%) | 77 (28.2%) |
| Utilities | 72 (78.3%) | 20 (21.7%) |
| Information | 40 (25.5%) | 117 (74.5%) |
| Finance & Insurance | 76 (42.0%) | 105 (58.0%) |
| Real Estate, Rental & Leasing | 59 (39.6%) | 90 (60.4%) |
| Professional & Scientific | 125 (35.6%) | 226 (64.4%) |
| Enterprise Management | 0 (0.0%) | 0 (0.0%) |
| Administrative & Support | 124 (72.9%) | 46 (27.1%) |
| Educational Services | 466 (43.7%) | 601 (56.3%) |
| Health Care & Social Assistance | 185 (17.5%) | 869 (82.5%) |
| Arts, Entertainment & Recreation | 82 (35.5%) | 149 (64.5%) |
| Accommodation & Food Services | 454 (45.2%) | 550 (54.8%) |
| Public Administration | 80 (44.4%) | 100 (55.6%) |
| Total | 2,838 (44.4%) | 3,556 (55.6%) |
Education in Cheney
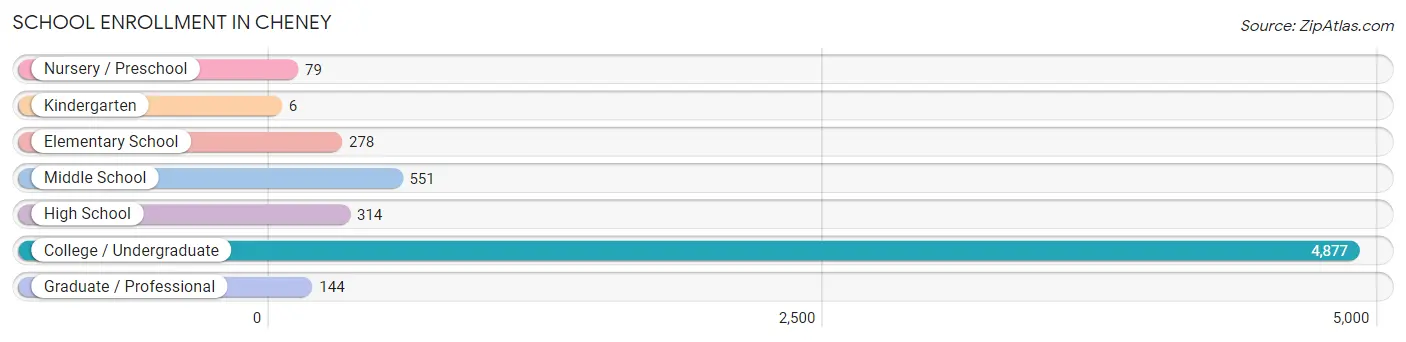
School Enrollment in Cheney
The most common levels of schooling among the 6,249 students in Cheney are college / undergraduate (4,877 | 78.0%), middle school (551 | 8.8%), and high school (314 | 5.0%).
| School Level | # Students | % Students |
| Nursery / Preschool | 79 | 1.3% |
| Kindergarten | 6 | 0.1% |
| Elementary School | 278 | 4.4% |
| Middle School | 551 | 8.8% |
| High School | 314 | 5.0% |
| College / Undergraduate | 4,877 | 78.0% |
| Graduate / Professional | 144 | 2.3% |
| Total | 6,249 | 100.0% |
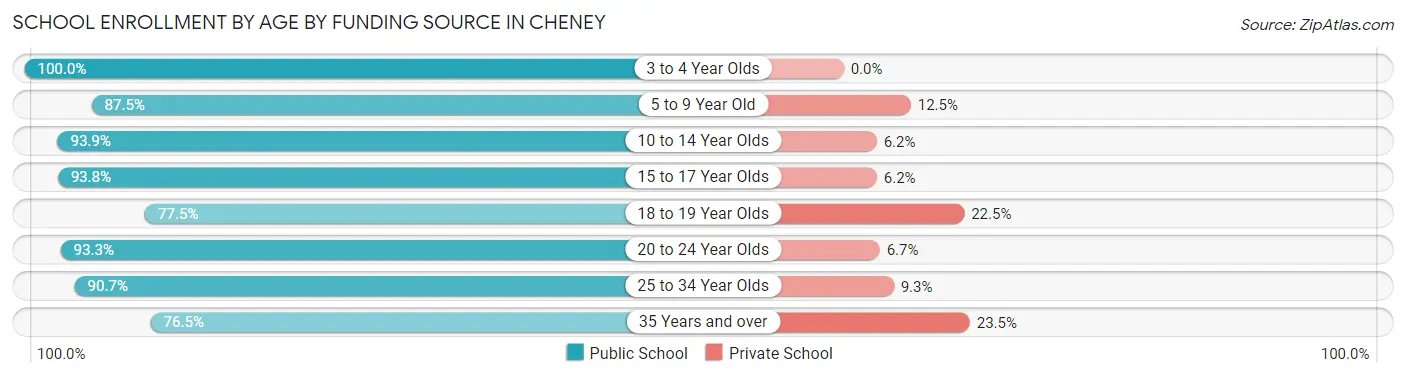
School Enrollment by Age by Funding Source in Cheney
Out of a total of 6,249 students who are enrolled in schools in Cheney, 719 (11.5%) attend a private institution, while the remaining 5,530 (88.5%) are enrolled in public schools. The age group of 35 years and over has the highest likelihood of being enrolled in private schools, with 66 (23.5% in the age bracket) enrolled. Conversely, the age group of 3 to 4 year olds has the lowest likelihood of being enrolled in a private school, with 72 (100.0% in the age bracket) attending a public institution.
| Age Bracket | Public School | Private School |
| 3 to 4 Year Olds | 72 (100.0%) | 0 (0.0%) |
| 5 to 9 Year Old | 196 (87.5%) | 28 (12.5%) |
| 10 to 14 Year Olds | 610 (93.9%) | 40 (6.1%) |
| 15 to 17 Year Olds | 258 (93.8%) | 17 (6.2%) |
| 18 to 19 Year Olds | 1,167 (77.5%) | 338 (22.5%) |
| 20 to 24 Year Olds | 2,514 (93.3%) | 181 (6.7%) |
| 25 to 34 Year Olds | 496 (90.7%) | 51 (9.3%) |
| 35 Years and over | 215 (76.5%) | 66 (23.5%) |
| Total | 5,530 (88.5%) | 719 (11.5%) |
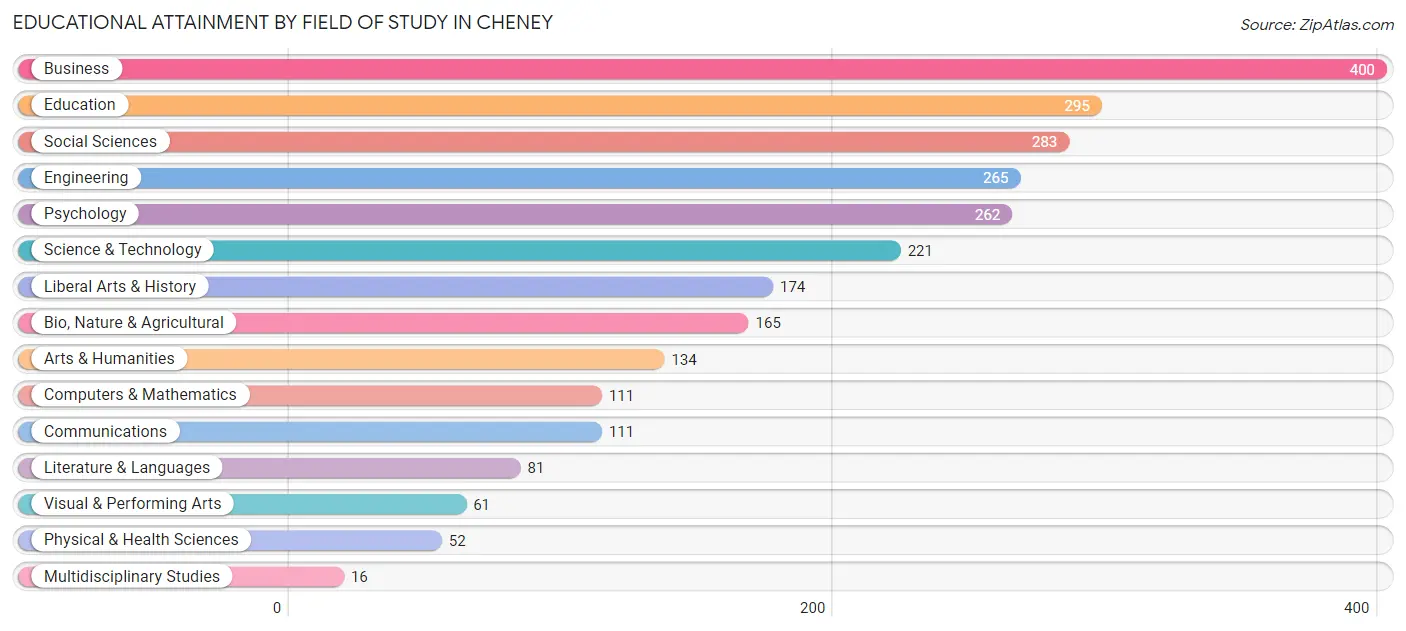
Educational Attainment by Field of Study in Cheney
Business (400 | 15.2%), education (295 | 11.2%), social sciences (283 | 10.8%), engineering (265 | 10.1%), and psychology (262 | 10.0%) are the most common fields of study among 2,631 individuals in Cheney who have obtained a bachelor's degree or higher.
| Field of Study | # Graduates | % Graduates |
| Computers & Mathematics | 111 | 4.2% |
| Bio, Nature & Agricultural | 165 | 6.3% |
| Physical & Health Sciences | 52 | 2.0% |
| Psychology | 262 | 10.0% |
| Social Sciences | 283 | 10.8% |
| Engineering | 265 | 10.1% |
| Multidisciplinary Studies | 16 | 0.6% |
| Science & Technology | 221 | 8.4% |
| Business | 400 | 15.2% |
| Education | 295 | 11.2% |
| Literature & Languages | 81 | 3.1% |
| Liberal Arts & History | 174 | 6.6% |
| Visual & Performing Arts | 61 | 2.3% |
| Communications | 111 | 4.2% |
| Arts & Humanities | 134 | 5.1% |
| Total | 2,631 | 100.0% |
Transportation & Commute in Cheney
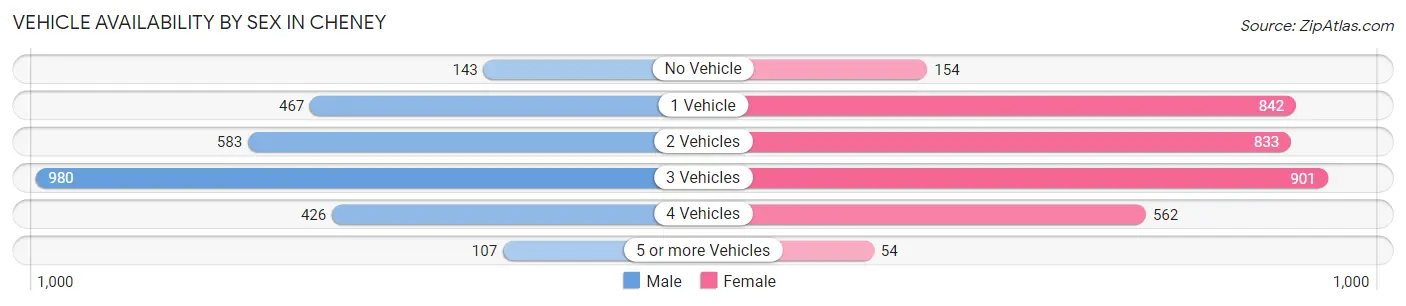
Vehicle Availability by Sex in Cheney
The most prevalent vehicle ownership categories in Cheney are males with 3 vehicles (980, accounting for 36.2%) and females with 3 vehicles (901, making up 29.3%).
| Vehicles Available | Male | Female |
| No Vehicle | 143 (5.3%) | 154 (4.6%) |
| 1 Vehicle | 467 (17.3%) | 842 (25.2%) |
| 2 Vehicles | 583 (21.5%) | 833 (24.9%) |
| 3 Vehicles | 980 (36.2%) | 901 (26.9%) |
| 4 Vehicles | 426 (15.7%) | 562 (16.8%) |
| 5 or more Vehicles | 107 (4.0%) | 54 (1.6%) |
| Total | 2,706 (100.0%) | 3,346 (100.0%) |
Commute Time in Cheney
The most frequently occuring commute durations in Cheney are 30 to 34 minutes (1,000 commuters, 16.9%), 5 to 9 minutes (956 commuters, 16.2%), and 10 to 14 minutes (715 commuters, 12.1%).
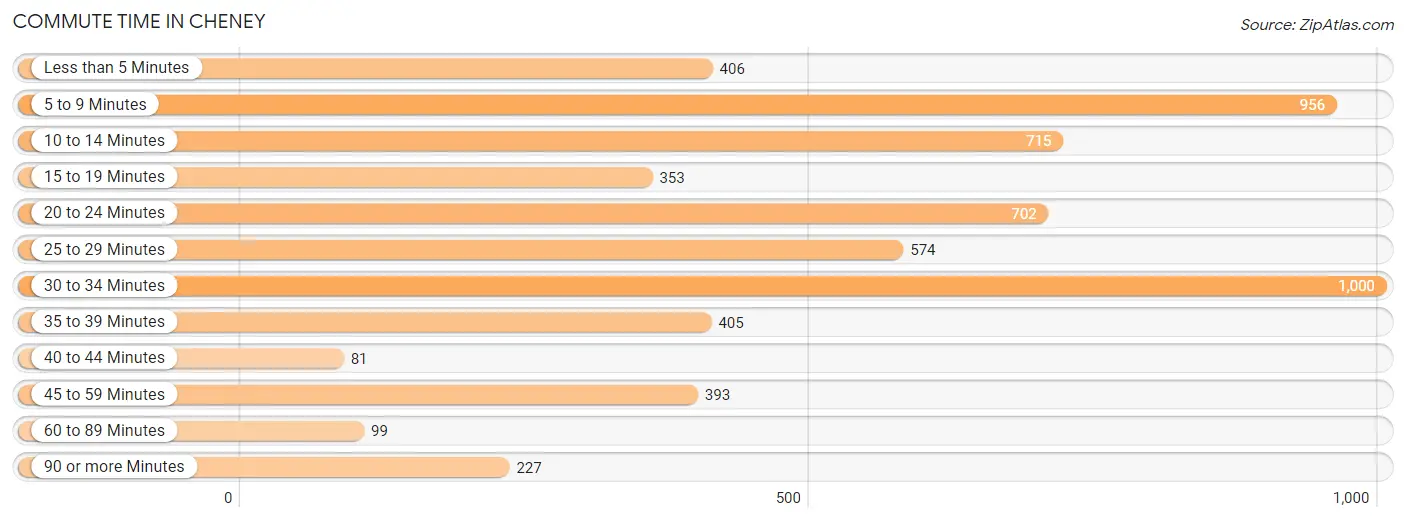
| Commute Time | # Commuters | % Commuters |
| Less than 5 Minutes | 406 | 6.9% |
| 5 to 9 Minutes | 956 | 16.2% |
| 10 to 14 Minutes | 715 | 12.1% |
| 15 to 19 Minutes | 353 | 6.0% |
| 20 to 24 Minutes | 702 | 11.9% |
| 25 to 29 Minutes | 574 | 9.7% |
| 30 to 34 Minutes | 1,000 | 16.9% |
| 35 to 39 Minutes | 405 | 6.9% |
| 40 to 44 Minutes | 81 | 1.4% |
| 45 to 59 Minutes | 393 | 6.7% |
| 60 to 89 Minutes | 99 | 1.7% |
| 90 or more Minutes | 227 | 3.8% |
Commute Time by Sex in Cheney
The most common commute times in Cheney are 5 to 9 minutes (488 commuters, 18.0%) for males and 30 to 34 minutes (599 commuters, 18.7%) for females.
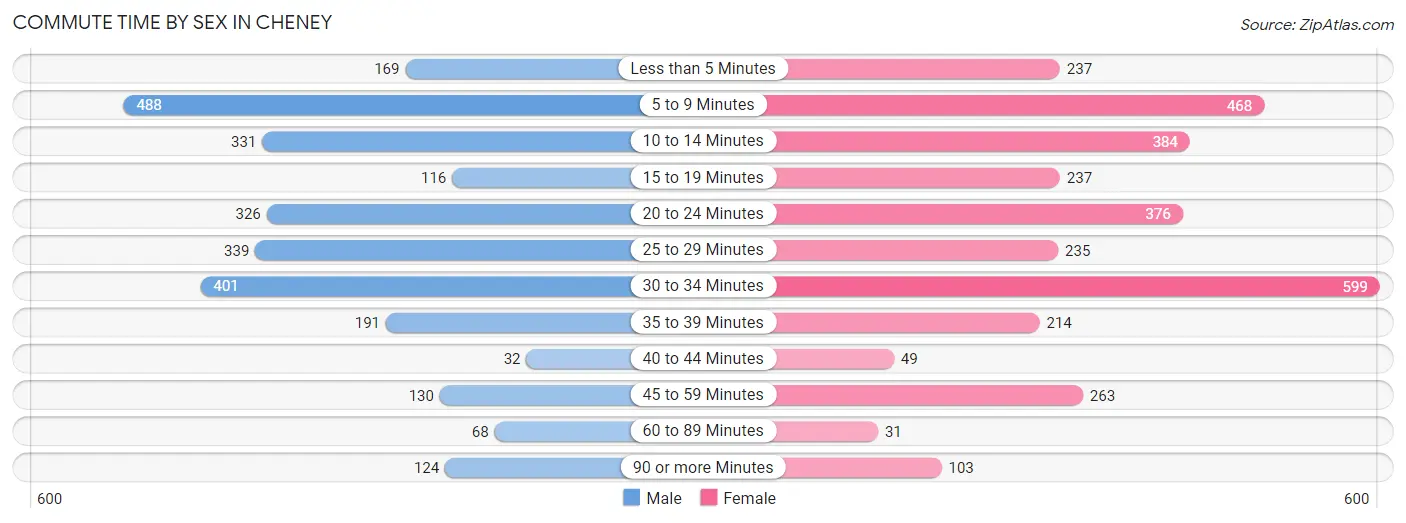
| Commute Time | Male | Female |
| Less than 5 Minutes | 169 (6.2%) | 237 (7.4%) |
| 5 to 9 Minutes | 488 (18.0%) | 468 (14.6%) |
| 10 to 14 Minutes | 331 (12.2%) | 384 (12.0%) |
| 15 to 19 Minutes | 116 (4.3%) | 237 (7.4%) |
| 20 to 24 Minutes | 326 (12.0%) | 376 (11.8%) |
| 25 to 29 Minutes | 339 (12.5%) | 235 (7.3%) |
| 30 to 34 Minutes | 401 (14.8%) | 599 (18.7%) |
| 35 to 39 Minutes | 191 (7.0%) | 214 (6.7%) |
| 40 to 44 Minutes | 32 (1.2%) | 49 (1.5%) |
| 45 to 59 Minutes | 130 (4.8%) | 263 (8.2%) |
| 60 to 89 Minutes | 68 (2.5%) | 31 (1.0%) |
| 90 or more Minutes | 124 (4.6%) | 103 (3.2%) |
Time of Departure to Work by Sex in Cheney
The most frequent times of departure to work in Cheney are 12:00 PM to 3:59 PM (470, 17.3%) for males and 12:00 PM to 3:59 PM (536, 16.8%) for females.
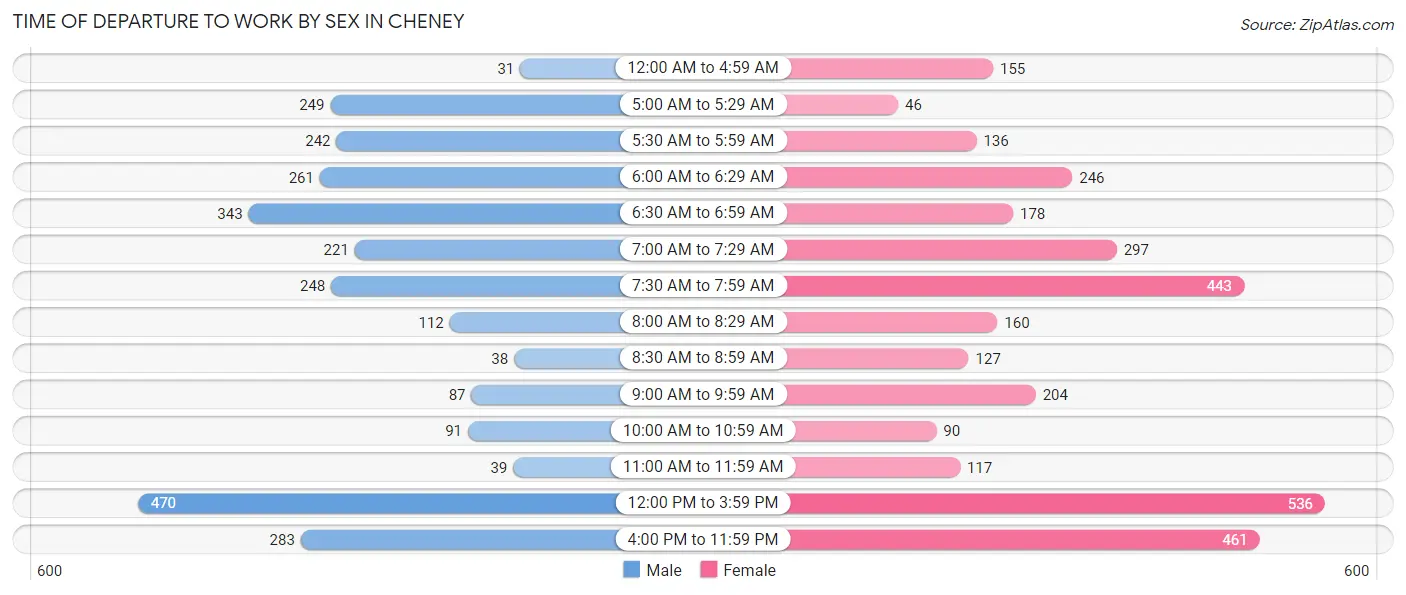
| Time of Departure | Male | Female |
| 12:00 AM to 4:59 AM | 31 (1.1%) | 155 (4.9%) |
| 5:00 AM to 5:29 AM | 249 (9.2%) | 46 (1.4%) |
| 5:30 AM to 5:59 AM | 242 (8.9%) | 136 (4.3%) |
| 6:00 AM to 6:29 AM | 261 (9.6%) | 246 (7.7%) |
| 6:30 AM to 6:59 AM | 343 (12.6%) | 178 (5.6%) |
| 7:00 AM to 7:29 AM | 221 (8.1%) | 297 (9.3%) |
| 7:30 AM to 7:59 AM | 248 (9.1%) | 443 (13.9%) |
| 8:00 AM to 8:29 AM | 112 (4.1%) | 160 (5.0%) |
| 8:30 AM to 8:59 AM | 38 (1.4%) | 127 (4.0%) |
| 9:00 AM to 9:59 AM | 87 (3.2%) | 204 (6.4%) |
| 10:00 AM to 10:59 AM | 91 (3.4%) | 90 (2.8%) |
| 11:00 AM to 11:59 AM | 39 (1.4%) | 117 (3.7%) |
| 12:00 PM to 3:59 PM | 470 (17.3%) | 536 (16.8%) |
| 4:00 PM to 11:59 PM | 283 (10.4%) | 461 (14.4%) |
| Total | 2,715 (100.0%) | 3,196 (100.0%) |
Housing Occupancy in Cheney
Occupancy by Ownership in Cheney
Of the total 4,893 dwellings in Cheney, owner-occupied units account for 1,732 (35.4%), while renter-occupied units make up 3,161 (64.6%).
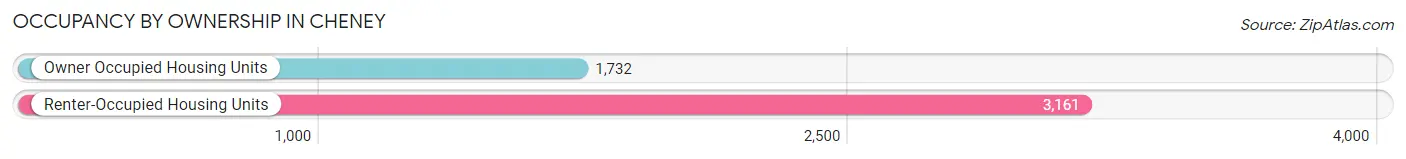
| Occupancy | # Housing Units | % Housing Units |
| Owner Occupied Housing Units | 1,732 | 35.4% |
| Renter-Occupied Housing Units | 3,161 | 64.6% |
| Total Occupied Housing Units | 4,893 | 100.0% |
Occupancy by Household Size in Cheney
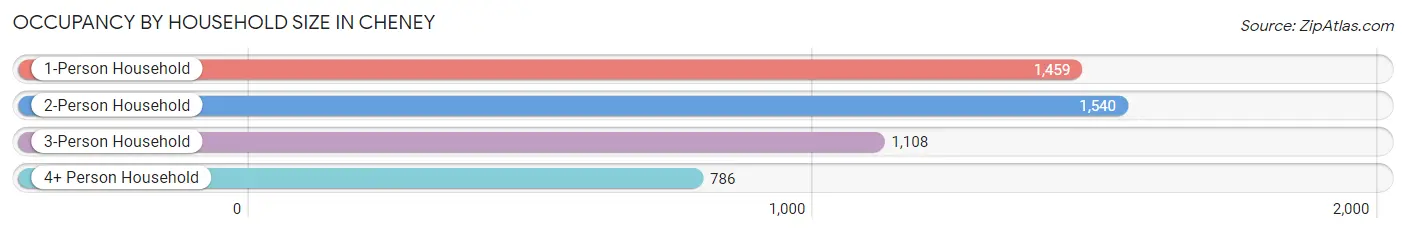
| Household Size | # Housing Units | % Housing Units |
| 1-Person Household | 1,459 | 29.8% |
| 2-Person Household | 1,540 | 31.5% |
| 3-Person Household | 1,108 | 22.6% |
| 4+ Person Household | 786 | 16.1% |
| Total Housing Units | 4,893 | 100.0% |
Occupancy by Ownership by Household Size in Cheney
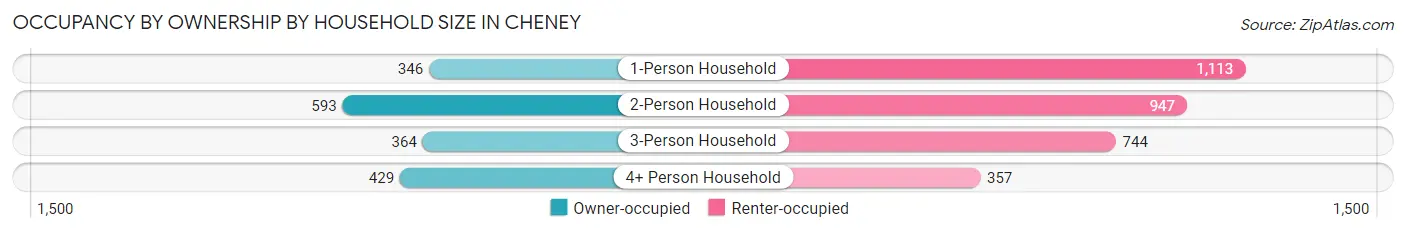
| Household Size | Owner-occupied | Renter-occupied |
| 1-Person Household | 346 (23.7%) | 1,113 (76.3%) |
| 2-Person Household | 593 (38.5%) | 947 (61.5%) |
| 3-Person Household | 364 (32.9%) | 744 (67.1%) |
| 4+ Person Household | 429 (54.6%) | 357 (45.4%) |
| Total Housing Units | 1,732 (35.4%) | 3,161 (64.6%) |
Occupancy by Educational Attainment in Cheney
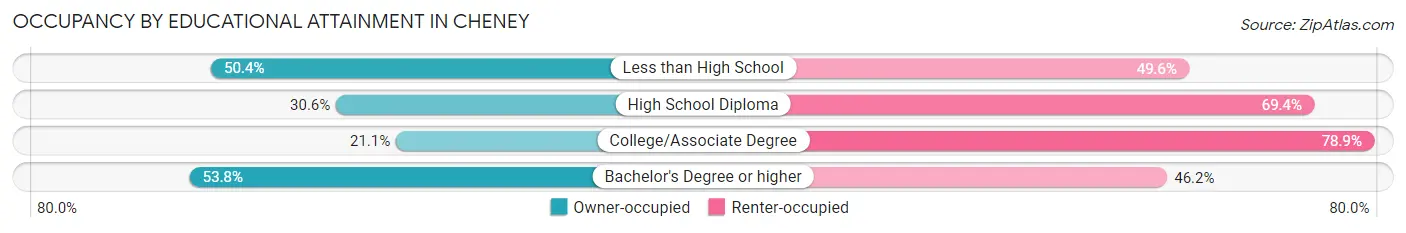
| Household Size | Owner-occupied | Renter-occupied |
| Less than High School | 121 (50.4%) | 119 (49.6%) |
| High School Diploma | 208 (30.6%) | 472 (69.4%) |
| College/Associate Degree | 474 (21.1%) | 1,773 (78.9%) |
| Bachelor's Degree or higher | 929 (53.8%) | 797 (46.2%) |
Occupancy by Age of Householder in Cheney
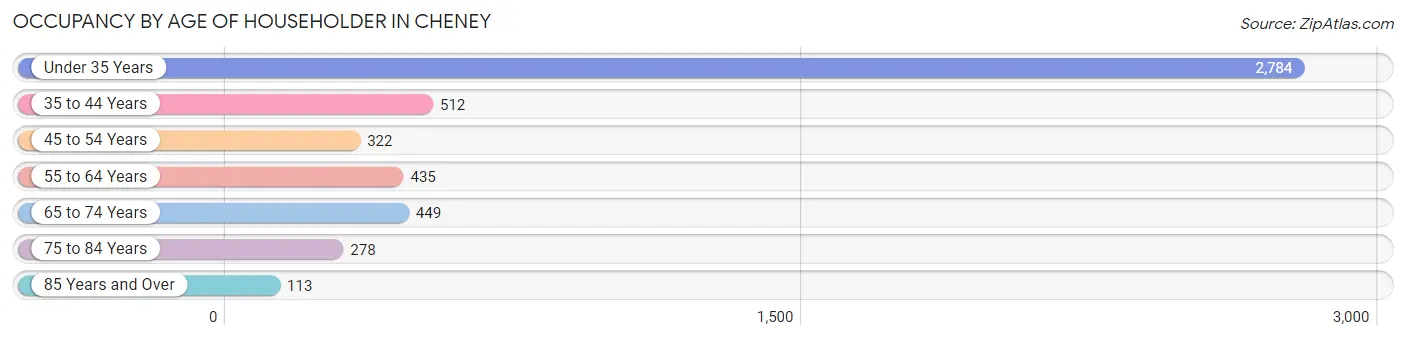
| Age Bracket | # Households | % Households |
| Under 35 Years | 2,784 | 56.9% |
| 35 to 44 Years | 512 | 10.5% |
| 45 to 54 Years | 322 | 6.6% |
| 55 to 64 Years | 435 | 8.9% |
| 65 to 74 Years | 449 | 9.2% |
| 75 to 84 Years | 278 | 5.7% |
| 85 Years and Over | 113 | 2.3% |
| Total | 4,893 | 100.0% |
Housing Finances in Cheney
Median Income by Occupancy in Cheney
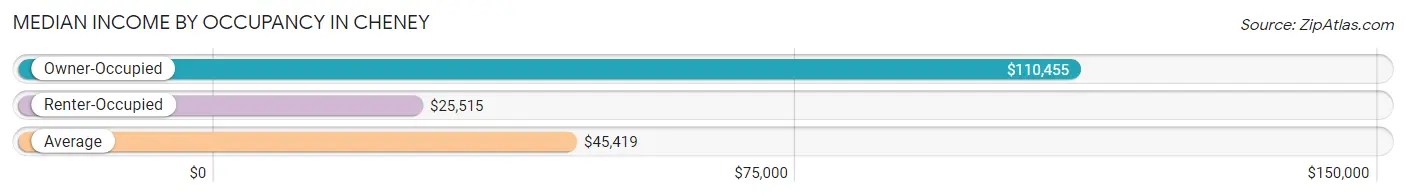
| Occupancy Type | # Households | Median Income |
| Owner-Occupied | 1,732 (35.4%) | $110,455 |
| Renter-Occupied | 3,161 (64.6%) | $25,515 |
| Average | 4,893 (100.0%) | $45,419 |
Occupancy by Householder Income Bracket in Cheney
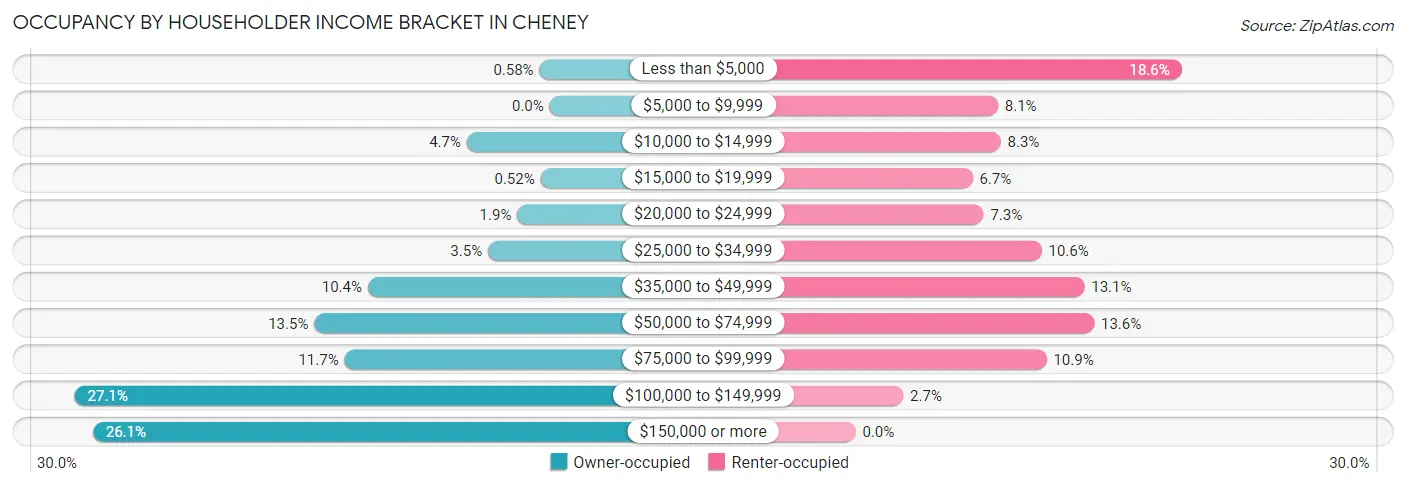
| Income Bracket | Owner-occupied | Renter-occupied |
| Less than $5,000 | 10 (0.6%) | 589 (18.6%) |
| $5,000 to $9,999 | 0 (0.0%) | 257 (8.1%) |
| $10,000 to $14,999 | 82 (4.7%) | 262 (8.3%) |
| $15,000 to $19,999 | 9 (0.5%) | 211 (6.7%) |
| $20,000 to $24,999 | 32 (1.8%) | 231 (7.3%) |
| $25,000 to $34,999 | 61 (3.5%) | 336 (10.6%) |
| $35,000 to $49,999 | 180 (10.4%) | 413 (13.1%) |
| $50,000 to $74,999 | 233 (13.5%) | 431 (13.6%) |
| $75,000 to $99,999 | 203 (11.7%) | 345 (10.9%) |
| $100,000 to $149,999 | 470 (27.1%) | 86 (2.7%) |
| $150,000 or more | 452 (26.1%) | 0 (0.0%) |
| Total | 1,732 (100.0%) | 3,161 (100.0%) |
Monthly Housing Cost Tiers in Cheney
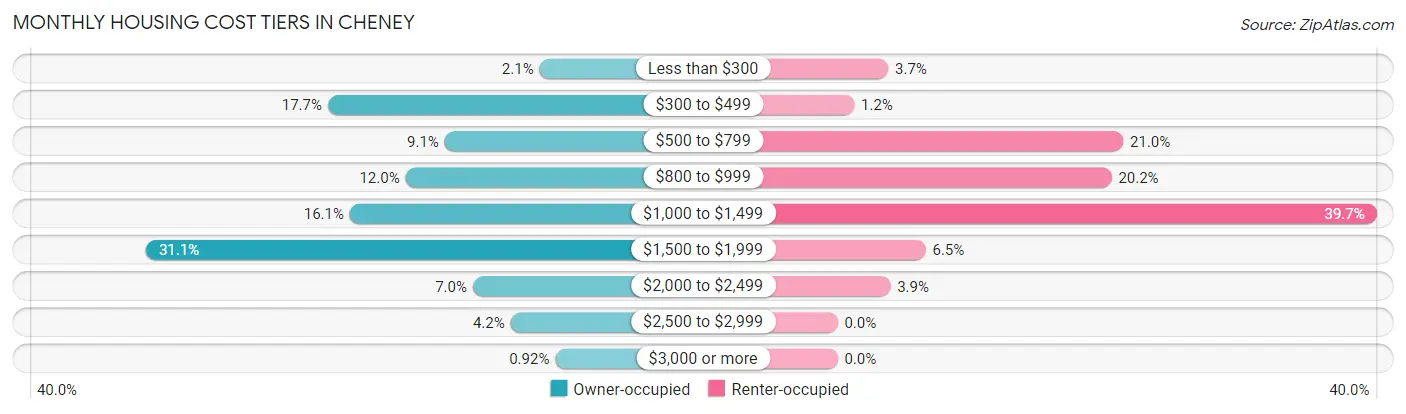
| Monthly Cost | Owner-occupied | Renter-occupied |
| Less than $300 | 36 (2.1%) | 118 (3.7%) |
| $300 to $499 | 306 (17.7%) | 39 (1.2%) |
| $500 to $799 | 157 (9.1%) | 665 (21.0%) |
| $800 to $999 | 207 (11.9%) | 638 (20.2%) |
| $1,000 to $1,499 | 278 (16.1%) | 1,255 (39.7%) |
| $1,500 to $1,999 | 538 (31.1%) | 205 (6.5%) |
| $2,000 to $2,499 | 121 (7.0%) | 123 (3.9%) |
| $2,500 to $2,999 | 73 (4.2%) | 0 (0.0%) |
| $3,000 or more | 16 (0.9%) | 0 (0.0%) |
| Total | 1,732 (100.0%) | 3,161 (100.0%) |
Physical Housing Characteristics in Cheney
Housing Structures in Cheney
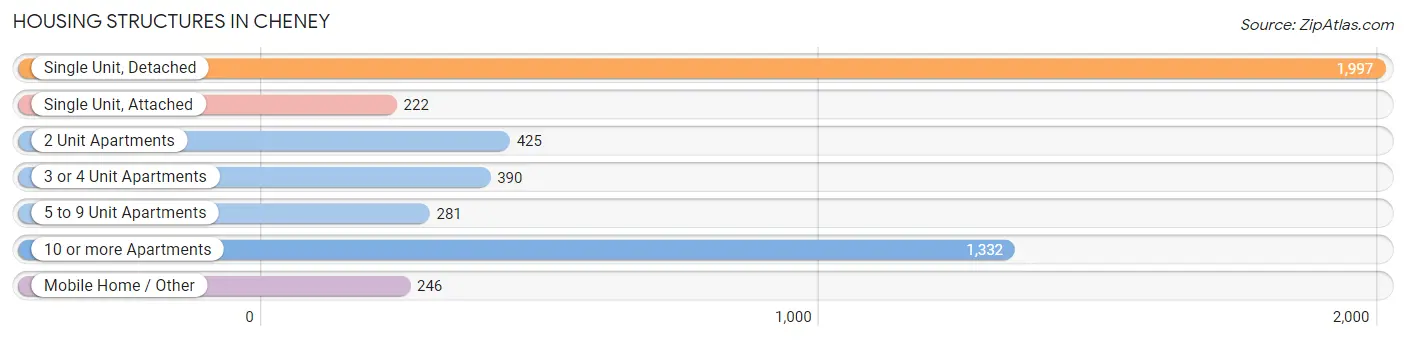
| Structure Type | # Housing Units | % Housing Units |
| Single Unit, Detached | 1,997 | 40.8% |
| Single Unit, Attached | 222 | 4.5% |
| 2 Unit Apartments | 425 | 8.7% |
| 3 or 4 Unit Apartments | 390 | 8.0% |
| 5 to 9 Unit Apartments | 281 | 5.7% |
| 10 or more Apartments | 1,332 | 27.2% |
| Mobile Home / Other | 246 | 5.0% |
| Total | 4,893 | 100.0% |
Housing Structures by Occupancy in Cheney
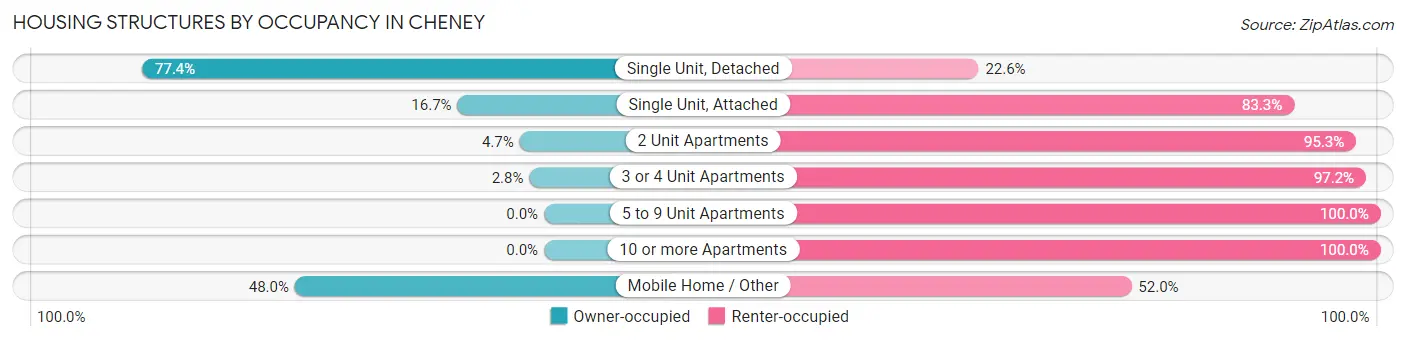
| Structure Type | Owner-occupied | Renter-occupied |
| Single Unit, Detached | 1,546 (77.4%) | 451 (22.6%) |
| Single Unit, Attached | 37 (16.7%) | 185 (83.3%) |
| 2 Unit Apartments | 20 (4.7%) | 405 (95.3%) |
| 3 or 4 Unit Apartments | 11 (2.8%) | 379 (97.2%) |
| 5 to 9 Unit Apartments | 0 (0.0%) | 281 (100.0%) |
| 10 or more Apartments | 0 (0.0%) | 1,332 (100.0%) |
| Mobile Home / Other | 118 (48.0%) | 128 (52.0%) |
| Total | 1,732 (35.4%) | 3,161 (64.6%) |
Housing Structures by Number of Rooms in Cheney
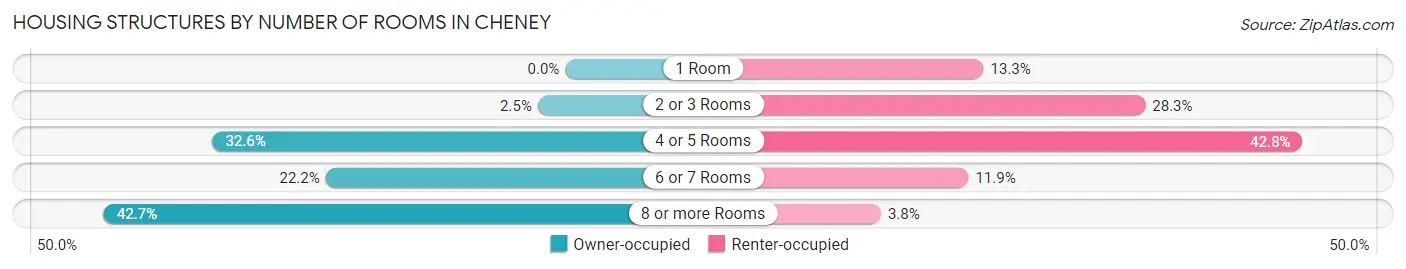
| Number of Rooms | Owner-occupied | Renter-occupied |
| 1 Room | 0 (0.0%) | 420 (13.3%) |
| 2 or 3 Rooms | 44 (2.5%) | 893 (28.2%) |
| 4 or 5 Rooms | 565 (32.6%) | 1,352 (42.8%) |
| 6 or 7 Rooms | 384 (22.2%) | 376 (11.9%) |
| 8 or more Rooms | 739 (42.7%) | 120 (3.8%) |
| Total | 1,732 (100.0%) | 3,161 (100.0%) |
Housing Structure by Heating Type in Cheney
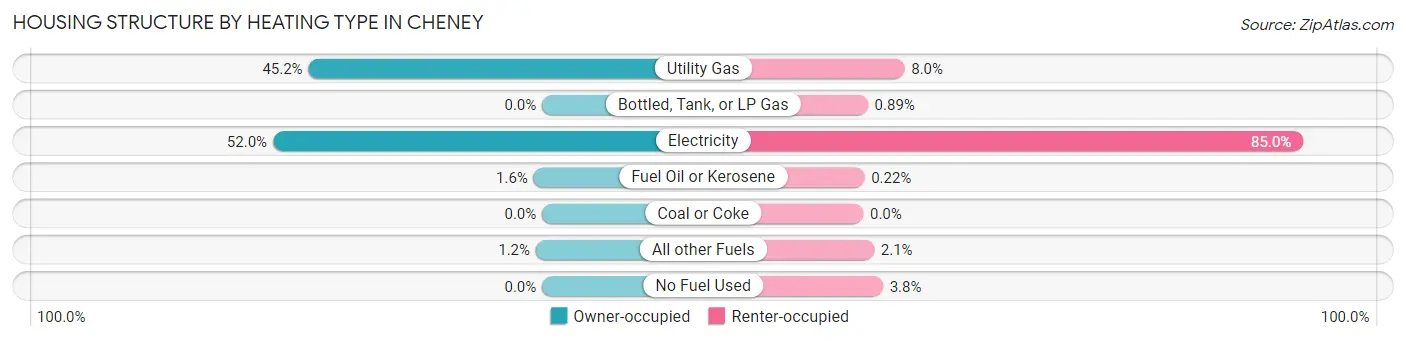
| Heating Type | Owner-occupied | Renter-occupied |
| Utility Gas | 782 (45.2%) | 252 (8.0%) |
| Bottled, Tank, or LP Gas | 0 (0.0%) | 28 (0.9%) |
| Electricity | 901 (52.0%) | 2,688 (85.0%) |
| Fuel Oil or Kerosene | 28 (1.6%) | 7 (0.2%) |
| Coal or Coke | 0 (0.0%) | 0 (0.0%) |
| All other Fuels | 21 (1.2%) | 66 (2.1%) |
| No Fuel Used | 0 (0.0%) | 120 (3.8%) |
| Total | 1,732 (100.0%) | 3,161 (100.0%) |
Household Vehicle Usage in Cheney
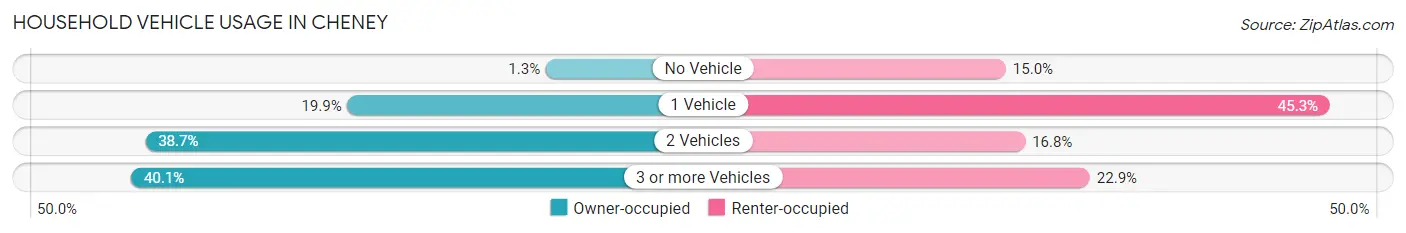
| Vehicles per Household | Owner-occupied | Renter-occupied |
| No Vehicle | 23 (1.3%) | 475 (15.0%) |
| 1 Vehicle | 344 (19.9%) | 1,431 (45.3%) |
| 2 Vehicles | 671 (38.7%) | 532 (16.8%) |
| 3 or more Vehicles | 694 (40.1%) | 723 (22.9%) |
| Total | 1,732 (100.0%) | 3,161 (100.0%) |
Real Estate & Mortgages in Cheney
Real Estate and Mortgage Overview in Cheney
| Characteristic | Without Mortgage | With Mortgage |
| Housing Units | 548 | 1,184 |
| Median Property Value | $252,600 | $321,900 |
| Median Household Income | $62,941 | $372 |
| Monthly Housing Costs | $473 | $16 |
| Real Estate Taxes | $2,356 | $8 |
Property Value by Mortgage Status in Cheney
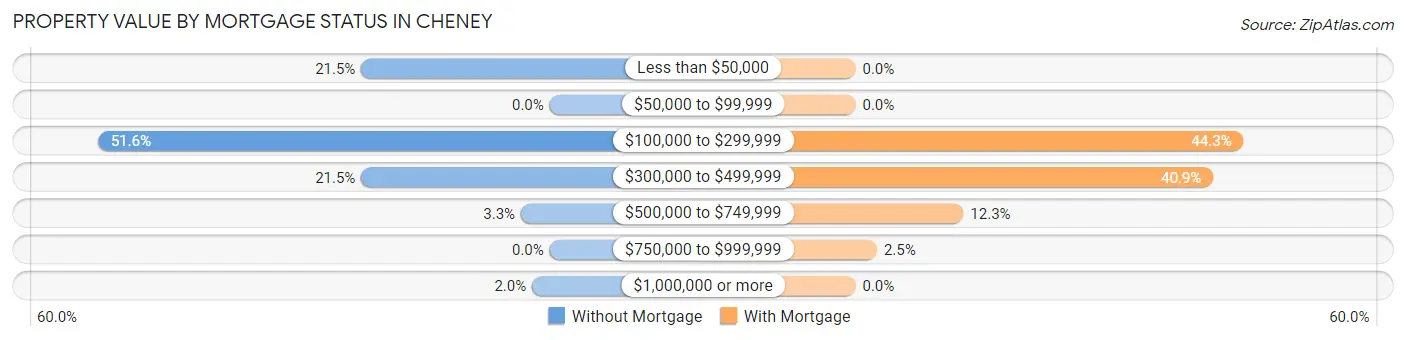
| Property Value | Without Mortgage | With Mortgage |
| Less than $50,000 | 118 (21.5%) | 0 (0.0%) |
| $50,000 to $99,999 | 0 (0.0%) | 0 (0.0%) |
| $100,000 to $299,999 | 283 (51.6%) | 525 (44.3%) |
| $300,000 to $499,999 | 118 (21.5%) | 484 (40.9%) |
| $500,000 to $749,999 | 18 (3.3%) | 146 (12.3%) |
| $750,000 to $999,999 | 0 (0.0%) | 29 (2.5%) |
| $1,000,000 or more | 11 (2.0%) | 0 (0.0%) |
| Total | 548 (100.0%) | 1,184 (100.0%) |
Household Income by Mortgage Status in Cheney
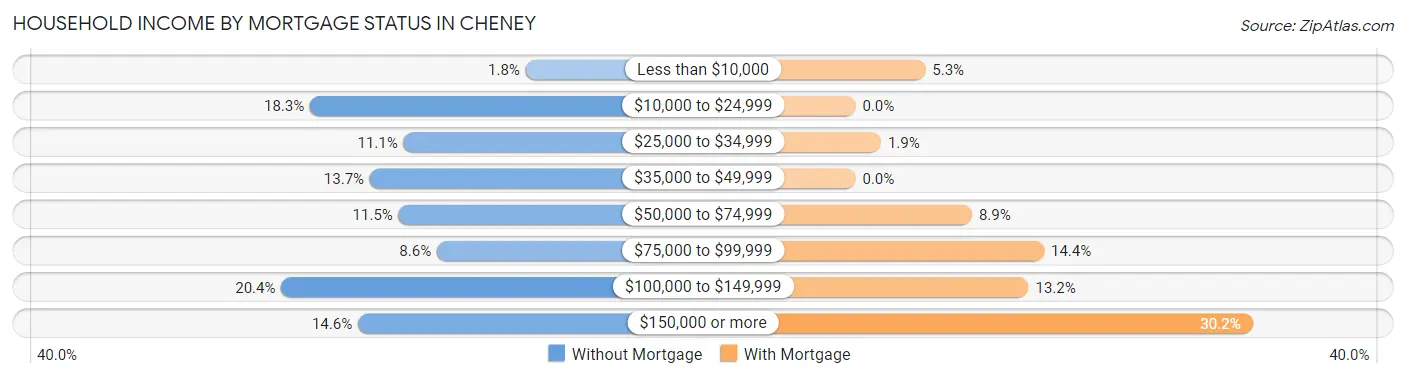
| Household Income | Without Mortgage | With Mortgage |
| Less than $10,000 | 10 (1.8%) | 63 (5.3%) |
| $10,000 to $24,999 | 100 (18.2%) | 0 (0.0%) |
| $25,000 to $34,999 | 61 (11.1%) | 23 (1.9%) |
| $35,000 to $49,999 | 75 (13.7%) | 0 (0.0%) |
| $50,000 to $74,999 | 63 (11.5%) | 105 (8.9%) |
| $75,000 to $99,999 | 47 (8.6%) | 170 (14.4%) |
| $100,000 to $149,999 | 112 (20.4%) | 156 (13.2%) |
| $150,000 or more | 80 (14.6%) | 358 (30.2%) |
| Total | 548 (100.0%) | 1,184 (100.0%) |
Property Value to Household Income Ratio in Cheney
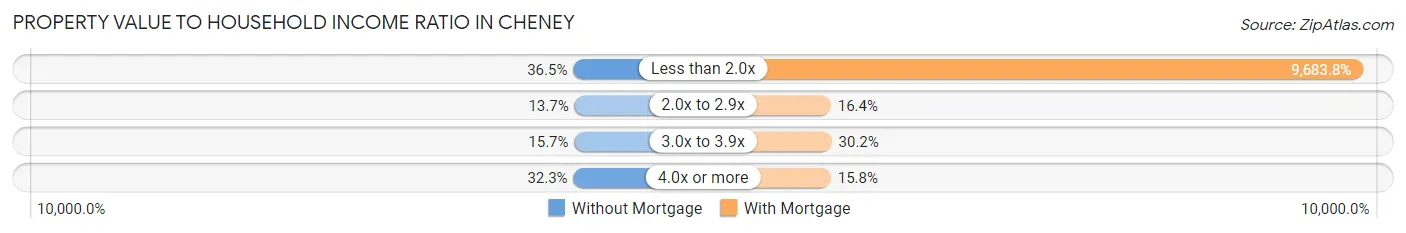
| Value-to-Income Ratio | Without Mortgage | With Mortgage |
| Less than 2.0x | 200 (36.5%) | 114,656 (9,683.8%) |
| 2.0x to 2.9x | 75 (13.7%) | 194 (16.4%) |
| 3.0x to 3.9x | 86 (15.7%) | 358 (30.2%) |
| 4.0x or more | 177 (32.3%) | 187 (15.8%) |
| Total | 548 (100.0%) | 1,184 (100.0%) |
Real Estate Taxes by Mortgage Status in Cheney
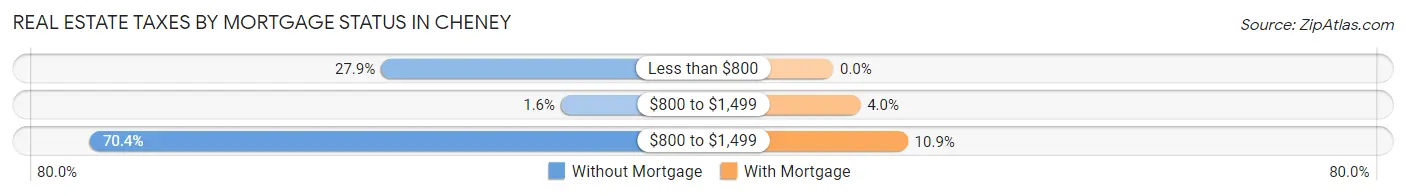
| Property Taxes | Without Mortgage | With Mortgage |
| Less than $800 | 153 (27.9%) | 0 (0.0%) |
| $800 to $1,499 | 9 (1.6%) | 47 (4.0%) |
| $800 to $1,499 | 386 (70.4%) | 129 (10.9%) |
| Total | 548 (100.0%) | 1,184 (100.0%) |
Health & Disability in Cheney
Health Insurance Coverage by Age in Cheney
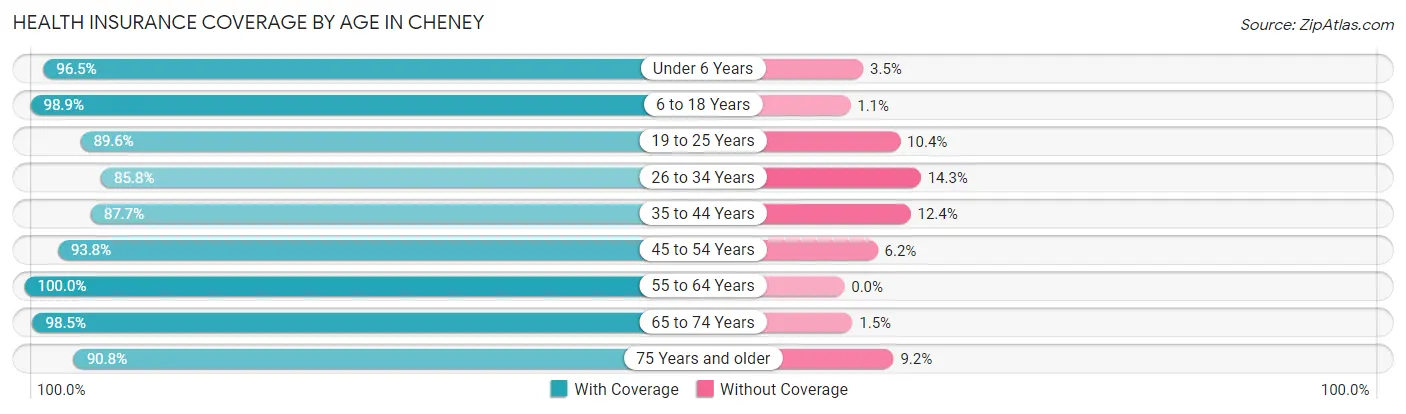
| Age Bracket | With Coverage | Without Coverage |
| Under 6 Years | 659 (96.5%) | 24 (3.5%) |
| 6 to 18 Years | 1,671 (98.9%) | 19 (1.1%) |
| 19 to 25 Years | 4,531 (89.6%) | 527 (10.4%) |
| 26 to 34 Years | 1,408 (85.8%) | 234 (14.2%) |
| 35 to 44 Years | 717 (87.6%) | 101 (12.3%) |
| 45 to 54 Years | 589 (93.8%) | 39 (6.2%) |
| 55 to 64 Years | 791 (100.0%) | 0 (0.0%) |
| 65 to 74 Years | 656 (98.5%) | 10 (1.5%) |
| 75 Years and older | 535 (90.8%) | 54 (9.2%) |
| Total | 11,557 (92.0%) | 1,008 (8.0%) |
Health Insurance Coverage by Citizenship Status in Cheney
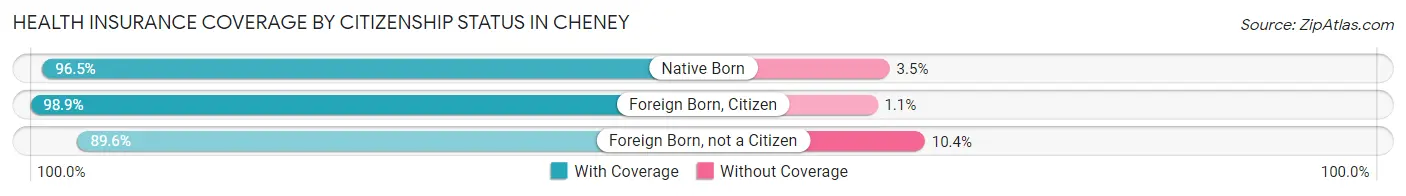
| Citizenship Status | With Coverage | Without Coverage |
| Native Born | 659 (96.5%) | 24 (3.5%) |
| Foreign Born, Citizen | 1,671 (98.9%) | 19 (1.1%) |
| Foreign Born, not a Citizen | 4,531 (89.6%) | 527 (10.4%) |
Health Insurance Coverage by Household Income in Cheney
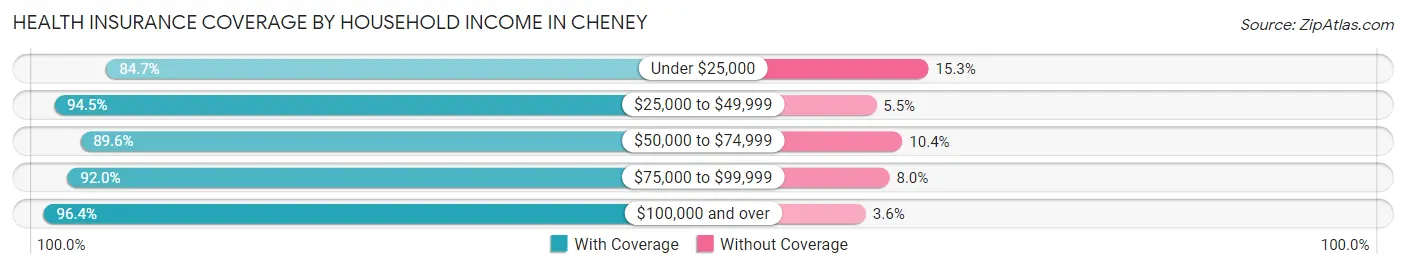
| Household Income | With Coverage | Without Coverage |
| Under $25,000 | 2,601 (84.7%) | 471 (15.3%) |
| $25,000 to $49,999 | 1,827 (94.5%) | 107 (5.5%) |
| $50,000 to $74,999 | 1,488 (89.6%) | 173 (10.4%) |
| $75,000 to $99,999 | 1,218 (92.0%) | 106 (8.0%) |
| $100,000 and over | 3,124 (96.4%) | 116 (3.6%) |
Public vs Private Health Insurance Coverage by Age in Cheney
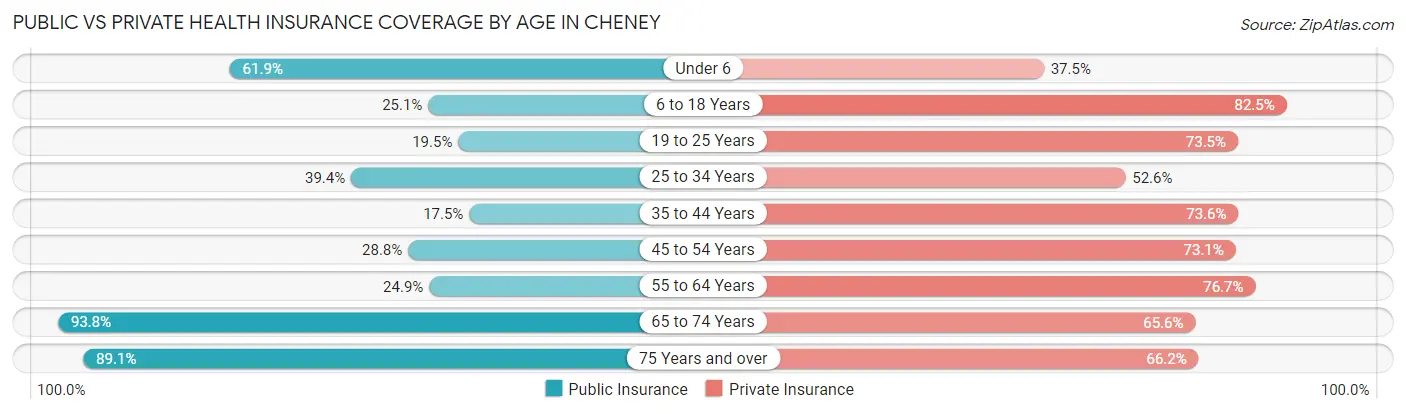
| Age Bracket | Public Insurance | Private Insurance |
| Under 6 | 423 (61.9%) | 256 (37.5%) |
| 6 to 18 Years | 424 (25.1%) | 1,395 (82.5%) |
| 19 to 25 Years | 987 (19.5%) | 3,718 (73.5%) |
| 25 to 34 Years | 647 (39.4%) | 864 (52.6%) |
| 35 to 44 Years | 143 (17.5%) | 602 (73.6%) |
| 45 to 54 Years | 181 (28.8%) | 459 (73.1%) |
| 55 to 64 Years | 197 (24.9%) | 607 (76.7%) |
| 65 to 74 Years | 625 (93.8%) | 437 (65.6%) |
| 75 Years and over | 525 (89.1%) | 390 (66.2%) |
| Total | 4,152 (33.0%) | 8,728 (69.5%) |
Disability Status by Sex by Age in Cheney
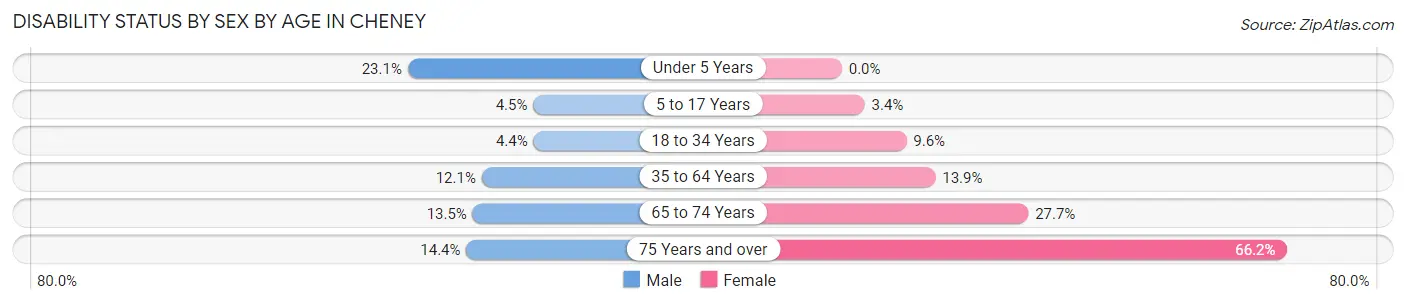
| Age Bracket | Male | Female |
| Under 5 Years | 58 (23.1%) | 0 (0.0%) |
| 5 to 17 Years | 21 (4.5%) | 23 (3.4%) |
| 18 to 34 Years | 145 (4.4%) | 381 (9.6%) |
| 35 to 64 Years | 121 (12.1%) | 172 (13.9%) |
| 65 to 74 Years | 42 (13.5%) | 98 (27.7%) |
| 75 Years and over | 18 (14.4%) | 307 (66.2%) |
Disability Class by Sex by Age in Cheney
Disability Class: Hearing Difficulty
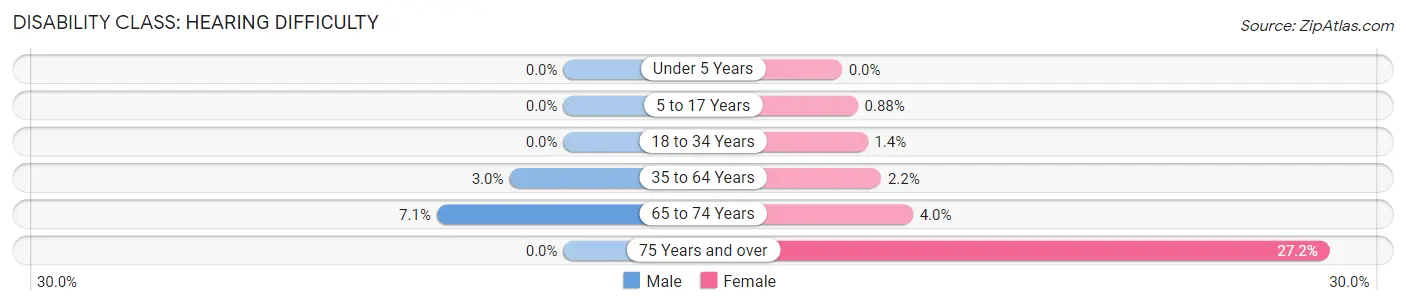
| Age Bracket | Male | Female |
| Under 5 Years | 0 (0.0%) | 0 (0.0%) |
| 5 to 17 Years | 0 (0.0%) | 6 (0.9%) |
| 18 to 34 Years | 0 (0.0%) | 57 (1.4%) |
| 35 to 64 Years | 30 (3.0%) | 27 (2.2%) |
| 65 to 74 Years | 22 (7.0%) | 14 (4.0%) |
| 75 Years and over | 0 (0.0%) | 126 (27.2%) |
Disability Class: Vision Difficulty
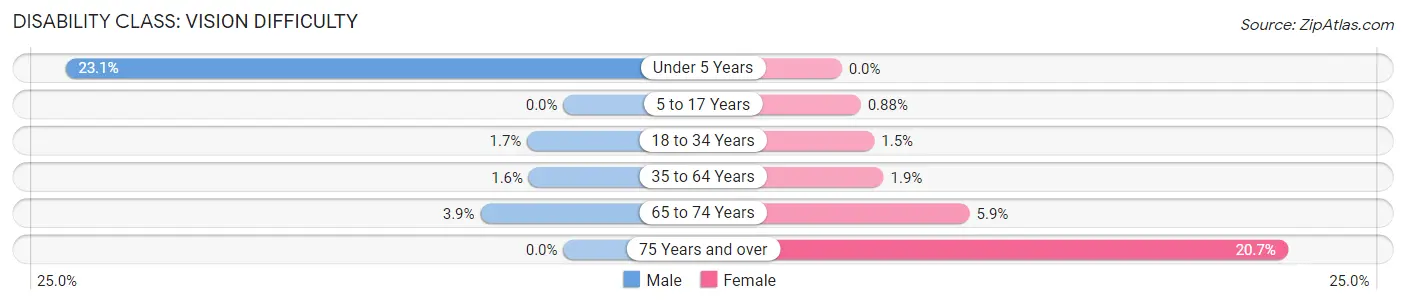
| Age Bracket | Male | Female |
| Under 5 Years | 58 (23.1%) | 0 (0.0%) |
| 5 to 17 Years | 0 (0.0%) | 6 (0.9%) |
| 18 to 34 Years | 55 (1.7%) | 60 (1.5%) |
| 35 to 64 Years | 16 (1.6%) | 24 (1.9%) |
| 65 to 74 Years | 12 (3.8%) | 21 (5.9%) |
| 75 Years and over | 0 (0.0%) | 96 (20.7%) |
Disability Class: Cognitive Difficulty
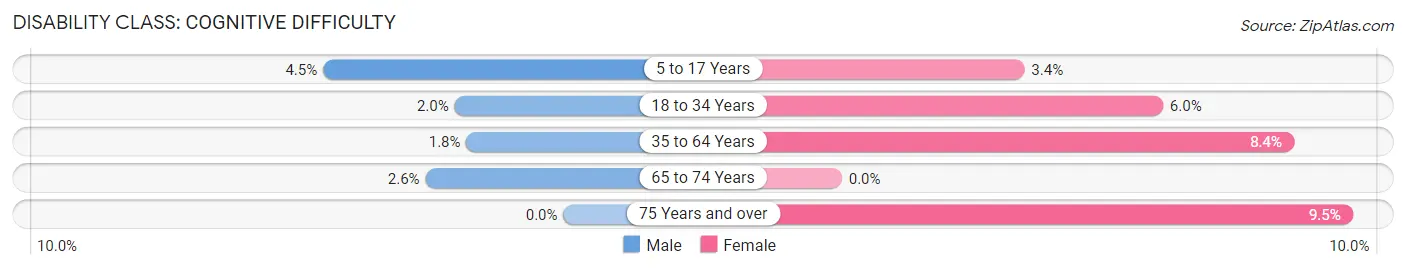
| Age Bracket | Male | Female |
| 5 to 17 Years | 21 (4.5%) | 23 (3.4%) |
| 18 to 34 Years | 66 (2.0%) | 237 (6.0%) |
| 35 to 64 Years | 18 (1.8%) | 104 (8.4%) |
| 65 to 74 Years | 8 (2.6%) | 0 (0.0%) |
| 75 Years and over | 0 (0.0%) | 44 (9.5%) |
Disability Class: Ambulatory Difficulty
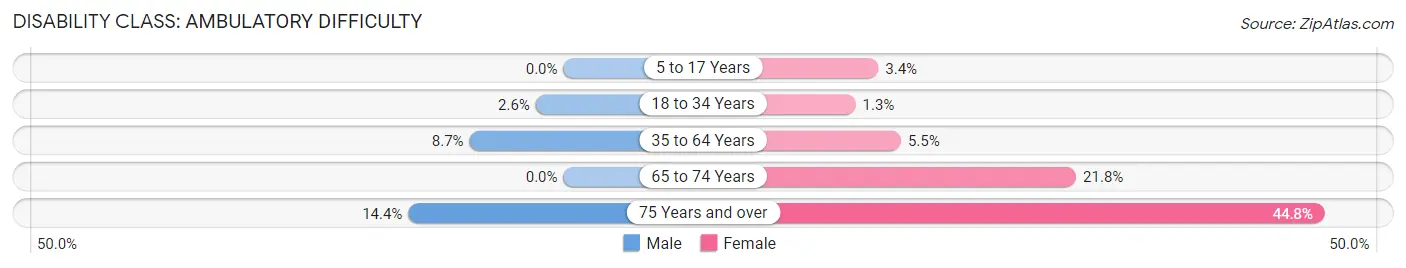
| Age Bracket | Male | Female |
| 5 to 17 Years | 0 (0.0%) | 23 (3.4%) |
| 18 to 34 Years | 84 (2.6%) | 51 (1.3%) |
| 35 to 64 Years | 87 (8.7%) | 68 (5.5%) |
| 65 to 74 Years | 0 (0.0%) | 77 (21.7%) |
| 75 Years and over | 18 (14.4%) | 208 (44.8%) |
Disability Class: Self-Care Difficulty
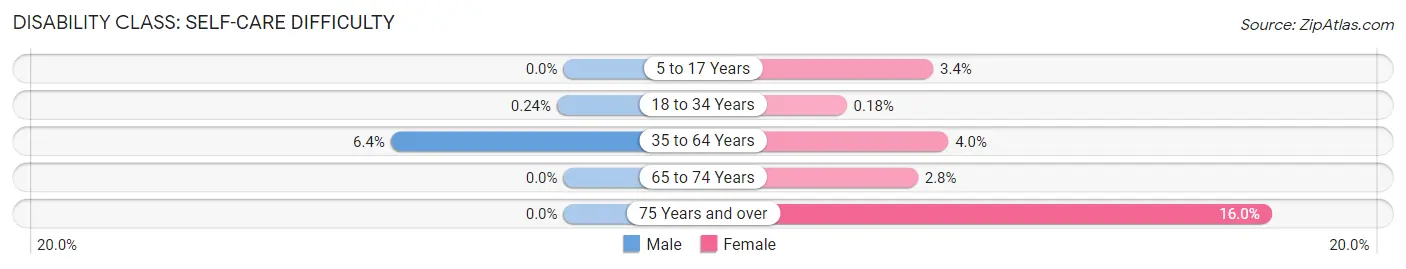
| Age Bracket | Male | Female |
| 5 to 17 Years | 0 (0.0%) | 23 (3.4%) |
| 18 to 34 Years | 8 (0.2%) | 7 (0.2%) |
| 35 to 64 Years | 64 (6.4%) | 49 (4.0%) |
| 65 to 74 Years | 0 (0.0%) | 10 (2.8%) |
| 75 Years and over | 0 (0.0%) | 74 (16.0%) |
Technology Access in Cheney
Computing Device Access in Cheney
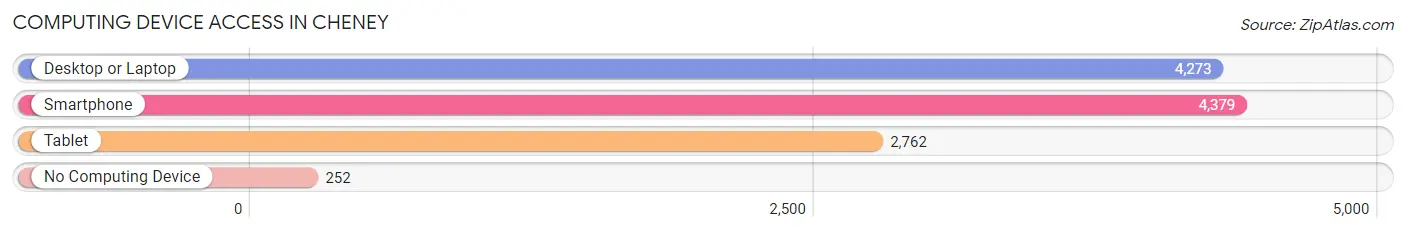
| Device Type | # Households | % Households |
| Desktop or Laptop | 4,273 | 87.3% |
| Smartphone | 4,379 | 89.5% |
| Tablet | 2,762 | 56.5% |
| No Computing Device | 252 | 5.1% |
| Total | 4,893 | 100.0% |
Internet Access in Cheney
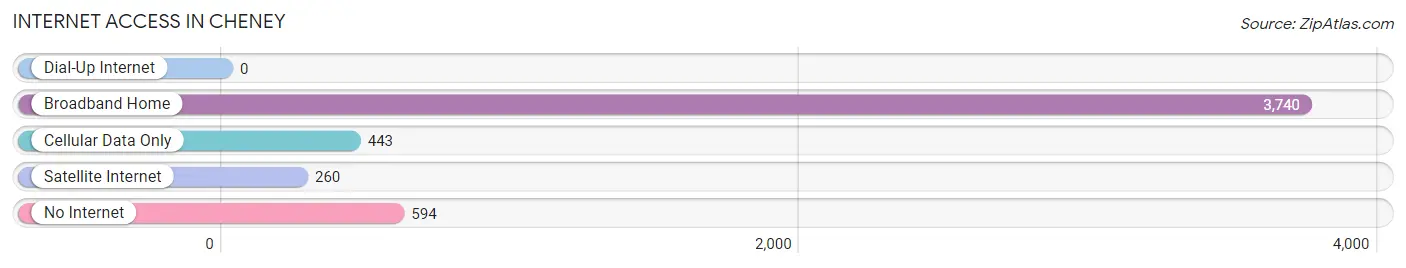
| Internet Type | # Households | % Households |
| Dial-Up Internet | 0 | 0.0% |
| Broadband Home | 3,740 | 76.4% |
| Cellular Data Only | 443 | 9.0% |
| Satellite Internet | 260 | 5.3% |
| No Internet | 594 | 12.1% |
| Total | 4,893 | 100.0% |
Cheney Summary
Cheney, Washington is a small city located in Spokane County, Washington. It is situated about 20 miles southwest of Spokane, the county seat. The city is home to Eastern Washington University, a public university with an enrollment of over 11,000 students. Cheney is a small city with a population of just over 11,000 people, according to the 2010 census.
History
Cheney was founded in 1883 by Benjamin P. Cheney, a former Civil War veteran and businessman from Maine. He purchased the land from the Northern Pacific Railroad and named the town after himself. The town was incorporated in 1891 and was the first city in Spokane County.
The city was originally a farming community, but in the early 1900s, the economy shifted to focus on the timber industry. The city was also home to a number of small businesses, including a flour mill, a creamery, and a brickyard.
In the 1920s, Cheney began to experience a population boom due to the construction of the Great Northern Railway. This allowed for the transportation of goods and people to and from the city. The population continued to grow throughout the 20th century, reaching its peak in the 1970s.
Geography
Cheney is located in the Spokane Valley, a region of the Inland Northwest. The city is situated on the banks of the Spokane River, which flows through the city. The city is surrounded by rolling hills and is located at an elevation of 1,890 feet.
The climate in Cheney is semi-arid, with hot summers and cold winters. The average temperature in the summer is around 80 degrees Fahrenheit, while the average temperature in the winter is around 30 degrees Fahrenheit.
Economy
Cheney’s economy is largely based on education, with Eastern Washington University being the largest employer in the city. Other major employers include the Cheney School District, the City of Cheney, and the Cheney Medical Center.
The city also has a number of small businesses, including restaurants, retail stores, and service providers. The city is also home to a number of manufacturing companies, including a paper mill and a wood products plant.
Demographics
According to the 2010 census, the population of Cheney was 11,060. The racial makeup of the city was 87.3% White, 4.2% Hispanic or Latino, 2.2% Asian, 1.7% African American, and 0.7% Native American.
The median household income in Cheney was $41,945, and the median family income was $50,945. The per capita income was $20,945. The poverty rate was 13.2%.
Cheney is a small city with a rich history and a diverse population. It is home to Eastern Washington University, which provides a number of educational and economic opportunities for the city. The city also has a number of small businesses and manufacturing companies that provide employment opportunities for its residents.
Common Questions
What is Per Capita Income in Cheney?
Per Capita income in Cheney is $24,693.
What is the Median Family Income in Cheney?
Median Family Income in Cheney is $78,435.
What is the Median Household income in Cheney?
Median Household Income in Cheney is $45,419.
What is Income or Wage Gap in Cheney?
Income or Wage Gap in Cheney is 12.8%.
Women in Cheney earn 87.2 cents for every dollar earned by a man.
What is Family Income Deficit in Cheney?
Family Income Deficit in Cheney is $15,967.
Families that are below poverty line in Cheney earn $15,967 less on average than the poverty threshold level.
What is Inequality or Gini Index in Cheney?
Inequality or Gini Index in Cheney is 0.51.
What is the Total Population of Cheney?
Total Population of Cheney is 12,848.
What is the Total Male Population of Cheney?
Total Male Population of Cheney is 5,644.
What is the Total Female Population of Cheney?
Total Female Population of Cheney is 7,204.
What is the Ratio of Males per 100 Females in Cheney?
There are 78.35 Males per 100 Females in Cheney.
What is the Ratio of Females per 100 Males in Cheney?
There are 127.64 Females per 100 Males in Cheney.
What is the Median Population Age in Cheney?
Median Population Age in Cheney is 23.8 Years.
What is the Average Family Size in Cheney
Average Family Size in Cheney is 2.8 People.
What is the Average Household Size in Cheney
Average Household Size in Cheney is 2.3 People.
How Large is the Labor Force in Cheney?
There are 7,569 People in the Labor Forcein in Cheney.
What is the Percentage of People in the Labor Force in Cheney?
67.8% of People are in the Labor Force in Cheney.
What is the Unemployment Rate in Cheney?
Unemployment Rate in Cheney is 13.0%.