Cities with the Highest Percentage of Households With Two or more Vehicles in Washington
RELATED REPORTS & OPTIONS
Households with 2 or more Cars
Washington
Compare Cities
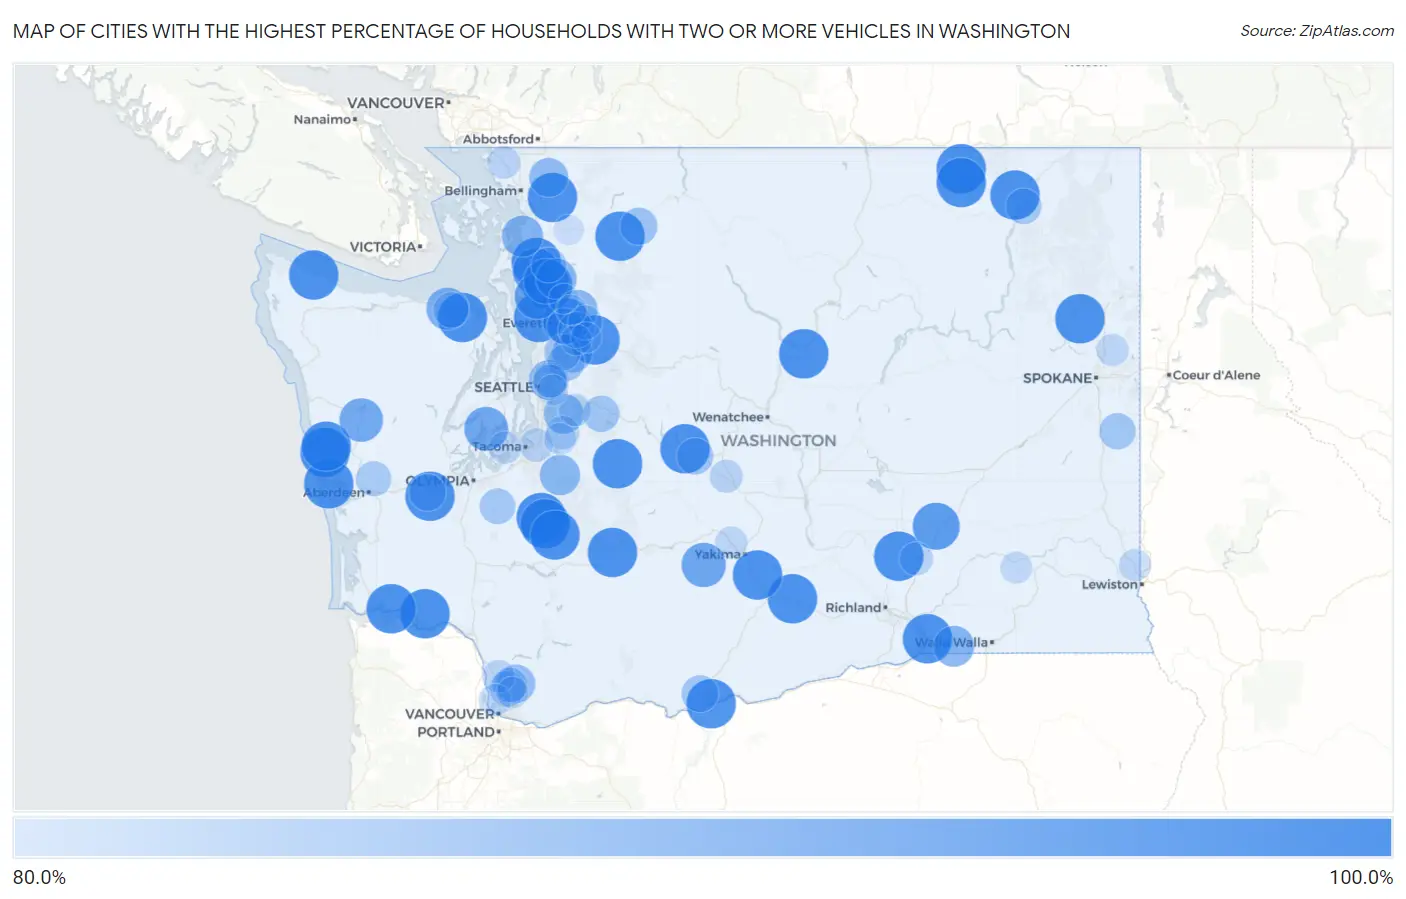
Map of Cities with the Highest Percentage of Households With Two or more Vehicles in Washington
0.0%
100.0%
Cities with the Highest Percentage of Households With Two or more Vehicles in Washington
| City | Housholds With 2+ Cars | vs State | vs National | |
| 1. | Basin City | 100.0% | 63.6%(+36.4)#1 | 59.1%(+40.9)#15 |
| 2. | Bow | 100.0% | 63.6%(+36.4)#2 | 59.1%(+40.9)#105 |
| 3. | Schwana | 100.0% | 63.6%(+36.4)#3 | 59.1%(+40.9)#108 |
| 4. | Outlook | 100.0% | 63.6%(+36.4)#4 | 59.1%(+40.9)#113 |
| 5. | North Sultan | 100.0% | 63.6%(+36.4)#5 | 59.1%(+40.9)#116 |
| 6. | Beverly | 100.0% | 63.6%(+36.4)#6 | 59.1%(+40.9)#137 |
| 7. | Ronald | 100.0% | 63.6%(+36.4)#7 | 59.1%(+40.9)#178 |
| 8. | Wheeler | 100.0% | 63.6%(+36.4)#8 | 59.1%(+40.9)#193 |
| 9. | La Grande | 100.0% | 63.6%(+36.4)#9 | 59.1%(+40.9)#214 |
| 10. | Blyn | 100.0% | 63.6%(+36.4)#10 | 59.1%(+40.9)#296 |
| 11. | Porter | 100.0% | 63.6%(+36.4)#11 | 59.1%(+40.9)#363 |
| 12. | Clayton | 100.0% | 63.6%(+36.4)#12 | 59.1%(+40.9)#419 |
| 13. | Donald | 100.0% | 63.6%(+36.4)#13 | 59.1%(+40.9)#427 |
| 14. | Alder | 100.0% | 63.6%(+36.4)#14 | 59.1%(+40.9)#437 |
| 15. | Packwood | 100.0% | 63.6%(+36.4)#15 | 59.1%(+40.9)#457 |
| 16. | Acme | 100.0% | 63.6%(+36.4)#16 | 59.1%(+40.9)#465 |
| 17. | Curlew | 100.0% | 63.6%(+36.4)#17 | 59.1%(+40.9)#488 |
| 18. | Upper Elochoman | 100.0% | 63.6%(+36.4)#18 | 59.1%(+40.9)#491 |
| 19. | Chelan Falls | 100.0% | 63.6%(+36.4)#19 | 59.1%(+40.9)#498 |
| 20. | Greenwater | 100.0% | 63.6%(+36.4)#20 | 59.1%(+40.9)#532 |
| 21. | Wallula | 100.0% | 63.6%(+36.4)#21 | 59.1%(+40.9)#573 |
| 22. | Pacific Beach | 100.0% | 63.6%(+36.4)#22 | 59.1%(+40.9)#634 |
| 23. | Mineral | 100.0% | 63.6%(+36.4)#23 | 59.1%(+40.9)#675 |
| 24. | Rockport | 100.0% | 63.6%(+36.4)#24 | 59.1%(+40.9)#727 |
| 25. | Sekiu | 100.0% | 63.6%(+36.4)#25 | 59.1%(+40.9)#738 |
| 26. | Altoona | 100.0% | 63.6%(+36.4)#26 | 59.1%(+40.9)#757 |
| 27. | Oyehut | 100.0% | 63.6%(+36.4)#27 | 59.1%(+40.9)#768 |
| 28. | Qui Nai Elt Village | 100.0% | 63.6%(+36.4)#28 | 59.1%(+40.9)#785 |
| 29. | Conway | 100.0% | 63.6%(+36.4)#29 | 59.1%(+40.9)#815 |
| 30. | Maryhill | 100.0% | 63.6%(+36.4)#30 | 59.1%(+40.9)#881 |
| 31. | Boyds | 100.0% | 63.6%(+36.4)#31 | 59.1%(+40.9)#911 |
| 32. | Malo | 100.0% | 63.6%(+36.4)#32 | 59.1%(+40.9)#965 |
| 33. | Hat Island | 100.0% | 63.6%(+36.4)#33 | 59.1%(+40.9)#1,044 |
| 34. | Silvana | 100.0% | 63.6%(+36.4)#34 | 59.1%(+40.9)#1,164 |
| 35. | Anatone | 100.0% | 63.6%(+36.4)#35 | 59.1%(+40.9)#1,192 |
| 36. | Hatton | 98.2% | 63.6%(+34.6)#36 | 59.1%(+39.1)#1,272 |
| 37. | Cavalero | 97.9% | 63.6%(+34.3)#37 | 59.1%(+38.8)#1,276 |
| 38. | Lake Ketchum | 97.9% | 63.6%(+34.3)#38 | 59.1%(+38.8)#1,277 |
| 39. | Kayak Point | 97.1% | 63.6%(+33.5)#39 | 59.1%(+38.0)#1,304 |
| 40. | Sunday Lake | 97.0% | 63.6%(+33.4)#40 | 59.1%(+37.9)#1,311 |
| 41. | Tampico | 96.2% | 63.6%(+32.6)#41 | 59.1%(+37.1)#1,346 |
| 42. | Vaughn | 95.9% | 63.6%(+32.3)#42 | 59.1%(+36.8)#1,358 |
| 43. | Neilton | 95.6% | 63.6%(+32.0)#43 | 59.1%(+36.5)#1,386 |
| 44. | River Road | 94.6% | 63.6%(+31.0)#44 | 59.1%(+35.5)#1,470 |
| 45. | Bay View | 93.9% | 63.6%(+30.3)#45 | 59.1%(+34.8)#1,522 |
| 46. | Touchet | 93.6% | 63.6%(+30.0)#46 | 59.1%(+34.5)#1,557 |
| 47. | Bryant | 93.4% | 63.6%(+29.8)#47 | 59.1%(+34.3)#1,583 |
| 48. | Crocker | 93.2% | 63.6%(+29.6)#48 | 59.1%(+34.1)#1,610 |
| 49. | Lake Bosworth | 93.2% | 63.6%(+29.6)#49 | 59.1%(+34.1)#1,611 |
| 50. | Maple Heights Lake Desire | 92.9% | 63.6%(+29.3)#50 | 59.1%(+33.8)#1,648 |
| 51. | High Bridge | 92.8% | 63.6%(+29.2)#51 | 59.1%(+33.7)#1,663 |
| 52. | Hunts Point | 92.7% | 63.6%(+29.1)#52 | 59.1%(+33.6)#1,685 |
| 53. | Deming | 92.3% | 63.6%(+28.7)#53 | 59.1%(+33.2)#1,733 |
| 54. | Lewisville | 91.7% | 63.6%(+28.1)#54 | 59.1%(+32.6)#1,811 |
| 55. | Cougar | 91.7% | 63.6%(+28.1)#55 | 59.1%(+32.6)#1,823 |
| 56. | Marblemount | 91.0% | 63.6%(+27.4)#56 | 59.1%(+31.9)#1,916 |
| 57. | Cottage Lake | 90.7% | 63.6%(+27.1)#57 | 59.1%(+31.6)#1,958 |
| 58. | Malone | 90.7% | 63.6%(+27.1)#58 | 59.1%(+31.6)#1,969 |
| 59. | Centerville | 90.7% | 63.6%(+27.1)#59 | 59.1%(+31.6)#1,976 |
| 60. | South Cle Elum | 90.5% | 63.6%(+26.9)#60 | 59.1%(+31.4)#1,994 |
| 61. | Maltby | 90.3% | 63.6%(+26.7)#61 | 59.1%(+31.2)#2,025 |
| 62. | Wilderness Rim | 90.3% | 63.6%(+26.7)#62 | 59.1%(+31.2)#2,027 |
| 63. | Waverly | 90.3% | 63.6%(+26.7)#63 | 59.1%(+31.2)#2,039 |
| 64. | Bunk Foss | 90.2% | 63.6%(+26.6)#64 | 59.1%(+31.1)#2,048 |
| 65. | Riverpoint | 90.2% | 63.6%(+26.6)#65 | 59.1%(+31.1)#2,053 |
| 66. | Suncrest | 90.1% | 63.6%(+26.5)#66 | 59.1%(+31.0)#2,066 |
| 67. | Three Lakes | 90.1% | 63.6%(+26.5)#67 | 59.1%(+31.0)#2,068 |
| 68. | Rainier | 89.9% | 63.6%(+26.3)#68 | 59.1%(+30.8)#2,111 |
| 69. | Bell Hill | 89.8% | 63.6%(+26.2)#69 | 59.1%(+30.7)#2,128 |
| 70. | Marcus | 89.8% | 63.6%(+26.2)#70 | 59.1%(+30.7)#2,139 |
| 71. | Dollars Corner | 89.7% | 63.6%(+26.1)#71 | 59.1%(+30.6)#2,144 |
| 72. | Lake Mcmurray | 89.4% | 63.6%(+25.8)#72 | 59.1%(+30.3)#2,199 |
| 73. | Aberdeen Gardens | 89.4% | 63.6%(+25.8)#73 | 59.1%(+30.3)#2,200 |
| 74. | Yarrow Point | 89.2% | 63.6%(+25.6)#74 | 59.1%(+30.1)#2,237 |
| 75. | Cherry Grove | 89.2% | 63.6%(+25.6)#75 | 59.1%(+30.1)#2,243 |
| 76. | Lake Roesiger | 88.9% | 63.6%(+25.3)#76 | 59.1%(+29.8)#2,292 |
| 77. | Crescent Bar | 88.5% | 63.6%(+24.9)#77 | 59.1%(+29.4)#2,382 |
| 78. | Lake Morton Berrydale | 88.2% | 63.6%(+24.6)#78 | 59.1%(+29.1)#2,432 |
| 79. | Clyde Hill | 88.2% | 63.6%(+24.6)#79 | 59.1%(+29.1)#2,437 |
| 80. | Fife Heights | 88.1% | 63.6%(+24.5)#80 | 59.1%(+29.0)#2,463 |
| 81. | Mesa | 88.1% | 63.6%(+24.5)#81 | 59.1%(+29.0)#2,467 |
| 82. | Thorp | 88.0% | 63.6%(+24.4)#82 | 59.1%(+28.9)#2,505 |
| 83. | Custer | 87.8% | 63.6%(+24.2)#83 | 59.1%(+28.7)#2,551 |
| 84. | La Center | 87.7% | 63.6%(+24.1)#84 | 59.1%(+28.6)#2,559 |
| 85. | Felida | 87.5% | 63.6%(+23.9)#85 | 59.1%(+28.4)#2,596 |
| 86. | Mirrormont | 87.5% | 63.6%(+23.9)#86 | 59.1%(+28.4)#2,599 |
| 87. | Fox Island | 87.4% | 63.6%(+23.8)#87 | 59.1%(+28.3)#2,639 |
| 88. | Uniontown | 87.3% | 63.6%(+23.7)#88 | 59.1%(+28.2)#2,671 |
| 89. | Green Bluff | 87.3% | 63.6%(+23.7)#89 | 59.1%(+28.2)#2,675 |
| 90. | Eschbach | 87.3% | 63.6%(+23.7)#90 | 59.1%(+28.2)#2,676 |
| 91. | Lake Holm | 87.1% | 63.6%(+23.5)#91 | 59.1%(+28.0)#2,708 |
| 92. | Starbuck | 87.1% | 63.6%(+23.5)#92 | 59.1%(+28.0)#2,729 |
| 93. | Meadow Glade | 87.0% | 63.6%(+23.4)#93 | 59.1%(+27.9)#2,734 |
| 94. | Lexington | 86.5% | 63.6%(+22.9)#94 | 59.1%(+27.4)#2,870 |
| 95. | Monroe North | 86.4% | 63.6%(+22.8)#95 | 59.1%(+27.3)#2,903 |
| 96. | Beaux Arts Village | 86.4% | 63.6%(+22.8)#96 | 59.1%(+27.3)#2,915 |
| 97. | Lochsloy | 86.3% | 63.6%(+22.7)#97 | 59.1%(+27.2)#2,924 |
| 98. | Woods Creek | 86.1% | 63.6%(+22.5)#98 | 59.1%(+27.0)#2,973 |
| 99. | Lyman | 86.1% | 63.6%(+22.5)#99 | 59.1%(+27.0)#2,997 |
| 100. | Sisco Heights | 85.9% | 63.6%(+22.3)#100 | 59.1%(+26.8)#3,042 |
Common Questions
What are the Top 10 Cities with the Highest Percentage of Households With Two or more Vehicles in Washington?
Top 10 Cities with the Highest Percentage of Households With Two or more Vehicles in Washington are:
#1
100.0%
#2
100.0%
#3
100.0%
#4
100.0%
#5
100.0%
#6
100.0%
#7
100.0%
#8
100.0%
#9
100.0%
#10
100.0%
What city has the Highest Percentage of Households With Two or more Vehicles in Washington?
Basin City has the Highest Percentage of Households With Two or more Vehicles in Washington with 100.0%.
What is the Percentage of Households With Two or more Vehicles in the State of Washington?
Percentage of Households With Two or more Vehicles in Washington is 63.6%.
What is the Percentage of Households With Two or more Vehicles in the United States?
Percentage of Households With Two or more Vehicles in the United States is 59.1%.