Eschbach, WA Map & Demographics
Eschbach Map
Eschbach Overview
$29,163
PER CAPITA INCOME
$110,250
AVG FAMILY INCOME
$54,063
AVG HOUSEHOLD INCOME
0.5%
WAGE / INCOME GAP [ % ]
99.5¢/ $1
WAGE / INCOME GAP [ $ ]
0.29
INEQUALITY / GINI INDEX
209
TOTAL POPULATION
96
MALE POPULATION
113
FEMALE POPULATION
84.96
MALES / 100 FEMALES
117.71
FEMALES / 100 MALES
35.5
MEDIAN AGE
3.0
AVG FAMILY SIZE
2.4
AVG HOUSEHOLD SIZE
149
LABOR FORCE [ PEOPLE ]
78.8%
PERCENT IN LABOR FORCE
12.8%
UNEMPLOYMENT RATE
Income in Eschbach
Income Overview in Eschbach
Per Capita Income in Eschbach is $29,163, while median incomes of families and households are $110,250 and $54,063 respectively.
| Characteristic | Number | Measure |
| Per Capita Income | 209 | $29,163 |
| Median Family Income | 62 | $110,250 |
| Mean Family Income | 62 | $84,626 |
| Median Household Income | 87 | $54,063 |
| Mean Household Income | 87 | $69,974 |
| Income Deficit | 62 | $0 |
| Wage / Income Gap (%) | 209 | 0.50% |
| Wage / Income Gap ($) | 209 | 99.50¢ per $1 |
| Gini / Inequality Index | 209 | 0.29 |
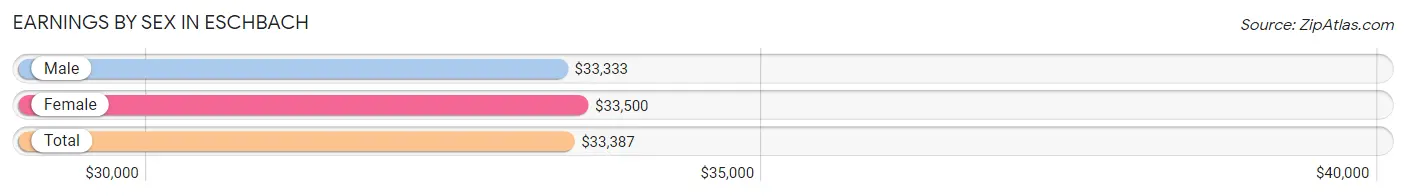
Earnings by Sex in Eschbach
Average Earnings in Eschbach are $33,387, $33,333 for men and $33,500 for women, a difference of 0.5%.
| Sex | Number | Average Earnings |
| Male | 76 (58.5%) | $33,333 |
| Female | 54 (41.5%) | $33,500 |
| Total | 130 (100.0%) | $33,387 |
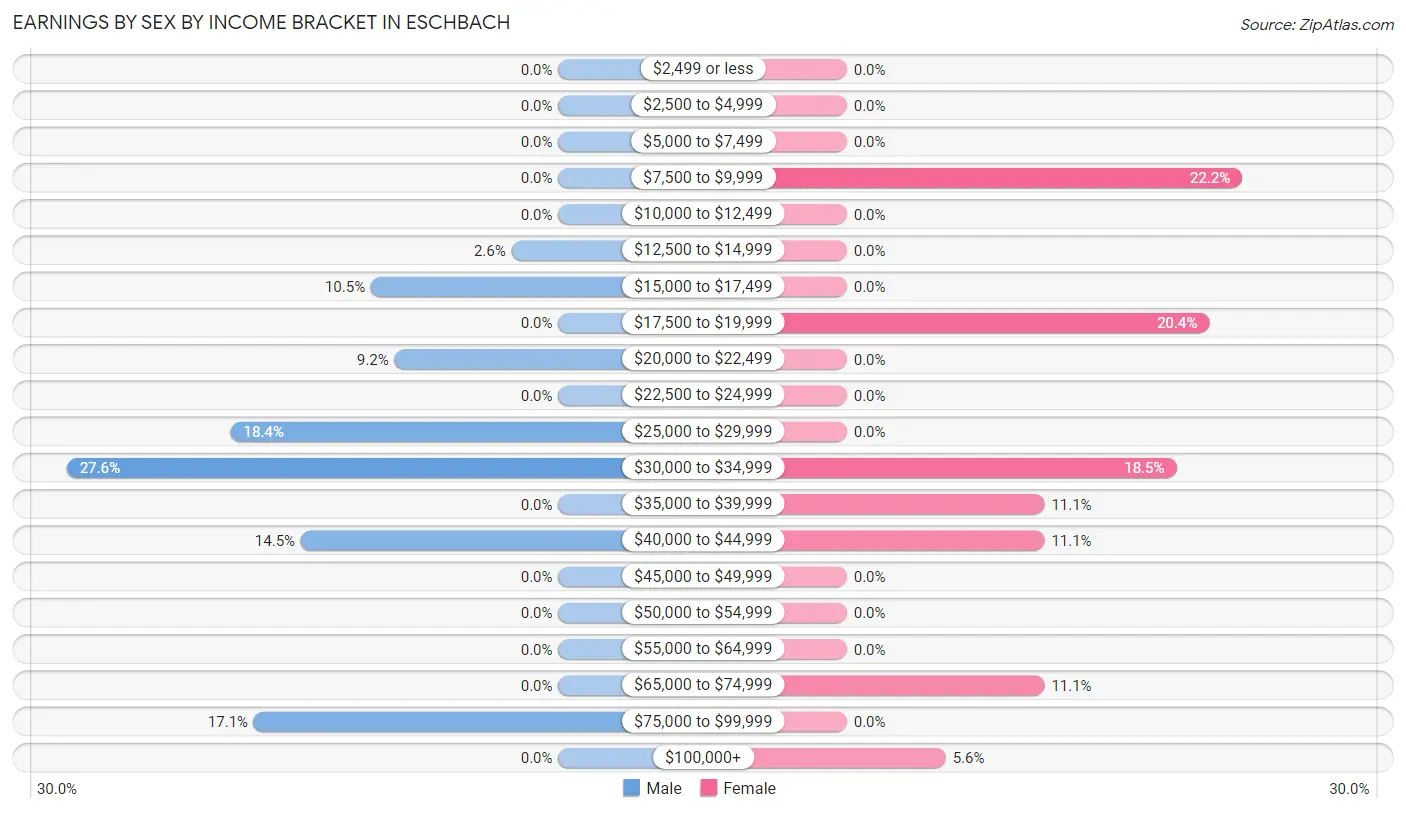
Earnings by Sex by Income Bracket in Eschbach
The most common earnings brackets in Eschbach are $30,000 to $34,999 for men (21 | 27.6%) and $7,500 to $9,999 for women (12 | 22.2%).
| Income | Male | Female |
| $2,499 or less | 0 (0.0%) | 0 (0.0%) |
| $2,500 to $4,999 | 0 (0.0%) | 0 (0.0%) |
| $5,000 to $7,499 | 0 (0.0%) | 0 (0.0%) |
| $7,500 to $9,999 | 0 (0.0%) | 12 (22.2%) |
| $10,000 to $12,499 | 0 (0.0%) | 0 (0.0%) |
| $12,500 to $14,999 | 2 (2.6%) | 0 (0.0%) |
| $15,000 to $17,499 | 8 (10.5%) | 0 (0.0%) |
| $17,500 to $19,999 | 0 (0.0%) | 11 (20.4%) |
| $20,000 to $22,499 | 7 (9.2%) | 0 (0.0%) |
| $22,500 to $24,999 | 0 (0.0%) | 0 (0.0%) |
| $25,000 to $29,999 | 14 (18.4%) | 0 (0.0%) |
| $30,000 to $34,999 | 21 (27.6%) | 10 (18.5%) |
| $35,000 to $39,999 | 0 (0.0%) | 6 (11.1%) |
| $40,000 to $44,999 | 11 (14.5%) | 6 (11.1%) |
| $45,000 to $49,999 | 0 (0.0%) | 0 (0.0%) |
| $50,000 to $54,999 | 0 (0.0%) | 0 (0.0%) |
| $55,000 to $64,999 | 0 (0.0%) | 0 (0.0%) |
| $65,000 to $74,999 | 0 (0.0%) | 6 (11.1%) |
| $75,000 to $99,999 | 13 (17.1%) | 0 (0.0%) |
| $100,000+ | 0 (0.0%) | 3 (5.6%) |
| Total | 76 (100.0%) | 54 (100.0%) |
Earnings by Sex by Educational Attainment in Eschbach
| Educational Attainment | Male Income | Female Income |
| Less than High School | - | - |
| High School Diploma | - | - |
| College or Associate's Degree | - | - |
| Bachelor's Degree | - | - |
| Graduate Degree | - | - |
| Total | $32,679 | $0 |
Family Income in Eschbach
Family Income Brackets in Eschbach
According to the Eschbach family income data, there are 32 families falling into the $100,000 to $149,999 income range, which is the most common income bracket and makes up 51.6% of all families.
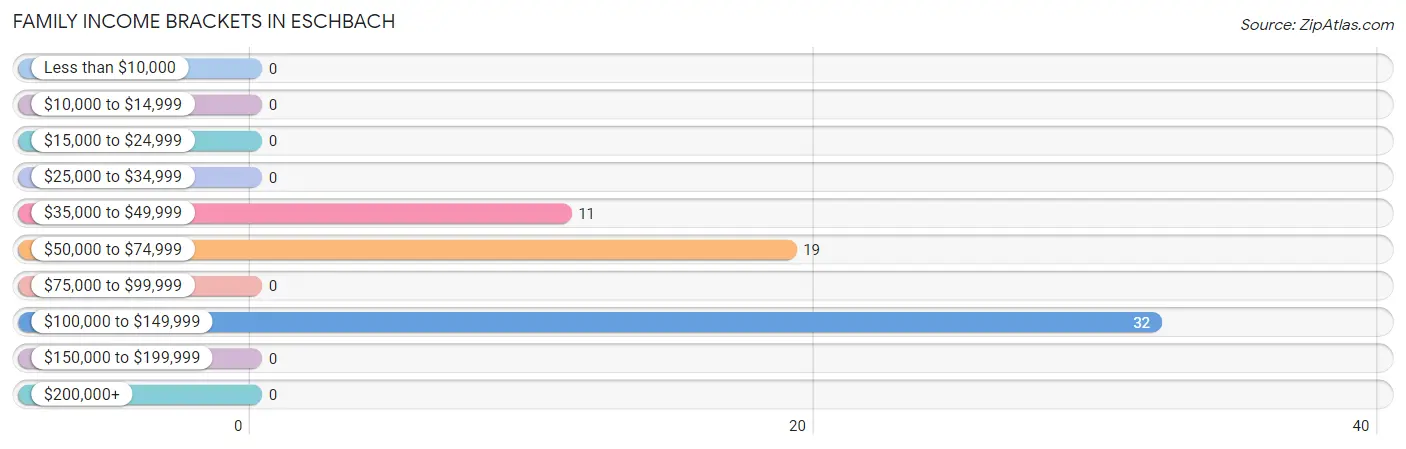
| Income Bracket | # Families | % Families |
| Less than $10,000 | 0 | 0.0% |
| $10,000 to $14,999 | 0 | 0.0% |
| $15,000 to $24,999 | 0 | 0.0% |
| $25,000 to $34,999 | 0 | 0.0% |
| $35,000 to $49,999 | 11 | 17.7% |
| $50,000 to $74,999 | 19 | 30.6% |
| $75,000 to $99,999 | 0 | 0.0% |
| $100,000 to $149,999 | 32 | 51.6% |
| $150,000 to $199,999 | 0 | 0.0% |
| $200,000+ | 0 | 0.0% |
Family Income by Famaliy Size in Eschbach
2-person families (31 | 50.0%) account for the highest median family income in Eschbach with $115,461 per family, while 2-person families (31 | 50.0%) have the highest median income of $57,730 per family member.
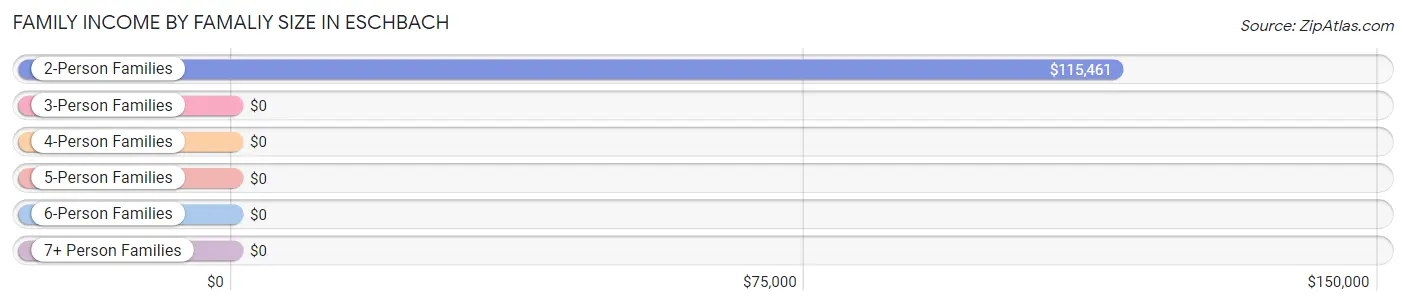
| Income Bracket | # Families | Median Income |
| 2-Person Families | 31 (50.0%) | $115,461 |
| 3-Person Families | 14 (22.6%) | $0 |
| 4-Person Families | 17 (27.4%) | $0 |
| 5-Person Families | 0 (0.0%) | $0 |
| 6-Person Families | 0 (0.0%) | $0 |
| 7+ Person Families | 0 (0.0%) | $0 |
| Total | 62 (100.0%) | $110,250 |
Family Income by Number of Earners in Eschbach
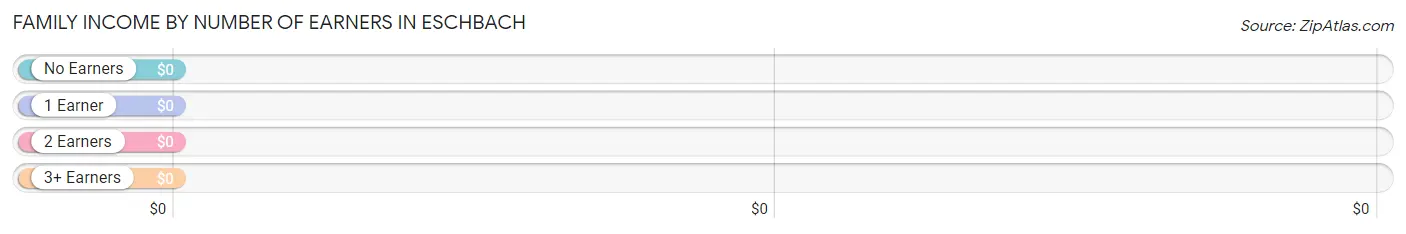
| Number of Earners | # Families | Median Income |
| No Earners | 0 (0.0%) | $0 |
| 1 Earner | 25 (40.3%) | $0 |
| 2 Earners | 20 (32.3%) | $0 |
| 3+ Earners | 17 (27.4%) | $0 |
| Total | 62 (100.0%) | $110,250 |
Household Income in Eschbach
Household Income Brackets in Eschbach
With 32 households falling in the category, the $100,000 to $149,999 income range is the most frequent in Eschbach, accounting for 36.8% of all households.
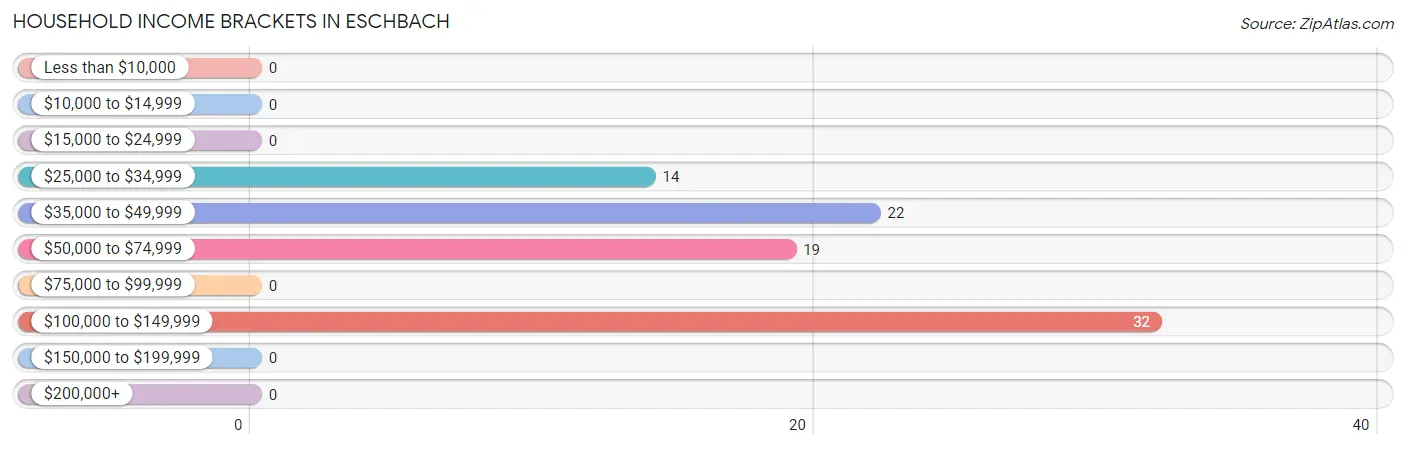
| Income Bracket | # Households | % Households |
| Less than $10,000 | 0 | 0.0% |
| $10,000 to $14,999 | 0 | 0.0% |
| $15,000 to $24,999 | 0 | 0.0% |
| $25,000 to $34,999 | 14 | 16.1% |
| $35,000 to $49,999 | 22 | 25.3% |
| $50,000 to $74,999 | 19 | 21.8% |
| $75,000 to $99,999 | 0 | 0.0% |
| $100,000 to $149,999 | 32 | 36.8% |
| $150,000 to $199,999 | 0 | 0.0% |
| $200,000+ | 0 | 0.0% |
Household Income by Householder Age in Eschbach
| Income Bracket | # Households | Median Income |
| 15 to 24 Years | 10 (11.5%) | $0 |
| 25 to 44 Years | 14 (16.1%) | $0 |
| 45 to 64 Years | 27 (31.0%) | $0 |
| 65+ Years | 36 (41.4%) | $0 |
| Total | 87 (100.0%) | $54,063 |
Poverty in Eschbach
Income Below Poverty by Sex and Age in Eschbach
| Age Bracket | Male | Female |
| Under 5 Years | 0 (0.0%) | 0 (0.0%) |
| 5 Years | 0 (0.0%) | 0 (0.0%) |
| 6 to 11 Years | 0 (0.0%) | 0 (0.0%) |
| 12 to 14 Years | 0 (0.0%) | 0 (0.0%) |
| 15 Years | 0 (0.0%) | 0 (0.0%) |
| 16 and 17 Years | 0 (0.0%) | 0 (0.0%) |
| 18 to 24 Years | 0 (0.0%) | 0 (0.0%) |
| 25 to 34 Years | 0 (0.0%) | 0 (0.0%) |
| 35 to 44 Years | 0 (0.0%) | 0 (0.0%) |
| 45 to 54 Years | 0 (0.0%) | 0 (0.0%) |
| 55 to 64 Years | 0 (0.0%) | 0 (0.0%) |
| 65 to 74 Years | 0 (0.0%) | 0 (0.0%) |
| 75 Years and over | 0 (0.0%) | 0 (0.0%) |
| Total | 0 (0.0%) | 0 (0.0%) |
Income Above Poverty by Sex and Age in Eschbach
According to the poverty statistics in Eschbach, males aged under 5 years and females aged 18 to 24 years are the age groups that are most secure financially, with 100.0% of males and 100.0% of females in these age groups living above the poverty line.
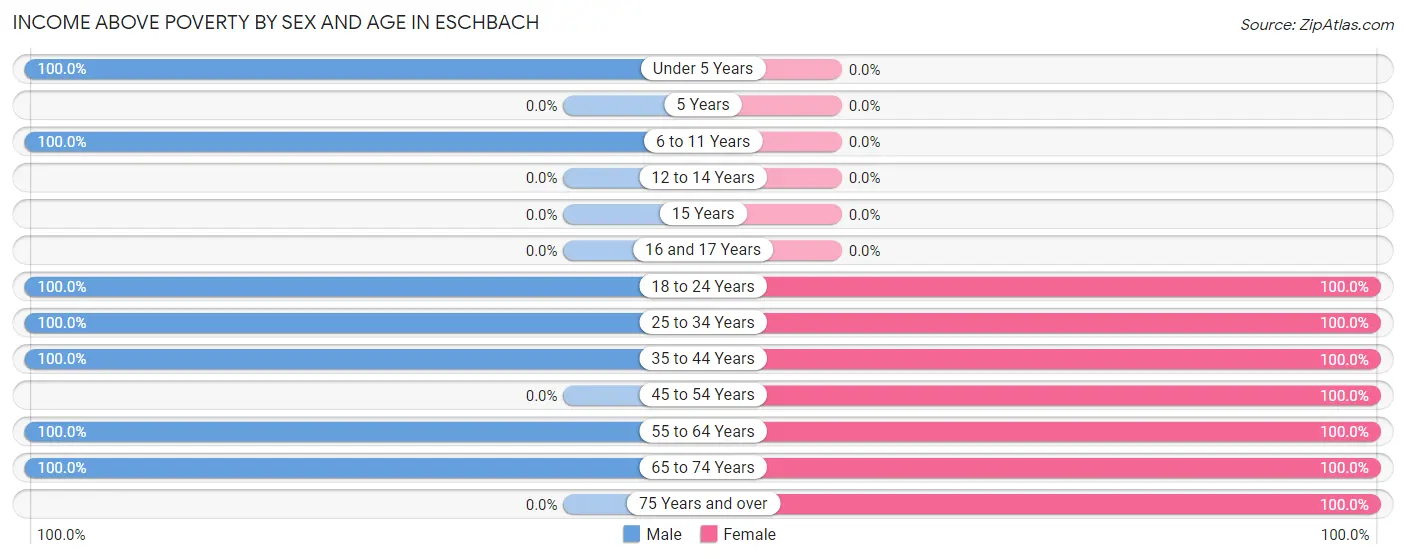
| Age Bracket | Male | Female |
| Under 5 Years | 11 (100.0%) | 0 (0.0%) |
| 5 Years | 0 (0.0%) | 0 (0.0%) |
| 6 to 11 Years | 9 (100.0%) | 0 (0.0%) |
| 12 to 14 Years | 0 (0.0%) | 0 (0.0%) |
| 15 Years | 0 (0.0%) | 0 (0.0%) |
| 16 and 17 Years | 0 (0.0%) | 0 (0.0%) |
| 18 to 24 Years | 11 (100.0%) | 29 (100.0%) |
| 25 to 34 Years | 19 (100.0%) | 18 (100.0%) |
| 35 to 44 Years | 14 (100.0%) | 3 (100.0%) |
| 45 to 54 Years | 0 (0.0%) | 6 (100.0%) |
| 55 to 64 Years | 19 (100.0%) | 20 (100.0%) |
| 65 to 74 Years | 13 (100.0%) | 26 (100.0%) |
| 75 Years and over | 0 (0.0%) | 11 (100.0%) |
| Total | 96 (100.0%) | 113 (100.0%) |
Income Below Poverty Among Married-Couple Families in Eschbach
| Children | Above Poverty | Below Poverty |
| No Children | 32 (100.0%) | 0 (0.0%) |
| 1 or 2 Children | 10 (100.0%) | 0 (0.0%) |
| 3 or 4 Children | 0 (0.0%) | 0 (0.0%) |
| 5 or more Children | 0 (0.0%) | 0 (0.0%) |
| Total | 42 (100.0%) | 0 (0.0%) |
Income Below Poverty Among Single-Parent Households in Eschbach
| Children | Single Father | Single Mother |
| No Children | 0 (0.0%) | 0 (0.0%) |
| 1 or 2 Children | 0 (0.0%) | 0 (0.0%) |
| 3 or 4 Children | 0 (0.0%) | 0 (0.0%) |
| 5 or more Children | 0 (0.0%) | 0 (0.0%) |
| Total | 0 (0.0%) | 0 (0.0%) |
Income Below Poverty Among Married-Couple vs Single-Parent Households in Eschbach
| Children | Married-Couple Families | Single-Parent Households |
| No Children | 0 (0.0%) | 0 (0.0%) |
| 1 or 2 Children | 0 (0.0%) | 0 (0.0%) |
| 3 or 4 Children | 0 (0.0%) | 0 (0.0%) |
| 5 or more Children | 0 (0.0%) | 0 (0.0%) |
| Total | 0 (0.0%) | 0 (0.0%) |
Race in Eschbach
The most populous races in Eschbach are White / Caucasian (156 | 74.6%), Hispanic or Latino (73 | 34.9%), and Some other Race (39 | 18.7%).
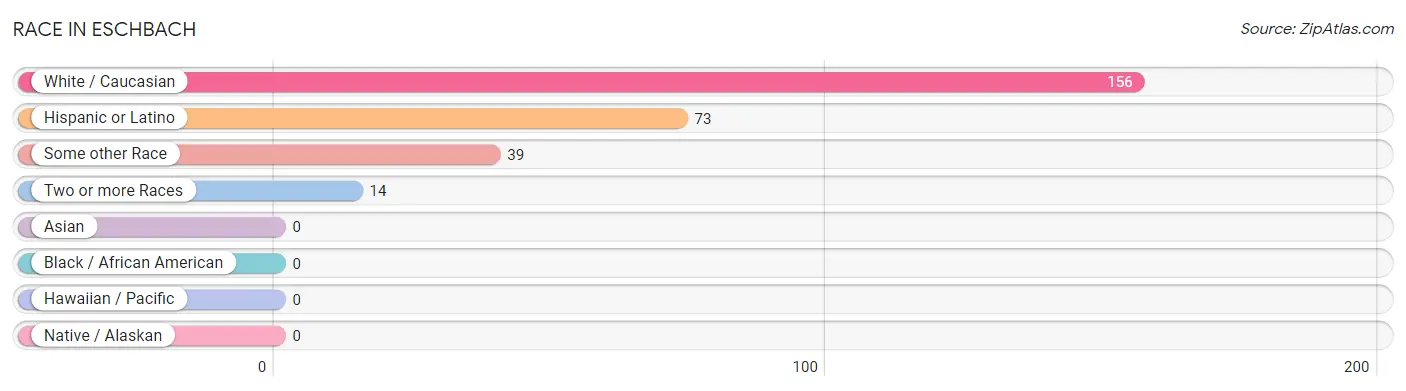
| Race | # Population | % Population |
| Asian | 0 | 0.0% |
| Black / African American | 0 | 0.0% |
| Hawaiian / Pacific | 0 | 0.0% |
| Hispanic or Latino | 73 | 34.9% |
| Native / Alaskan | 0 | 0.0% |
| White / Caucasian | 156 | 74.6% |
| Two or more Races | 14 | 6.7% |
| Some other Race | 39 | 18.7% |
| Total | 209 | 100.0% |
Ancestry in Eschbach
The most populous ancestries reported in Eschbach are Mexican (73 | 34.9%), Scottish (40 | 19.1%), English (32 | 15.3%), German (28 | 13.4%), and French Canadian (22 | 10.5%), together accounting for 93.3% of all Eschbach residents.
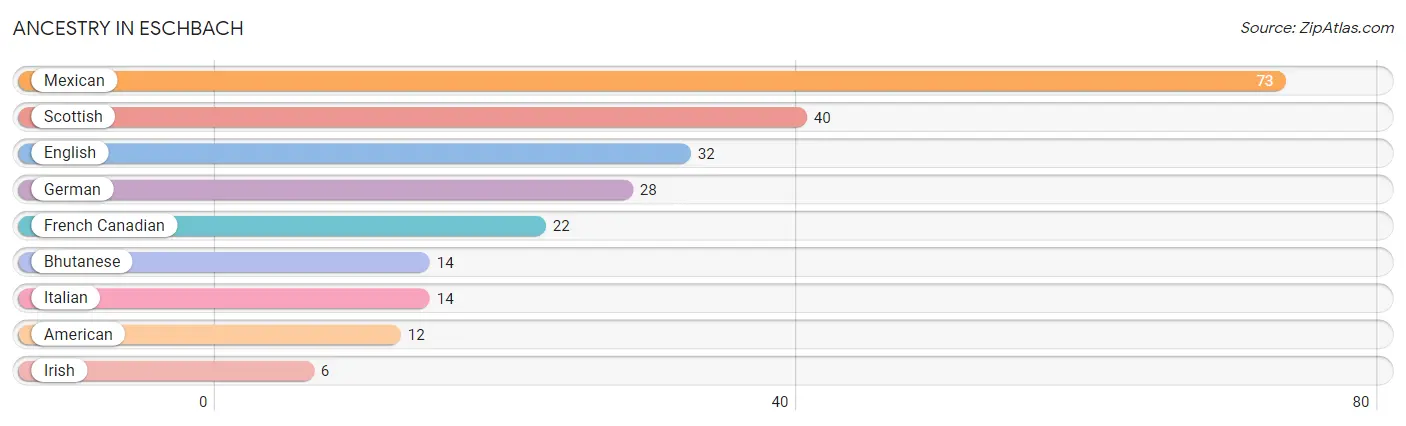
| Ancestry | # Population | % Population |
| American | 12 | 5.7% |
| Bhutanese | 14 | 6.7% |
| English | 32 | 15.3% |
| French Canadian | 22 | 10.5% |
| German | 28 | 13.4% |
| Irish | 6 | 2.9% |
| Italian | 14 | 6.7% |
| Mexican | 73 | 34.9% |
| Scottish | 40 | 19.1% | View All 9 Rows |
Immigrants in Eschbach
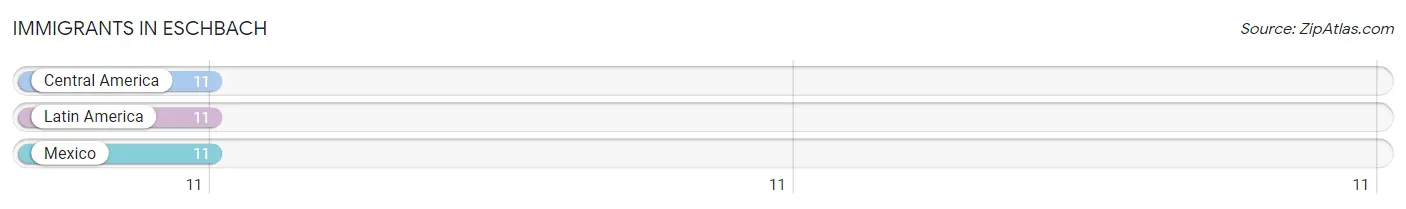
The most numerous immigrant groups reported in Eschbach came from Central America (11 | 5.3%), Latin America (11 | 5.3%), and Mexico (11 | 5.3%), together accounting for 15.8% of all Eschbach residents.
| Immigration Origin | # Population | % Population |
| Central America | 11 | 5.3% |
| Latin America | 11 | 5.3% |
| Mexico | 11 | 5.3% | View All 3 Rows |
Sex and Age in Eschbach
Sex and Age in Eschbach
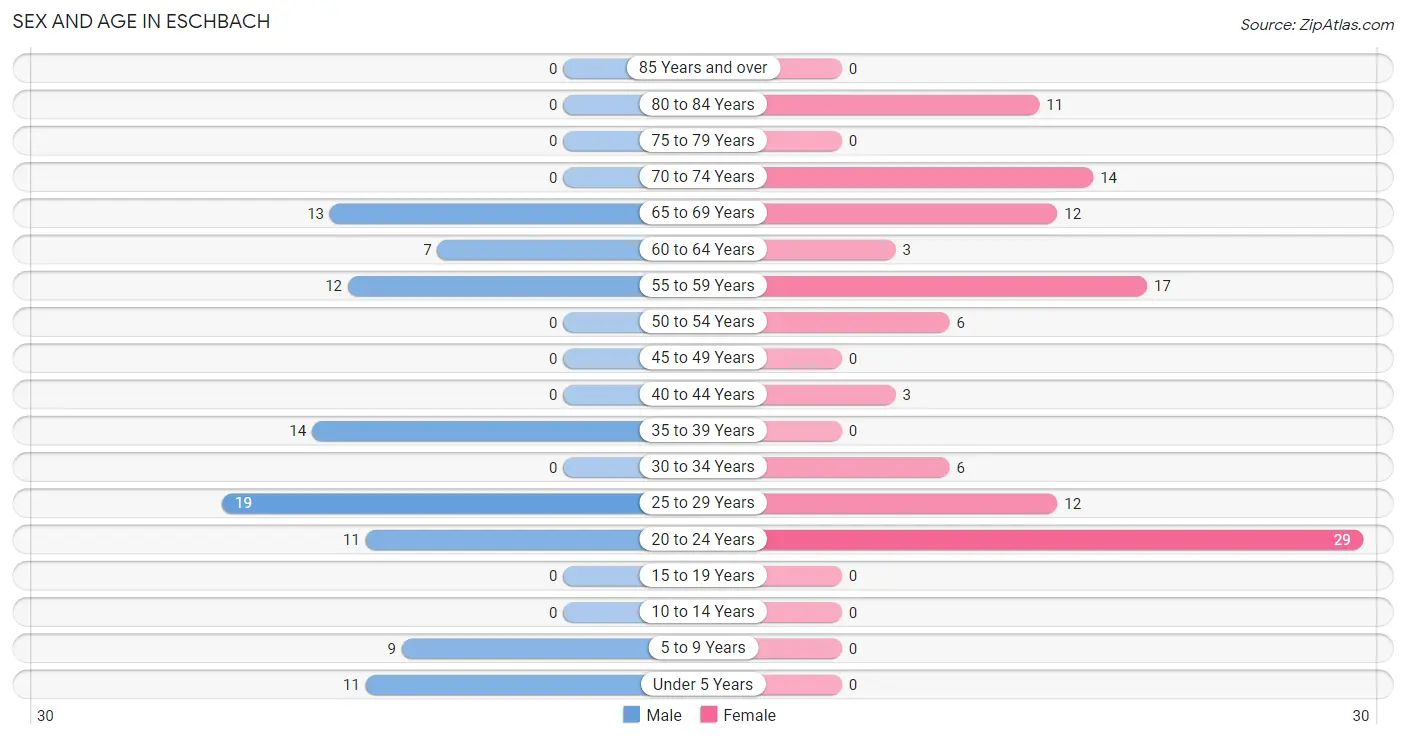
The most populous age groups in Eschbach are 25 to 29 Years (19 | 19.8%) for men and 20 to 24 Years (29 | 25.7%) for women.
| Age Bracket | Male | Female |
| Under 5 Years | 11 (11.5%) | 0 (0.0%) |
| 5 to 9 Years | 9 (9.4%) | 0 (0.0%) |
| 10 to 14 Years | 0 (0.0%) | 0 (0.0%) |
| 15 to 19 Years | 0 (0.0%) | 0 (0.0%) |
| 20 to 24 Years | 11 (11.5%) | 29 (25.7%) |
| 25 to 29 Years | 19 (19.8%) | 12 (10.6%) |
| 30 to 34 Years | 0 (0.0%) | 6 (5.3%) |
| 35 to 39 Years | 14 (14.6%) | 0 (0.0%) |
| 40 to 44 Years | 0 (0.0%) | 3 (2.6%) |
| 45 to 49 Years | 0 (0.0%) | 0 (0.0%) |
| 50 to 54 Years | 0 (0.0%) | 6 (5.3%) |
| 55 to 59 Years | 12 (12.5%) | 17 (15.0%) |
| 60 to 64 Years | 7 (7.3%) | 3 (2.6%) |
| 65 to 69 Years | 13 (13.5%) | 12 (10.6%) |
| 70 to 74 Years | 0 (0.0%) | 14 (12.4%) |
| 75 to 79 Years | 0 (0.0%) | 0 (0.0%) |
| 80 to 84 Years | 0 (0.0%) | 11 (9.7%) |
| 85 Years and over | 0 (0.0%) | 0 (0.0%) |
| Total | 96 (100.0%) | 113 (100.0%) |
Families and Households in Eschbach
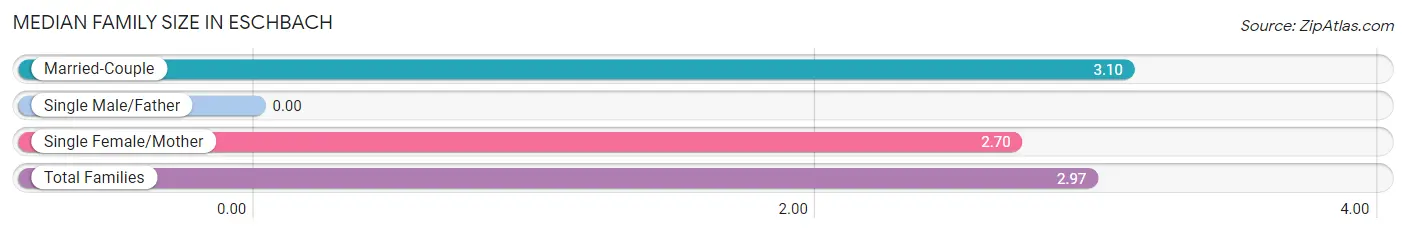
Median Family Size in Eschbach
| Family Type | # Families | Family Size |
| Married-Couple | 42 (67.7%) | 3.10 |
| Single Male/Father | 0 (0.0%) | - |
| Single Female/Mother | 20 (32.3%) | 2.70 |
| Total Families | 62 (100.0%) | 2.97 |
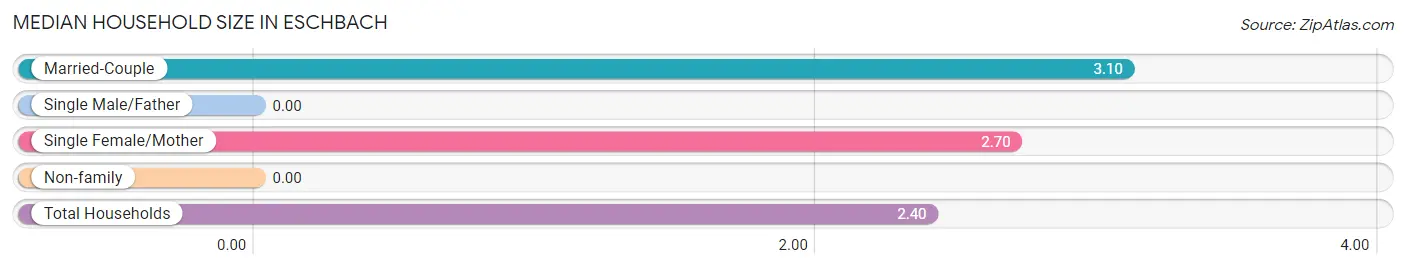
Median Household Size in Eschbach
| Household Type | # Households | Household Size |
| Married-Couple | 42 (48.3%) | 3.10 |
| Single Male/Father | 0 (0.0%) | - |
| Single Female/Mother | 20 (23.0%) | 2.70 |
| Non-family | 25 (28.7%) | - |
| Total Households | 87 (100.0%) | 2.40 |
Household Size by Marriage Status in Eschbach
Out of a total of 87 households in Eschbach, 62 (71.3%) are family households, while 25 (28.7%) are nonfamily households. The most numerous type of family households are 2-person households, comprising 31, and the most common type of nonfamily households are 1-person households, comprising 25.
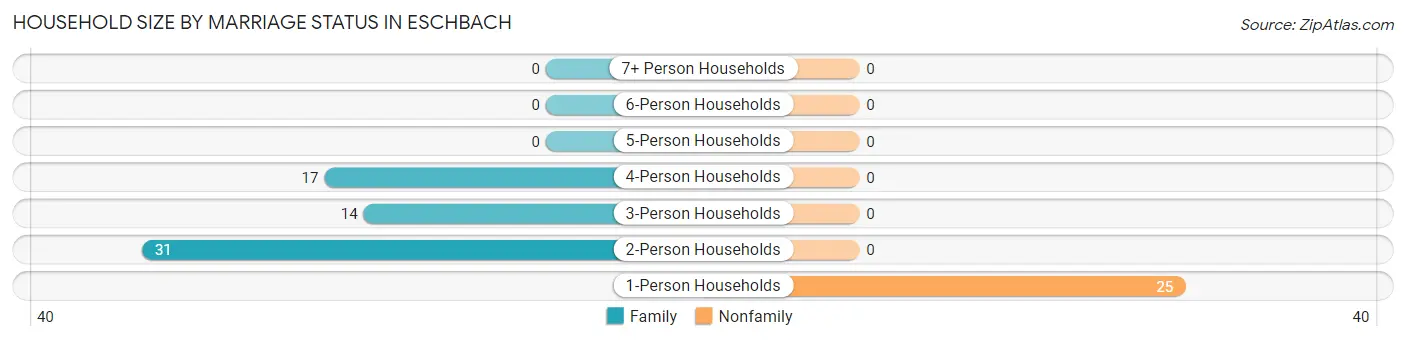
| Household Size | Family Households | Nonfamily Households |
| 1-Person Households | - | 25 (28.7%) |
| 2-Person Households | 31 (35.6%) | 0 (0.0%) |
| 3-Person Households | 14 (16.1%) | 0 (0.0%) |
| 4-Person Households | 17 (19.5%) | 0 (0.0%) |
| 5-Person Households | 0 (0.0%) | 0 (0.0%) |
| 6-Person Households | 0 (0.0%) | 0 (0.0%) |
| 7+ Person Households | 0 (0.0%) | 0 (0.0%) |
| Total | 62 (71.3%) | 25 (28.7%) |
Female Fertility in Eschbach
Fertility by Age in Eschbach
| Age Bracket | Women with Births | Births / 1,000 Women |
| 15 to 19 years | 0 (0.0%) | 0.0 |
| 20 to 34 years | 0 (0.0%) | 0.0 |
| 35 to 50 years | 0 (0.0%) | 0.0 |
| Total | 0 (0.0%) | 0.0 |
Fertility by Age by Marriage Status in Eschbach
| Age Bracket | Married | Unmarried |
| 15 to 19 years | 0 (0.0%) | 0 (0.0%) |
| 20 to 34 years | 0 (0.0%) | 0 (0.0%) |
| 35 to 50 years | 0 (0.0%) | 0 (0.0%) |
| Total | 0 (0.0%) | 0 (0.0%) |
Fertility by Education in Eschbach
| Educational Attainment | Women with Births | Births / 1,000 Women |
| Less than High School | 0 (0.0%) | 0.0 |
| High School Diploma | 0 (0.0%) | 0.0 |
| College or Associate's Degree | 0 (0.0%) | 0.0 |
| Bachelor's Degree | 0 (0.0%) | 0.0 |
| Graduate Degree | 0 (0.0%) | 0.0 |
| Total | 0 (0.0%) | 0.0 |
Fertility by Education by Marriage Status in Eschbach
| Educational Attainment | Married | Unmarried |
| Less than High School | 0 (0.0%) | 0 (0.0%) |
| High School Diploma | 0 (0.0%) | 0 (0.0%) |
| College or Associate's Degree | 0 (0.0%) | 0 (0.0%) |
| Bachelor's Degree | 0 (0.0%) | 0 (0.0%) |
| Graduate Degree | 0 (0.0%) | 0 (0.0%) |
| Total | 0 (0.0%) | 0 (0.0%) |
Employment Characteristics in Eschbach
Employment by Class of Employer in Eschbach
Among the 130 employed individuals in Eschbach, private company employees (107 | 82.3%), local government employees (14 | 10.8%), and federal government employees (9 | 6.9%) make up the most common classes of employment.
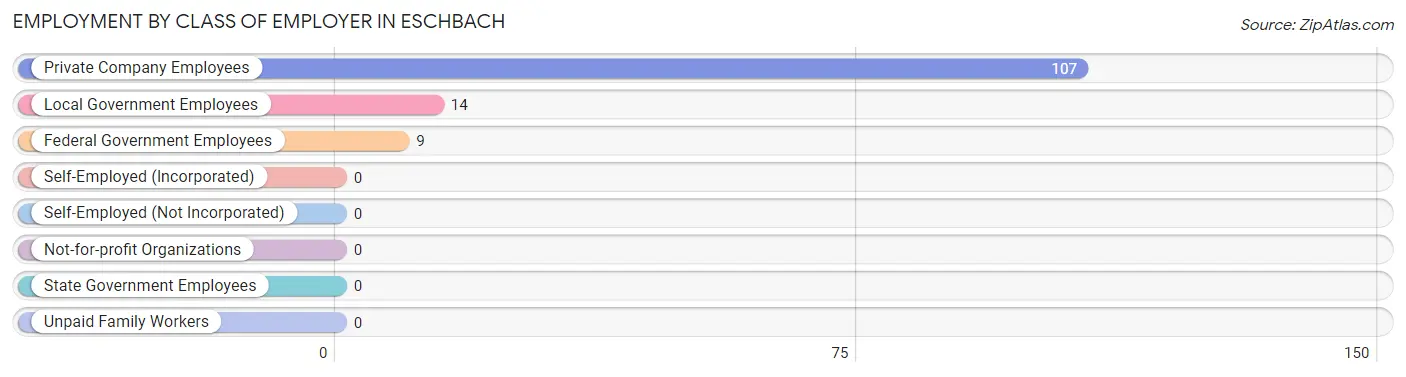
| Employer Class | # Employees | % Employees |
| Private Company Employees | 107 | 82.3% |
| Self-Employed (Incorporated) | 0 | 0.0% |
| Self-Employed (Not Incorporated) | 0 | 0.0% |
| Not-for-profit Organizations | 0 | 0.0% |
| Local Government Employees | 14 | 10.8% |
| State Government Employees | 0 | 0.0% |
| Federal Government Employees | 9 | 6.9% |
| Unpaid Family Workers | 0 | 0.0% |
| Total | 130 | 100.0% |
Employment Status by Age in Eschbach
According to the labor force statistics for Eschbach, out of the total population over 16 years of age (189), 78.8% or 149 individuals are in the labor force, with 12.8% or 19 of them unemployed. The age group with the highest labor force participation rate is 20 to 24 years, with 100.0% or 40 individuals in the labor force. Within the labor force, the 20 to 24 years age range has the highest percentage of unemployed individuals, with 47.5% or 19 of them being unemployed.
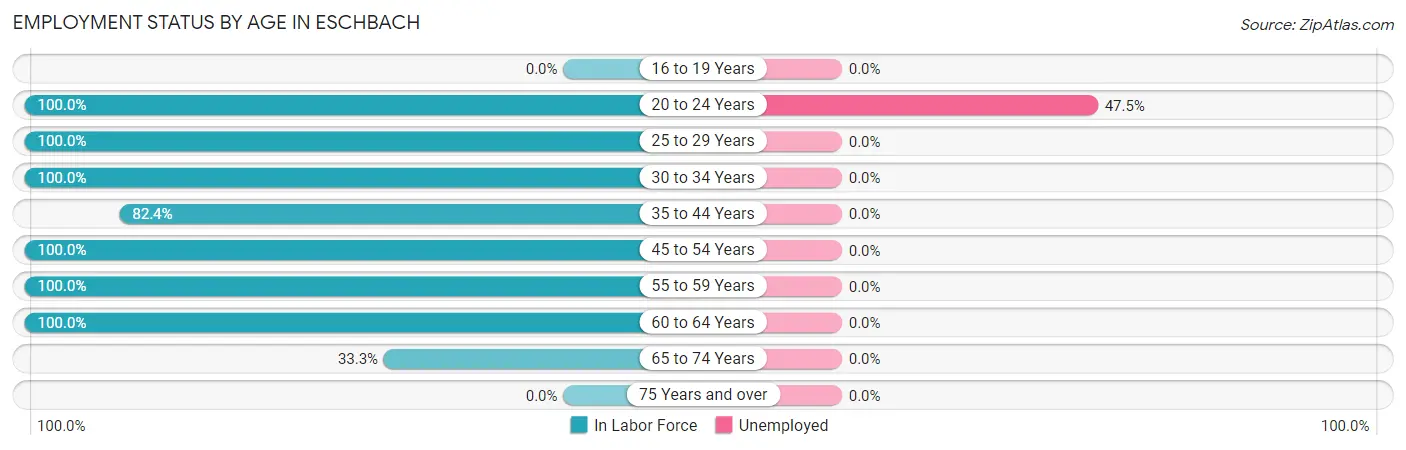
| Age Bracket | In Labor Force | Unemployed |
| 16 to 19 Years | 0 (0.0%) | 0 (0.0%) |
| 20 to 24 Years | 40 (100.0%) | 19 (47.5%) |
| 25 to 29 Years | 31 (100.0%) | 0 (0.0%) |
| 30 to 34 Years | 6 (100.0%) | 0 (0.0%) |
| 35 to 44 Years | 14 (82.4%) | 0 (0.0%) |
| 45 to 54 Years | 6 (100.0%) | 0 (0.0%) |
| 55 to 59 Years | 29 (100.0%) | 0 (0.0%) |
| 60 to 64 Years | 10 (100.0%) | 0 (0.0%) |
| 65 to 74 Years | 13 (33.3%) | 0 (0.0%) |
| 75 Years and over | 0 (0.0%) | 0 (0.0%) |
| Total | 149 (78.8%) | 19 (12.8%) |
Employment Status by Educational Attainment in Eschbach
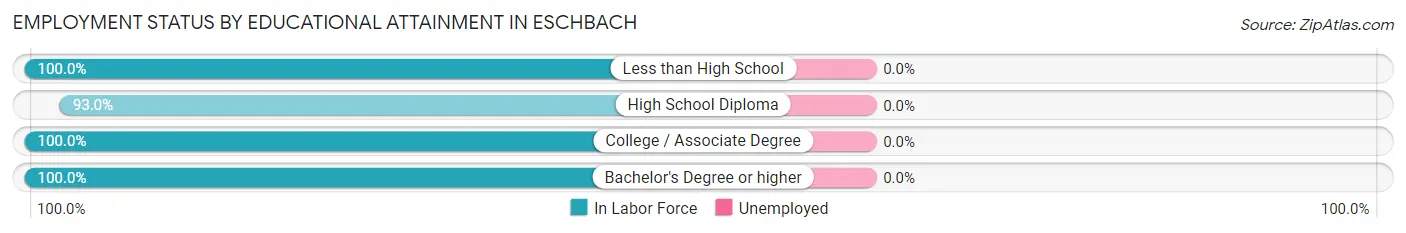
| Educational Attainment | In Labor Force | Unemployed |
| Less than High School | 11 (100.0%) | 0 (0.0%) |
| High School Diploma | 40 (93.0%) | 0 (0.0%) |
| College / Associate Degree | 28 (100.0%) | 0 (0.0%) |
| Bachelor's Degree or higher | 17 (100.0%) | 0 (0.0%) |
| Total | 96 (97.0%) | 0 (0.0%) |
Employment Occupations by Sex in Eschbach
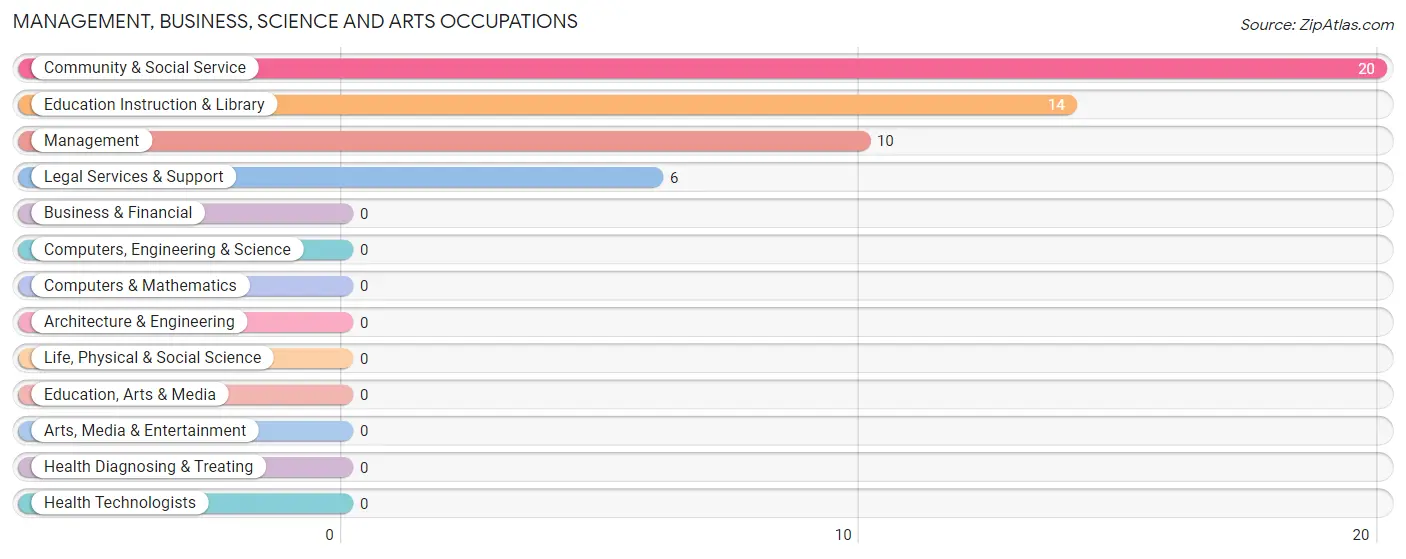
Management, Business, Science and Arts Occupations
The most common Management, Business, Science and Arts occupations in Eschbach are Community & Social Service (20 | 15.4%), Education Instruction & Library (14 | 10.8%), Management (10 | 7.7%), and Legal Services & Support (6 | 4.6%).
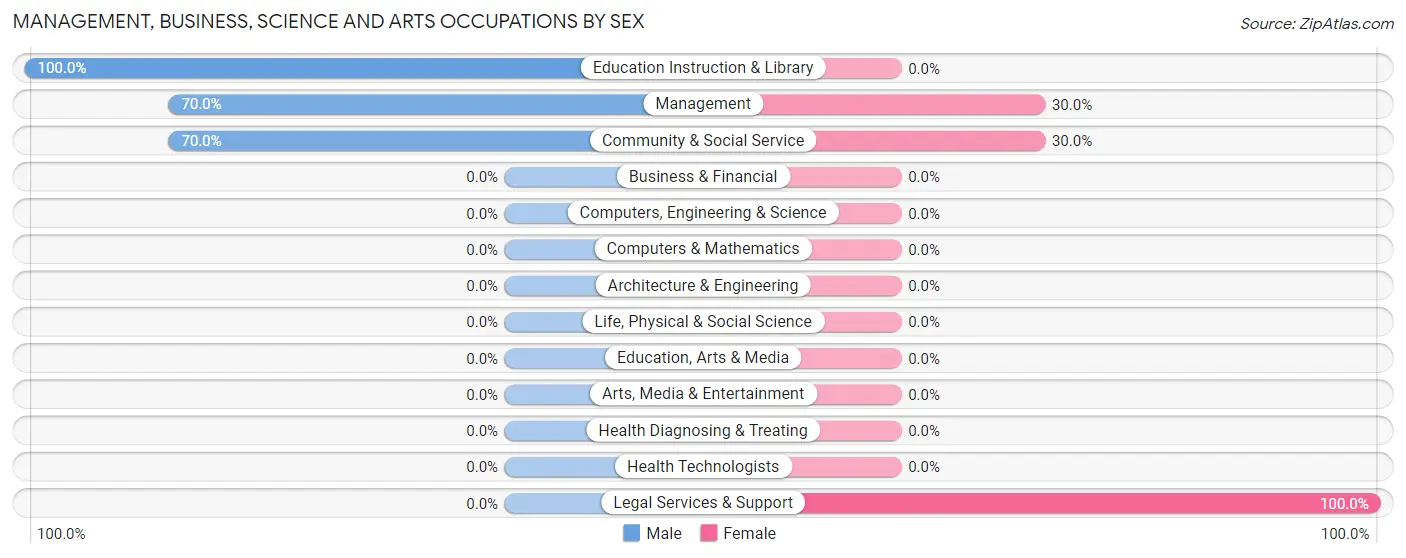
Management, Business, Science and Arts Occupations by Sex
Within the Management, Business, Science and Arts occupations in Eschbach, the most male-oriented occupations are Education Instruction & Library (100.0%), Management (70.0%), and Community & Social Service (70.0%), while the most female-oriented occupations are Legal Services & Support (100.0%), Management (30.0%), and Community & Social Service (30.0%).
| Occupation | Male | Female |
| Management | 7 (70.0%) | 3 (30.0%) |
| Business & Financial | 0 (0.0%) | 0 (0.0%) |
| Computers, Engineering & Science | 0 (0.0%) | 0 (0.0%) |
| Computers & Mathematics | 0 (0.0%) | 0 (0.0%) |
| Architecture & Engineering | 0 (0.0%) | 0 (0.0%) |
| Life, Physical & Social Science | 0 (0.0%) | 0 (0.0%) |
| Community & Social Service | 14 (70.0%) | 6 (30.0%) |
| Education, Arts & Media | 0 (0.0%) | 0 (0.0%) |
| Legal Services & Support | 0 (0.0%) | 6 (100.0%) |
| Education Instruction & Library | 14 (100.0%) | 0 (0.0%) |
| Arts, Media & Entertainment | 0 (0.0%) | 0 (0.0%) |
| Health Diagnosing & Treating | 0 (0.0%) | 0 (0.0%) |
| Health Technologists | 0 (0.0%) | 0 (0.0%) |
| Total (Category) | 21 (70.0%) | 9 (30.0%) |
| Total (Overall) | 76 (58.5%) | 54 (41.5%) |
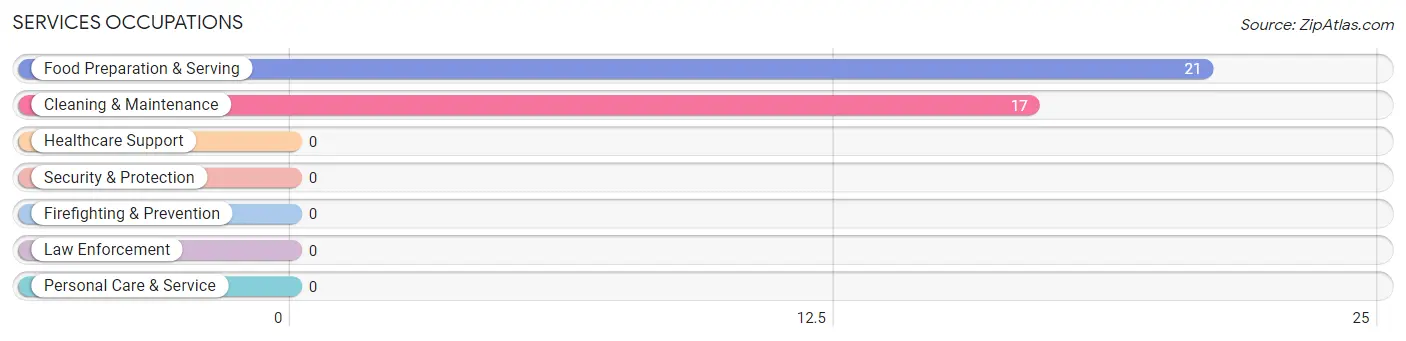
Services Occupations
The most common Services occupations in Eschbach are Food Preparation & Serving (21 | 16.2%), and Cleaning & Maintenance (17 | 13.1%).
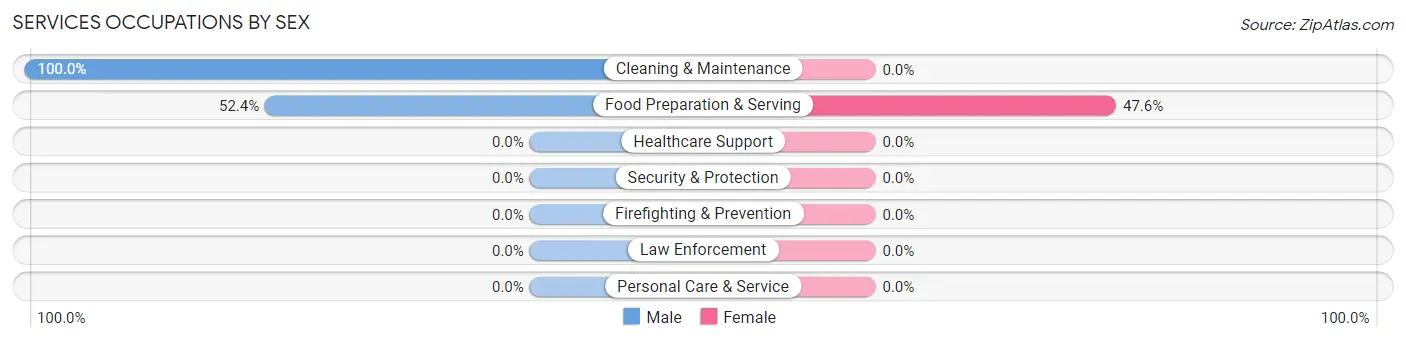
Services Occupations by Sex
| Occupation | Male | Female |
| Healthcare Support | 0 (0.0%) | 0 (0.0%) |
| Security & Protection | 0 (0.0%) | 0 (0.0%) |
| Firefighting & Prevention | 0 (0.0%) | 0 (0.0%) |
| Law Enforcement | 0 (0.0%) | 0 (0.0%) |
| Food Preparation & Serving | 11 (52.4%) | 10 (47.6%) |
| Cleaning & Maintenance | 17 (100.0%) | 0 (0.0%) |
| Personal Care & Service | 0 (0.0%) | 0 (0.0%) |
| Total (Category) | 28 (73.7%) | 10 (26.3%) |
| Total (Overall) | 76 (58.5%) | 54 (41.5%) |
Sales and Office Occupations
The most common Sales and Office occupations in Eschbach are , and Office & Administration (12 | 9.2%).
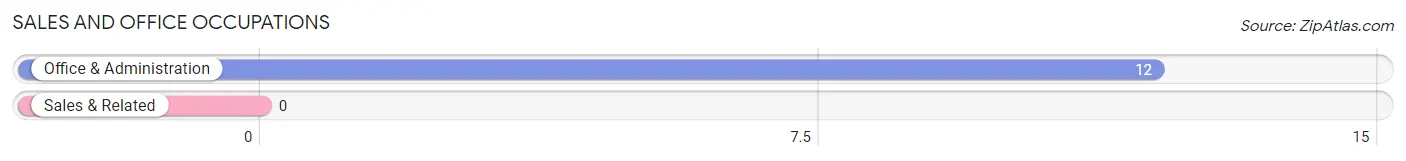
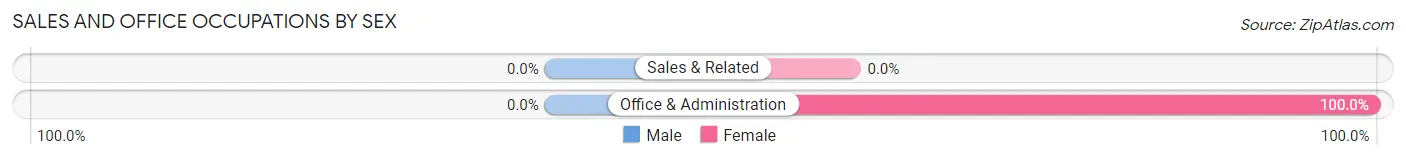
Sales and Office Occupations by Sex
| Occupation | Male | Female |
| Sales & Related | 0 (0.0%) | 0 (0.0%) |
| Office & Administration | 0 (0.0%) | 12 (100.0%) |
| Total (Category) | 0 (0.0%) | 12 (100.0%) |
| Total (Overall) | 76 (58.5%) | 54 (41.5%) |
Natural Resources, Construction and Maintenance Occupations
The most common Natural Resources, Construction and Maintenance occupations in Eschbach are Construction & Extraction (13 | 10.0%), and Farming, Fishing & Forestry (12 | 9.2%).
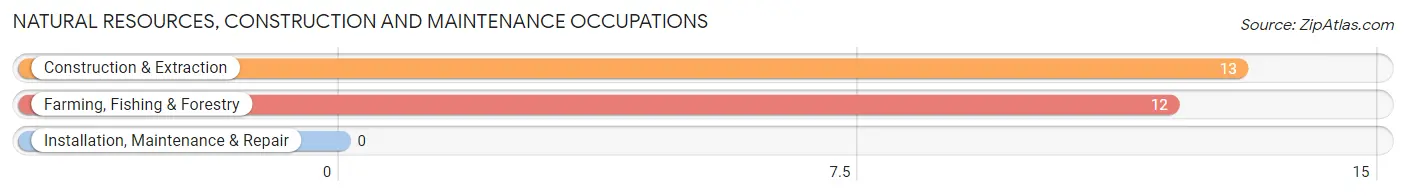
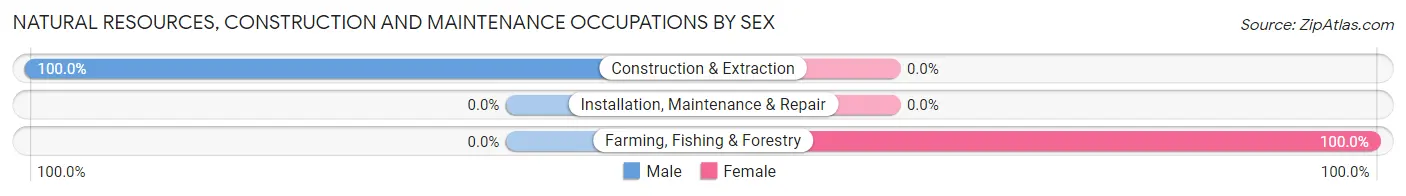
Natural Resources, Construction and Maintenance Occupations by Sex
| Occupation | Male | Female |
| Farming, Fishing & Forestry | 0 (0.0%) | 12 (100.0%) |
| Construction & Extraction | 13 (100.0%) | 0 (0.0%) |
| Installation, Maintenance & Repair | 0 (0.0%) | 0 (0.0%) |
| Total (Category) | 13 (52.0%) | 12 (48.0%) |
| Total (Overall) | 76 (58.5%) | 54 (41.5%) |
Production, Transportation and Moving Occupations
The most common Production, Transportation and Moving occupations in Eschbach are Production (14 | 10.8%), and Material Moving (11 | 8.5%).
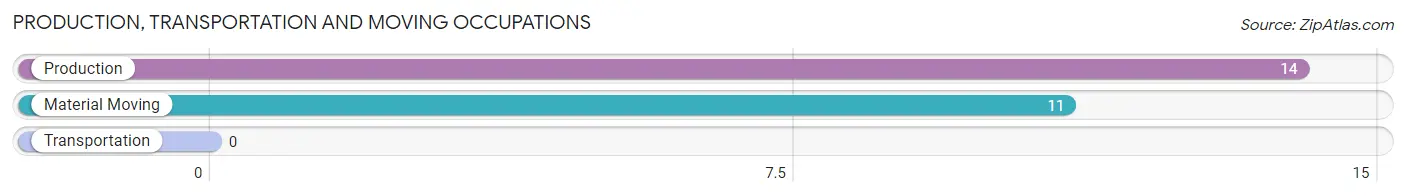
Production, Transportation and Moving Occupations by Sex
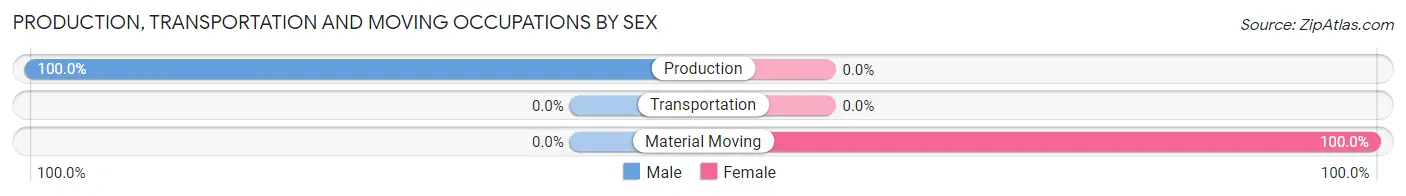
| Occupation | Male | Female |
| Production | 14 (100.0%) | 0 (0.0%) |
| Transportation | 0 (0.0%) | 0 (0.0%) |
| Material Moving | 0 (0.0%) | 11 (100.0%) |
| Total (Category) | 14 (56.0%) | 11 (44.0%) |
| Total (Overall) | 76 (58.5%) | 54 (41.5%) |
Employment Industries by Sex in Eschbach
Employment Industries in Eschbach
The major employment industries in Eschbach include Manufacturing (30 | 23.1%), Accommodation & Food Services (23 | 17.7%), Agriculture, Fishing & Hunting (20 | 15.4%), Educational Services (14 | 10.8%), and Wholesale Trade (11 | 8.5%).
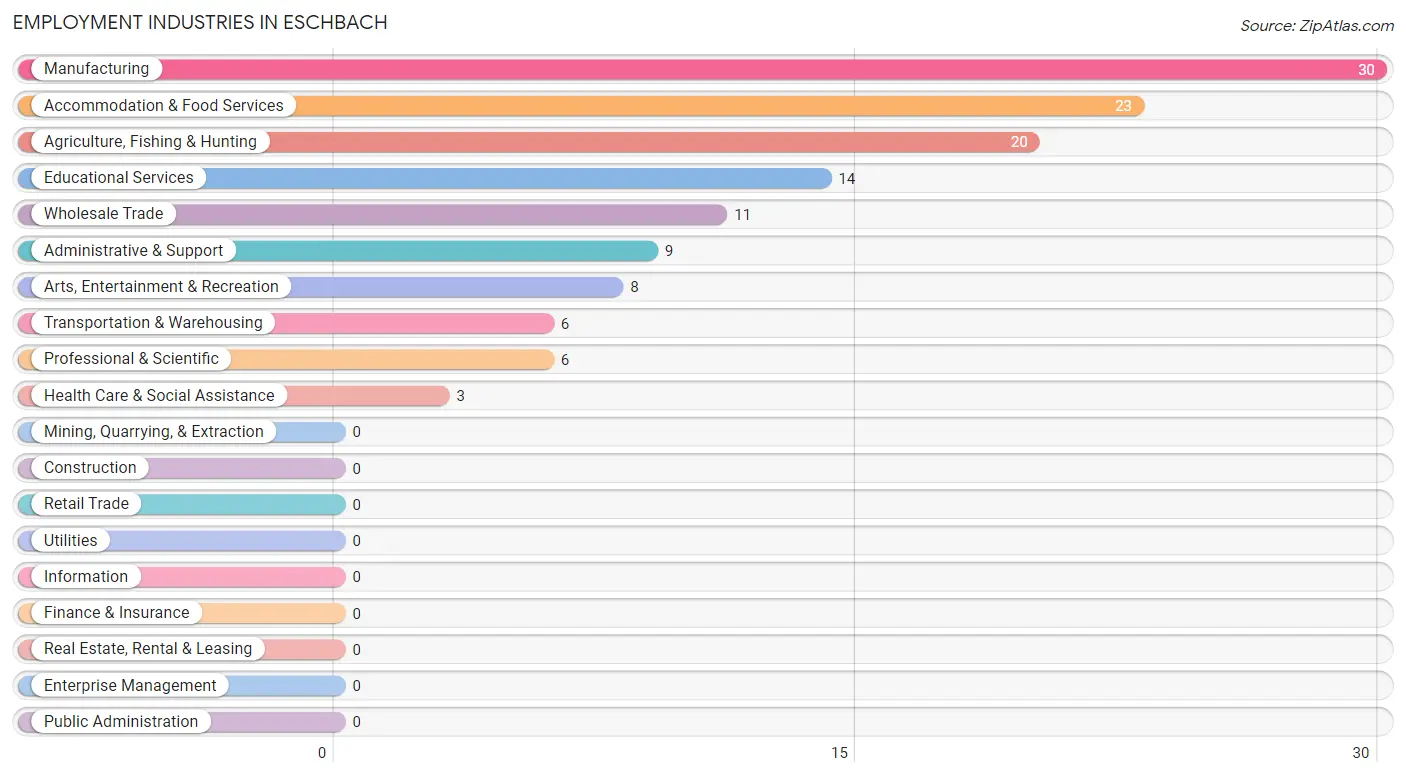
Employment Industries by Sex in Eschbach
The Eschbach industries that see more men than women are Agriculture, Fishing & Hunting (100.0%), Administrative & Support (100.0%), and Educational Services (100.0%), whereas the industries that tend to have a higher number of women are Wholesale Trade (100.0%), Transportation & Warehousing (100.0%), and Professional & Scientific (100.0%).
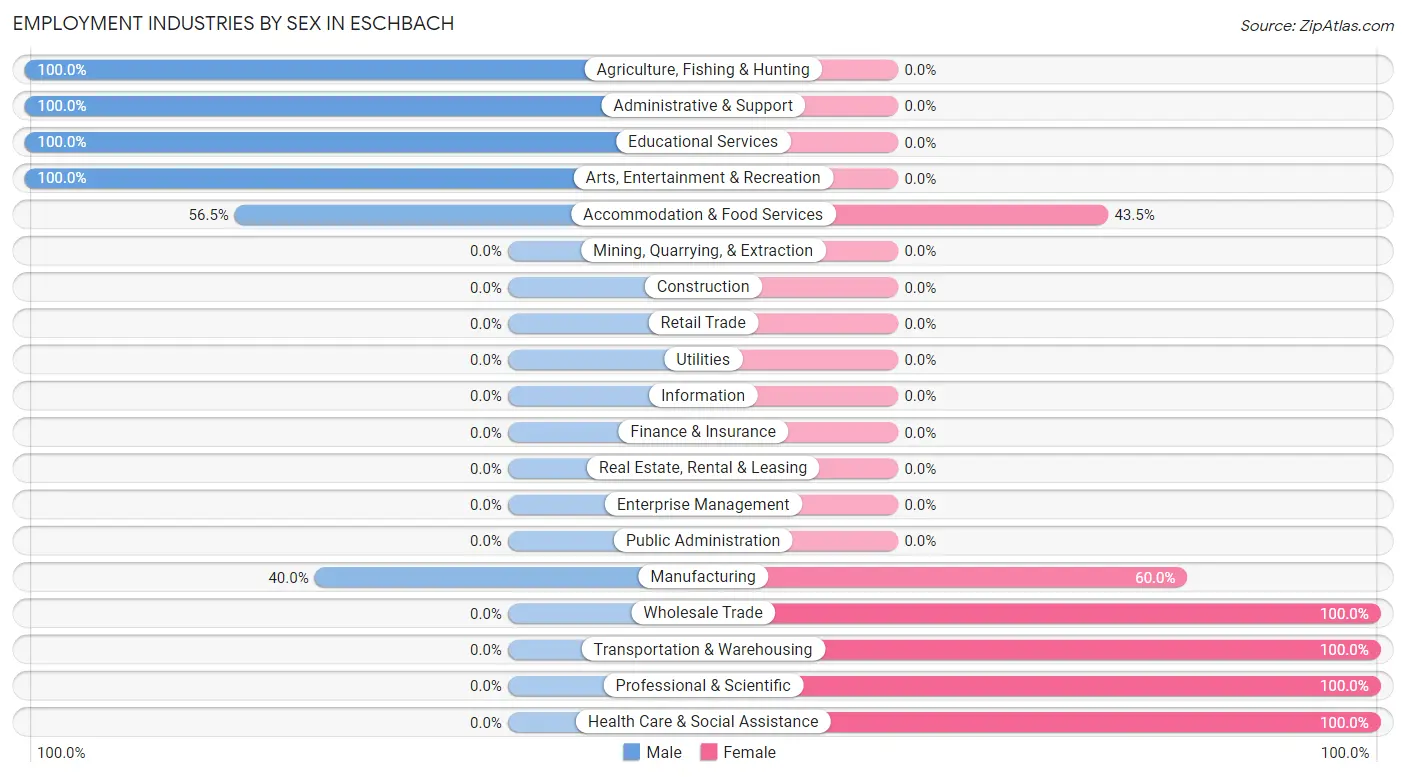
| Industry | Male | Female |
| Agriculture, Fishing & Hunting | 20 (100.0%) | 0 (0.0%) |
| Mining, Quarrying, & Extraction | 0 (0.0%) | 0 (0.0%) |
| Construction | 0 (0.0%) | 0 (0.0%) |
| Manufacturing | 12 (40.0%) | 18 (60.0%) |
| Wholesale Trade | 0 (0.0%) | 11 (100.0%) |
| Retail Trade | 0 (0.0%) | 0 (0.0%) |
| Transportation & Warehousing | 0 (0.0%) | 6 (100.0%) |
| Utilities | 0 (0.0%) | 0 (0.0%) |
| Information | 0 (0.0%) | 0 (0.0%) |
| Finance & Insurance | 0 (0.0%) | 0 (0.0%) |
| Real Estate, Rental & Leasing | 0 (0.0%) | 0 (0.0%) |
| Professional & Scientific | 0 (0.0%) | 6 (100.0%) |
| Enterprise Management | 0 (0.0%) | 0 (0.0%) |
| Administrative & Support | 9 (100.0%) | 0 (0.0%) |
| Educational Services | 14 (100.0%) | 0 (0.0%) |
| Health Care & Social Assistance | 0 (0.0%) | 3 (100.0%) |
| Arts, Entertainment & Recreation | 8 (100.0%) | 0 (0.0%) |
| Accommodation & Food Services | 13 (56.5%) | 10 (43.5%) |
| Public Administration | 0 (0.0%) | 0 (0.0%) |
| Total | 76 (58.5%) | 54 (41.5%) |
Education in Eschbach
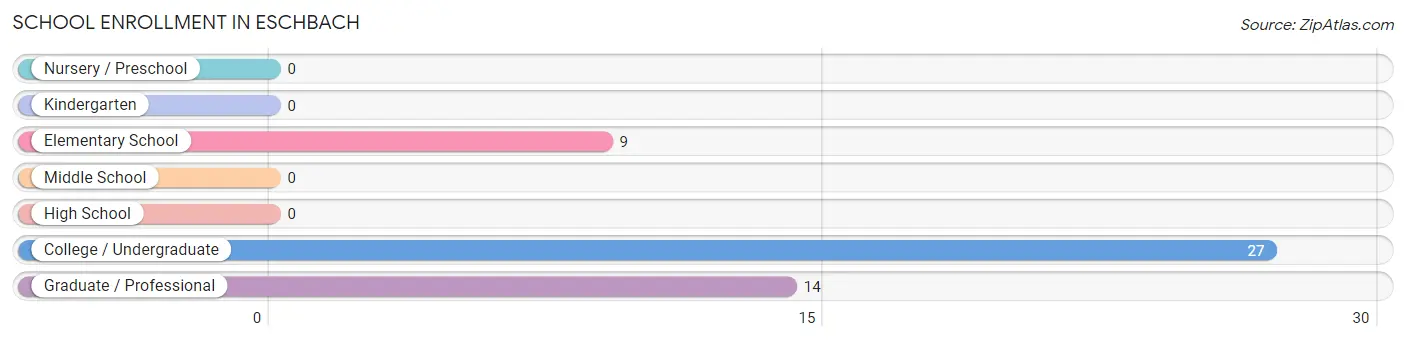
School Enrollment in Eschbach
The most common levels of schooling among the 50 students in Eschbach are college / undergraduate (27 | 54.0%), graduate / professional (14 | 28.0%), and elementary school (9 | 18.0%).
| School Level | # Students | % Students |
| Nursery / Preschool | 0 | 0.0% |
| Kindergarten | 0 | 0.0% |
| Elementary School | 9 | 18.0% |
| Middle School | 0 | 0.0% |
| High School | 0 | 0.0% |
| College / Undergraduate | 27 | 54.0% |
| Graduate / Professional | 14 | 28.0% |
| Total | 50 | 100.0% |
School Enrollment by Age by Funding Source in Eschbach
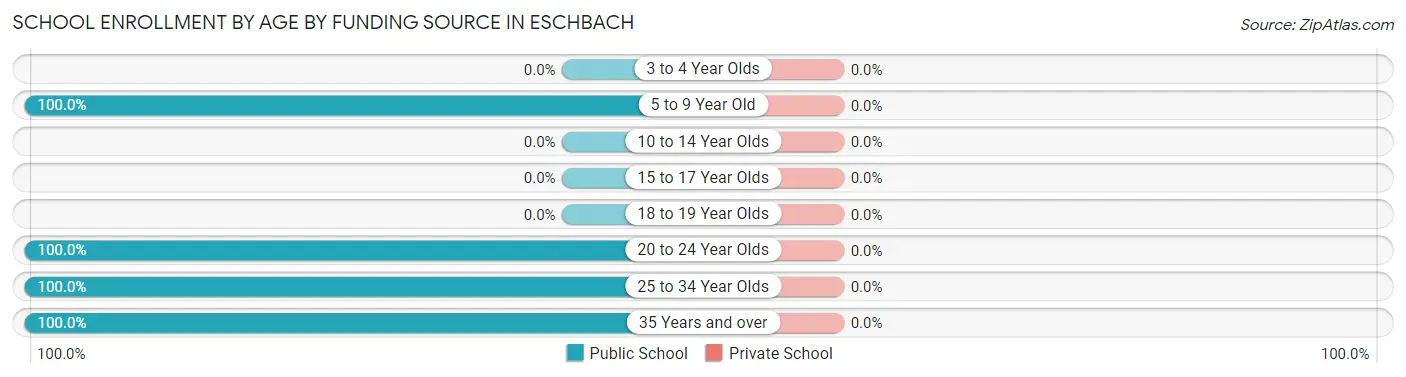
| Age Bracket | Public School | Private School |
| 3 to 4 Year Olds | 0 (0.0%) | 0 (0.0%) |
| 5 to 9 Year Old | 9 (100.0%) | 0 (0.0%) |
| 10 to 14 Year Olds | 0 (0.0%) | 0 (0.0%) |
| 15 to 17 Year Olds | 0 (0.0%) | 0 (0.0%) |
| 18 to 19 Year Olds | 0 (0.0%) | 0 (0.0%) |
| 20 to 24 Year Olds | 19 (100.0%) | 0 (0.0%) |
| 25 to 34 Year Olds | 8 (100.0%) | 0 (0.0%) |
| 35 Years and over | 14 (100.0%) | 0 (0.0%) |
| Total | 50 (100.0%) | 0 (0.0%) |
Educational Attainment by Field of Study in Eschbach
Psychology (14 | 19.7%), education (14 | 19.7%), communications (14 | 19.7%), engineering (13 | 18.3%), and business (13 | 18.3%) are the most common fields of study among 71 individuals in Eschbach who have obtained a bachelor's degree or higher.
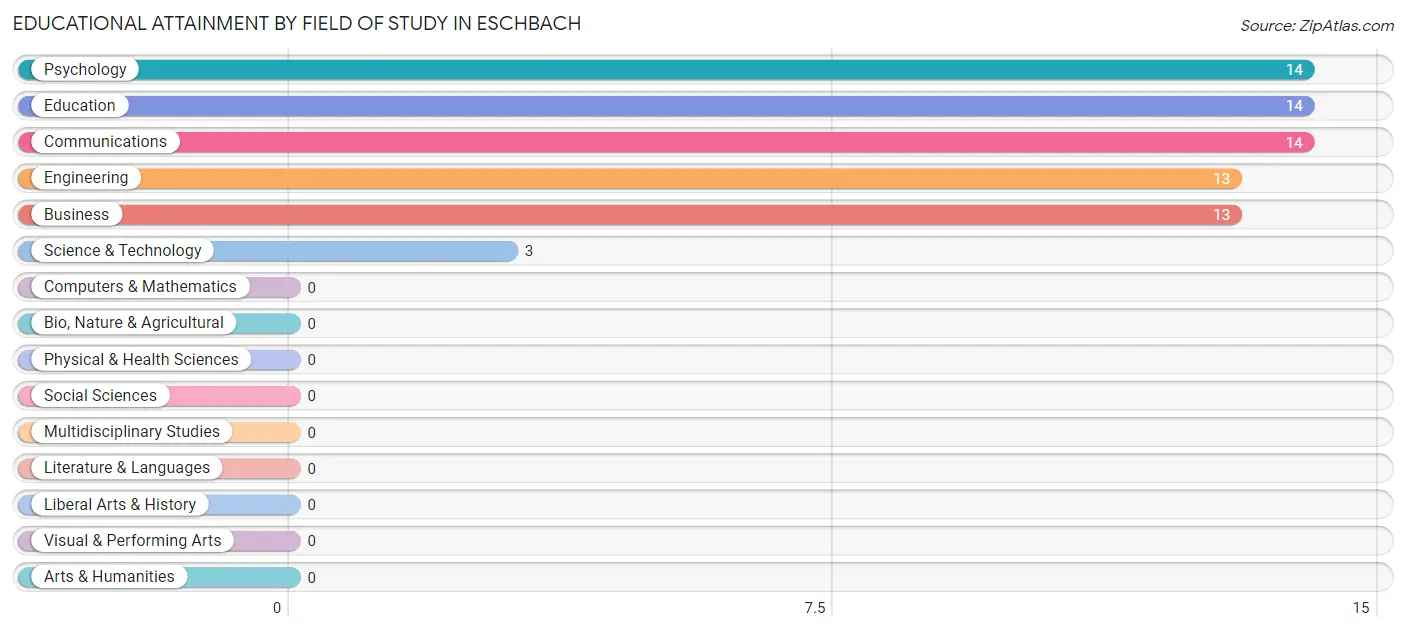
| Field of Study | # Graduates | % Graduates |
| Computers & Mathematics | 0 | 0.0% |
| Bio, Nature & Agricultural | 0 | 0.0% |
| Physical & Health Sciences | 0 | 0.0% |
| Psychology | 14 | 19.7% |
| Social Sciences | 0 | 0.0% |
| Engineering | 13 | 18.3% |
| Multidisciplinary Studies | 0 | 0.0% |
| Science & Technology | 3 | 4.2% |
| Business | 13 | 18.3% |
| Education | 14 | 19.7% |
| Literature & Languages | 0 | 0.0% |
| Liberal Arts & History | 0 | 0.0% |
| Visual & Performing Arts | 0 | 0.0% |
| Communications | 14 | 19.7% |
| Arts & Humanities | 0 | 0.0% |
| Total | 71 | 100.0% |
Transportation & Commute in Eschbach
Vehicle Availability by Sex in Eschbach
The most prevalent vehicle ownership categories in Eschbach are males with 3 vehicles (35, accounting for 46.1%) and females with 3 vehicles (16, making up 64.8%).
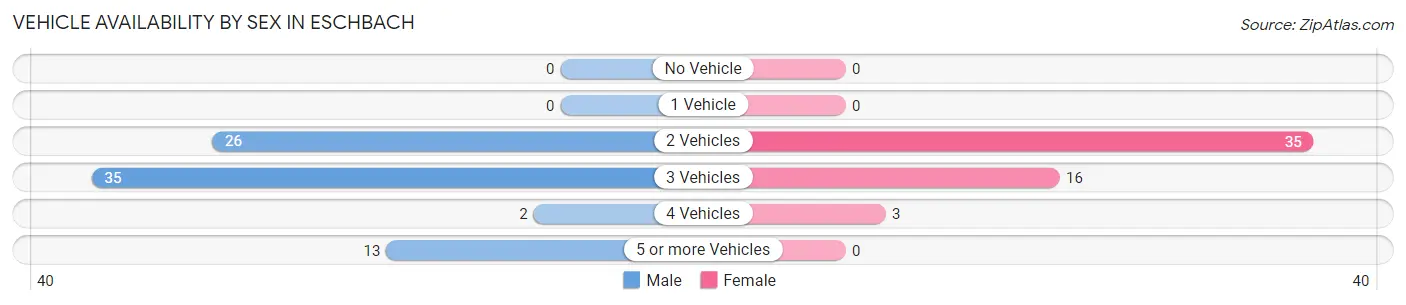
| Vehicles Available | Male | Female |
| No Vehicle | 0 (0.0%) | 0 (0.0%) |
| 1 Vehicle | 0 (0.0%) | 0 (0.0%) |
| 2 Vehicles | 26 (34.2%) | 35 (64.8%) |
| 3 Vehicles | 35 (46.1%) | 16 (29.6%) |
| 4 Vehicles | 2 (2.6%) | 3 (5.6%) |
| 5 or more Vehicles | 13 (17.1%) | 0 (0.0%) |
| Total | 76 (100.0%) | 54 (100.0%) |
Commute Time in Eschbach
The most frequently occuring commute durations in Eschbach are 15 to 19 minutes (33 commuters, 26.6%), 10 to 14 minutes (27 commuters, 21.8%), and 25 to 29 minutes (26 commuters, 21.0%).
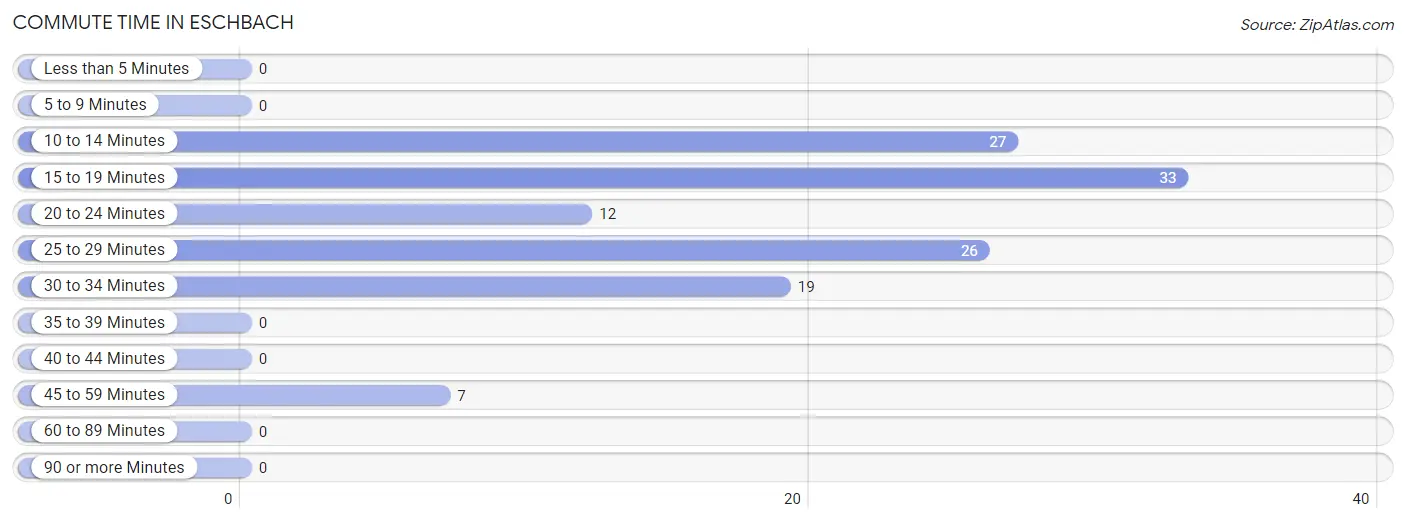
| Commute Time | # Commuters | % Commuters |
| Less than 5 Minutes | 0 | 0.0% |
| 5 to 9 Minutes | 0 | 0.0% |
| 10 to 14 Minutes | 27 | 21.8% |
| 15 to 19 Minutes | 33 | 26.6% |
| 20 to 24 Minutes | 12 | 9.7% |
| 25 to 29 Minutes | 26 | 21.0% |
| 30 to 34 Minutes | 19 | 15.3% |
| 35 to 39 Minutes | 0 | 0.0% |
| 40 to 44 Minutes | 0 | 0.0% |
| 45 to 59 Minutes | 7 | 5.7% |
| 60 to 89 Minutes | 0 | 0.0% |
| 90 or more Minutes | 0 | 0.0% |
Commute Time by Sex in Eschbach
The most common commute times in Eschbach are 15 to 19 minutes (22 commuters, 28.9%) for males and 10 to 14 minutes (15 commuters, 31.2%) for females.
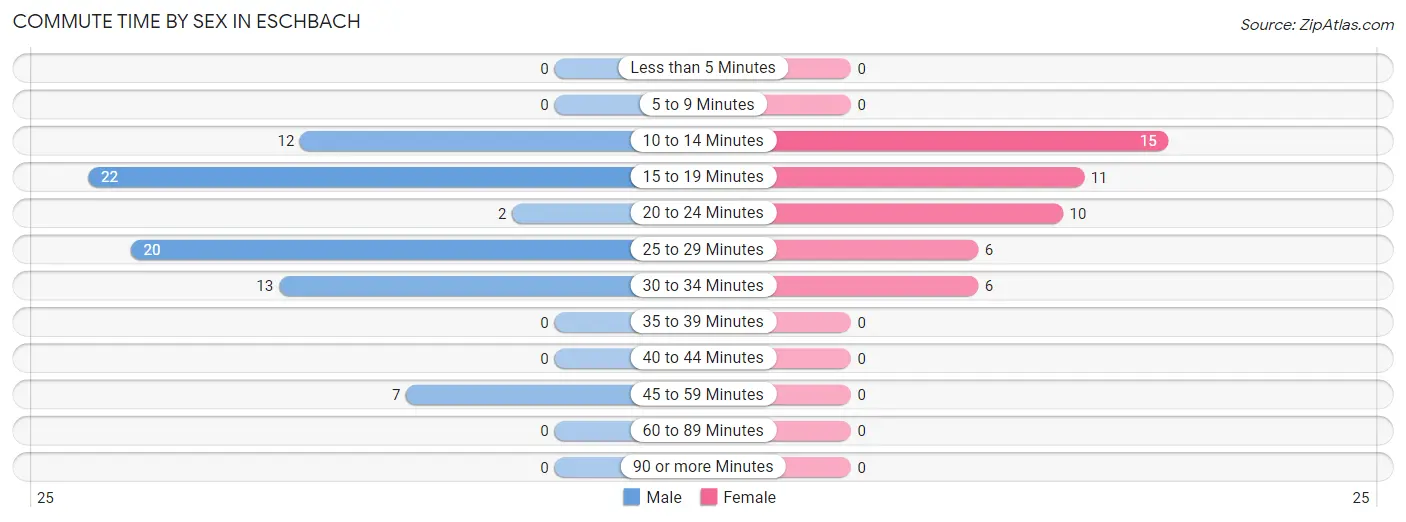
| Commute Time | Male | Female |
| Less than 5 Minutes | 0 (0.0%) | 0 (0.0%) |
| 5 to 9 Minutes | 0 (0.0%) | 0 (0.0%) |
| 10 to 14 Minutes | 12 (15.8%) | 15 (31.2%) |
| 15 to 19 Minutes | 22 (28.9%) | 11 (22.9%) |
| 20 to 24 Minutes | 2 (2.6%) | 10 (20.8%) |
| 25 to 29 Minutes | 20 (26.3%) | 6 (12.5%) |
| 30 to 34 Minutes | 13 (17.1%) | 6 (12.5%) |
| 35 to 39 Minutes | 0 (0.0%) | 0 (0.0%) |
| 40 to 44 Minutes | 0 (0.0%) | 0 (0.0%) |
| 45 to 59 Minutes | 7 (9.2%) | 0 (0.0%) |
| 60 to 89 Minutes | 0 (0.0%) | 0 (0.0%) |
| 90 or more Minutes | 0 (0.0%) | 0 (0.0%) |
Time of Departure to Work by Sex in Eschbach
The most frequent times of departure to work in Eschbach are 6:30 AM to 6:59 AM (36, 47.4%) for males and 7:00 AM to 7:29 AM (17, 35.4%) for females.
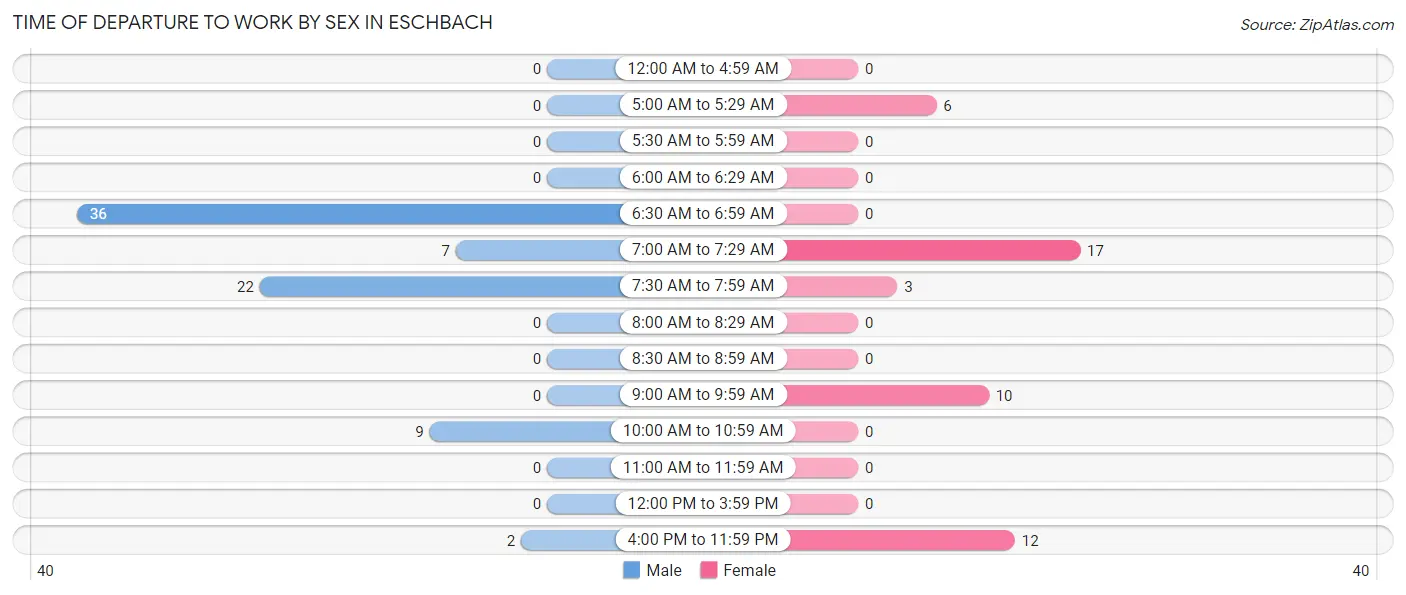
| Time of Departure | Male | Female |
| 12:00 AM to 4:59 AM | 0 (0.0%) | 0 (0.0%) |
| 5:00 AM to 5:29 AM | 0 (0.0%) | 6 (12.5%) |
| 5:30 AM to 5:59 AM | 0 (0.0%) | 0 (0.0%) |
| 6:00 AM to 6:29 AM | 0 (0.0%) | 0 (0.0%) |
| 6:30 AM to 6:59 AM | 36 (47.4%) | 0 (0.0%) |
| 7:00 AM to 7:29 AM | 7 (9.2%) | 17 (35.4%) |
| 7:30 AM to 7:59 AM | 22 (28.9%) | 3 (6.2%) |
| 8:00 AM to 8:29 AM | 0 (0.0%) | 0 (0.0%) |
| 8:30 AM to 8:59 AM | 0 (0.0%) | 0 (0.0%) |
| 9:00 AM to 9:59 AM | 0 (0.0%) | 10 (20.8%) |
| 10:00 AM to 10:59 AM | 9 (11.8%) | 0 (0.0%) |
| 11:00 AM to 11:59 AM | 0 (0.0%) | 0 (0.0%) |
| 12:00 PM to 3:59 PM | 0 (0.0%) | 0 (0.0%) |
| 4:00 PM to 11:59 PM | 2 (2.6%) | 12 (25.0%) |
| Total | 76 (100.0%) | 48 (100.0%) |
Housing Occupancy in Eschbach
Occupancy by Ownership in Eschbach
Of the total 87 dwellings in Eschbach, owner-occupied units account for 73 (83.9%), while renter-occupied units make up 14 (16.1%).
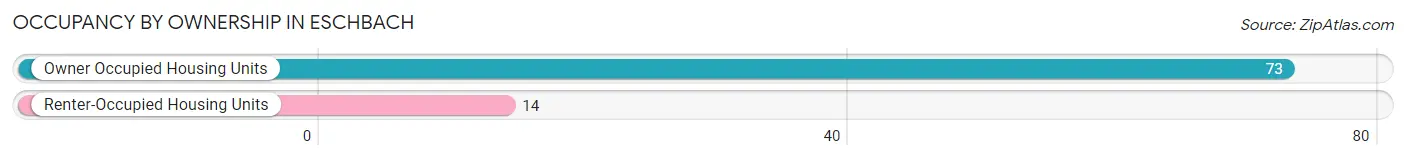
| Occupancy | # Housing Units | % Housing Units |
| Owner Occupied Housing Units | 73 | 83.9% |
| Renter-Occupied Housing Units | 14 | 16.1% |
| Total Occupied Housing Units | 87 | 100.0% |
Occupancy by Household Size in Eschbach
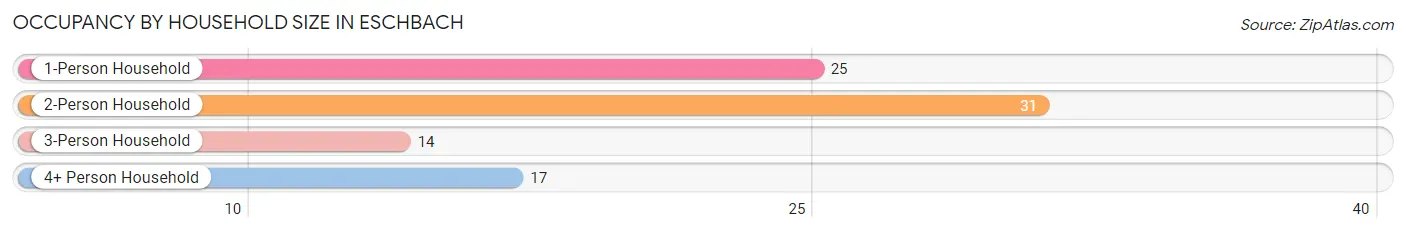
| Household Size | # Housing Units | % Housing Units |
| 1-Person Household | 25 | 28.7% |
| 2-Person Household | 31 | 35.6% |
| 3-Person Household | 14 | 16.1% |
| 4+ Person Household | 17 | 19.5% |
| Total Housing Units | 87 | 100.0% |
Occupancy by Ownership by Household Size in Eschbach
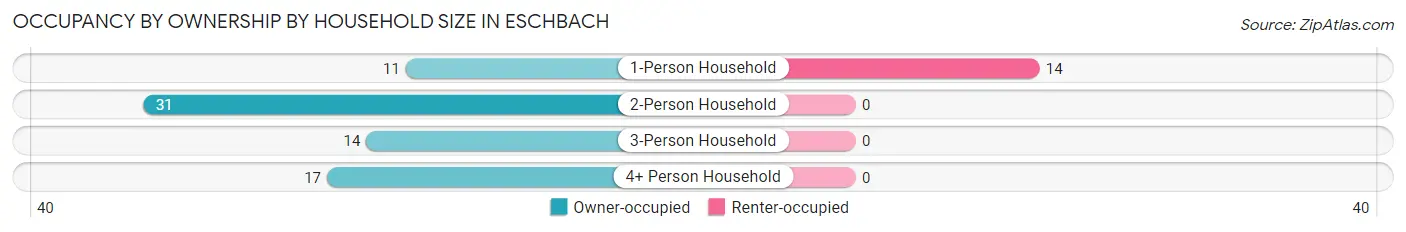
| Household Size | Owner-occupied | Renter-occupied |
| 1-Person Household | 11 (44.0%) | 14 (56.0%) |
| 2-Person Household | 31 (100.0%) | 0 (0.0%) |
| 3-Person Household | 14 (100.0%) | 0 (0.0%) |
| 4+ Person Household | 17 (100.0%) | 0 (0.0%) |
| Total Housing Units | 73 (83.9%) | 14 (16.1%) |
Occupancy by Educational Attainment in Eschbach
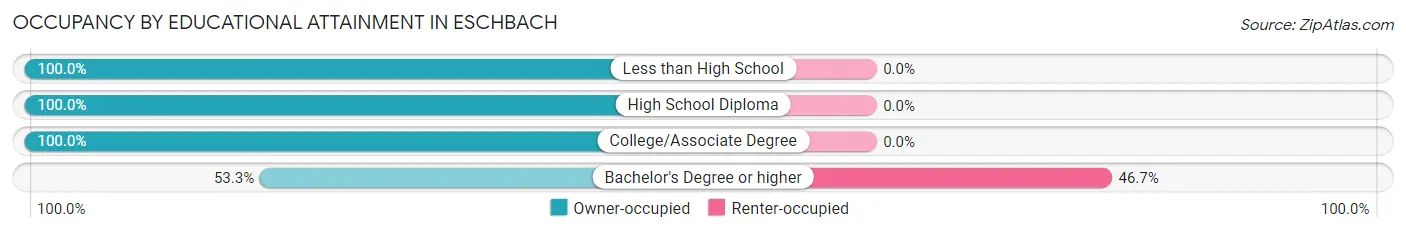
| Household Size | Owner-occupied | Renter-occupied |
| Less than High School | 22 (100.0%) | 0 (0.0%) |
| High School Diploma | 12 (100.0%) | 0 (0.0%) |
| College/Associate Degree | 23 (100.0%) | 0 (0.0%) |
| Bachelor's Degree or higher | 16 (53.3%) | 14 (46.7%) |
Occupancy by Age of Householder in Eschbach
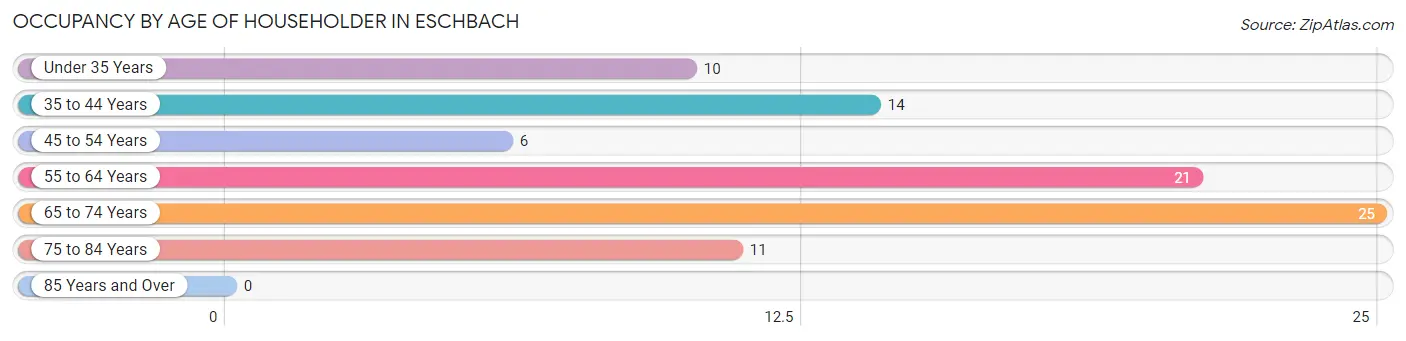
| Age Bracket | # Households | % Households |
| Under 35 Years | 10 | 11.5% |
| 35 to 44 Years | 14 | 16.1% |
| 45 to 54 Years | 6 | 6.9% |
| 55 to 64 Years | 21 | 24.1% |
| 65 to 74 Years | 25 | 28.7% |
| 75 to 84 Years | 11 | 12.6% |
| 85 Years and Over | 0 | 0.0% |
| Total | 87 | 100.0% |
Housing Finances in Eschbach
Median Income by Occupancy in Eschbach
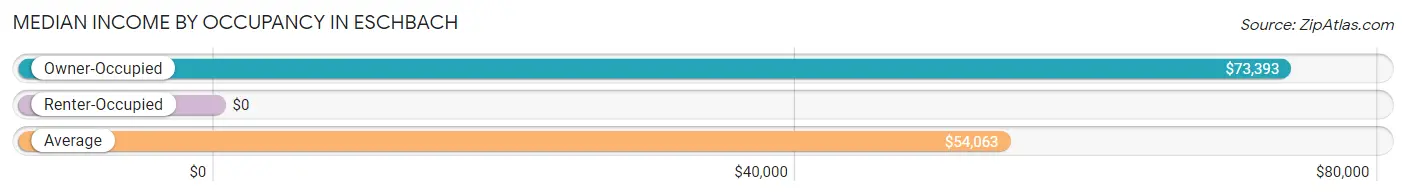
| Occupancy Type | # Households | Median Income |
| Owner-Occupied | 73 (83.9%) | $73,393 |
| Renter-Occupied | 14 (16.1%) | $0 |
| Average | 87 (100.0%) | $54,063 |
Occupancy by Householder Income Bracket in Eschbach
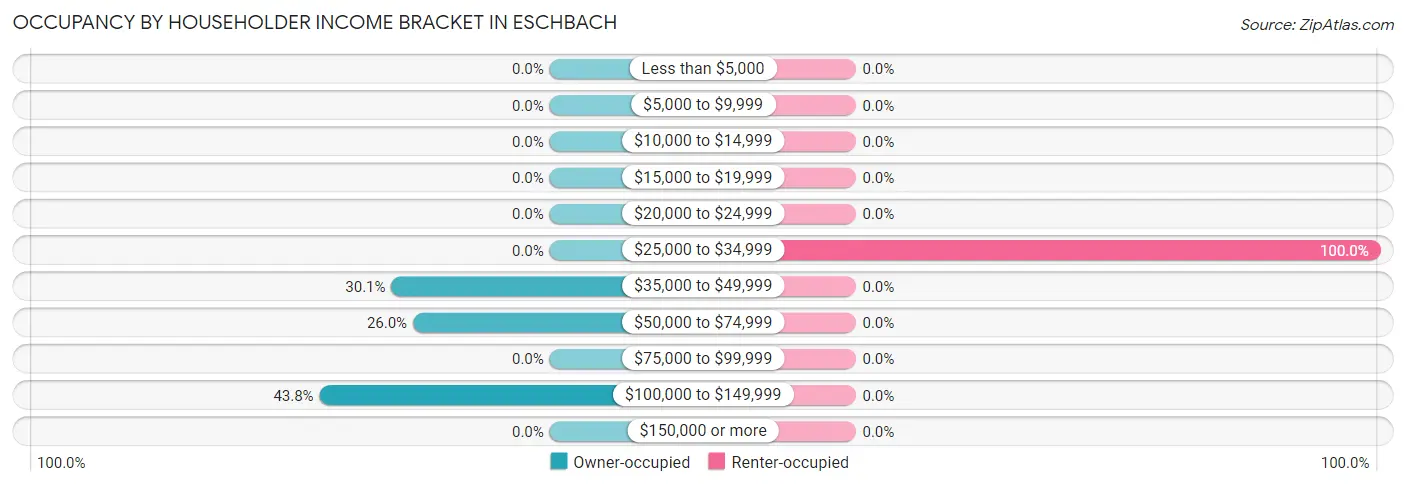
| Income Bracket | Owner-occupied | Renter-occupied |
| Less than $5,000 | 0 (0.0%) | 0 (0.0%) |
| $5,000 to $9,999 | 0 (0.0%) | 0 (0.0%) |
| $10,000 to $14,999 | 0 (0.0%) | 0 (0.0%) |
| $15,000 to $19,999 | 0 (0.0%) | 0 (0.0%) |
| $20,000 to $24,999 | 0 (0.0%) | 0 (0.0%) |
| $25,000 to $34,999 | 0 (0.0%) | 14 (100.0%) |
| $35,000 to $49,999 | 22 (30.1%) | 0 (0.0%) |
| $50,000 to $74,999 | 19 (26.0%) | 0 (0.0%) |
| $75,000 to $99,999 | 0 (0.0%) | 0 (0.0%) |
| $100,000 to $149,999 | 32 (43.8%) | 0 (0.0%) |
| $150,000 or more | 0 (0.0%) | 0 (0.0%) |
| Total | 73 (100.0%) | 14 (100.0%) |
Monthly Housing Cost Tiers in Eschbach
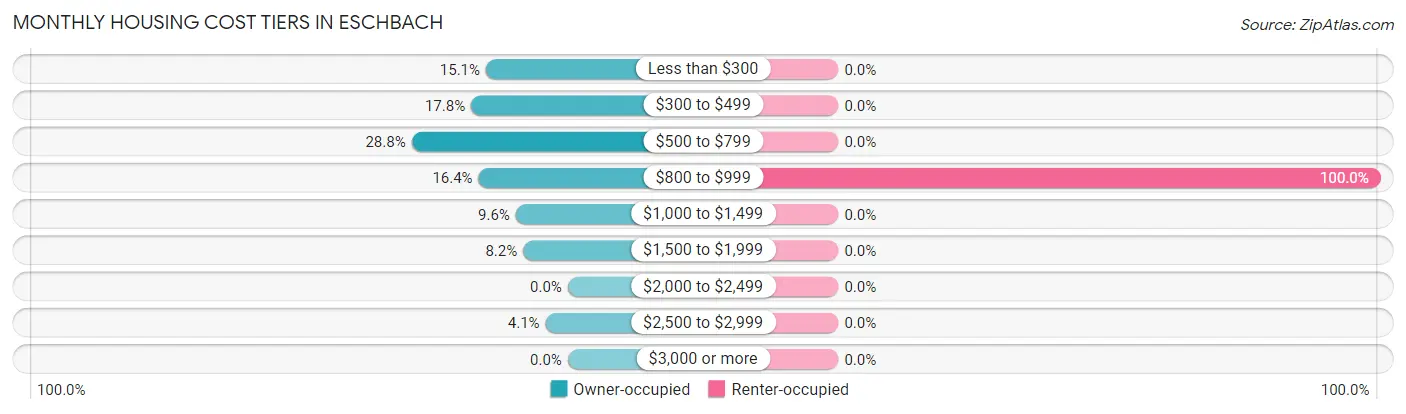
| Monthly Cost | Owner-occupied | Renter-occupied |
| Less than $300 | 11 (15.1%) | 0 (0.0%) |
| $300 to $499 | 13 (17.8%) | 0 (0.0%) |
| $500 to $799 | 21 (28.8%) | 0 (0.0%) |
| $800 to $999 | 12 (16.4%) | 14 (100.0%) |
| $1,000 to $1,499 | 7 (9.6%) | 0 (0.0%) |
| $1,500 to $1,999 | 6 (8.2%) | 0 (0.0%) |
| $2,000 to $2,499 | 0 (0.0%) | 0 (0.0%) |
| $2,500 to $2,999 | 3 (4.1%) | 0 (0.0%) |
| $3,000 or more | 0 (0.0%) | 0 (0.0%) |
| Total | 73 (100.0%) | 14 (100.0%) |
Physical Housing Characteristics in Eschbach
Housing Structures in Eschbach
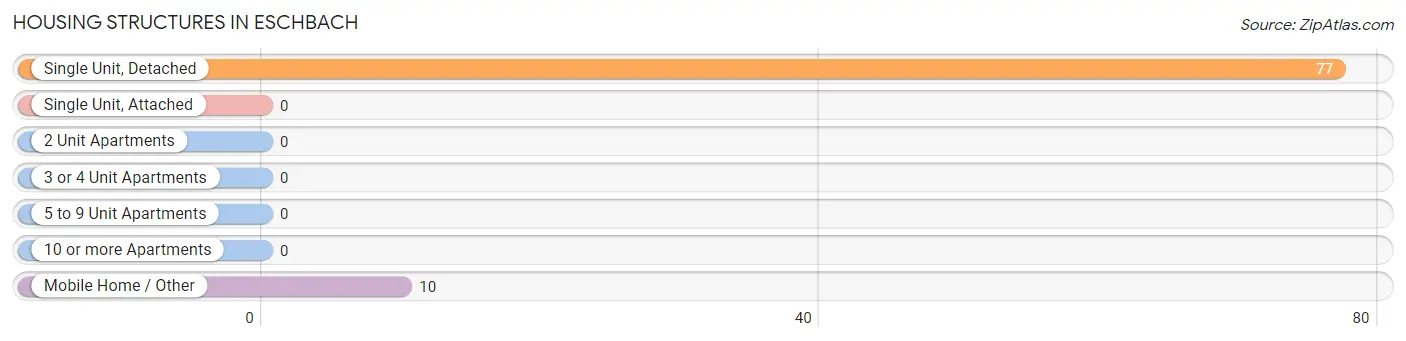
| Structure Type | # Housing Units | % Housing Units |
| Single Unit, Detached | 77 | 88.5% |
| Single Unit, Attached | 0 | 0.0% |
| 2 Unit Apartments | 0 | 0.0% |
| 3 or 4 Unit Apartments | 0 | 0.0% |
| 5 to 9 Unit Apartments | 0 | 0.0% |
| 10 or more Apartments | 0 | 0.0% |
| Mobile Home / Other | 10 | 11.5% |
| Total | 87 | 100.0% |
Housing Structures by Occupancy in Eschbach
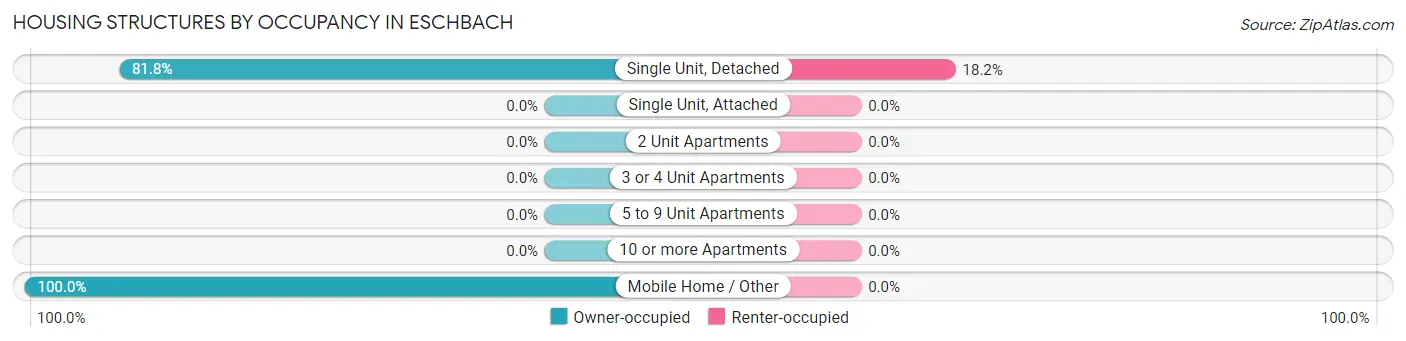
| Structure Type | Owner-occupied | Renter-occupied |
| Single Unit, Detached | 63 (81.8%) | 14 (18.2%) |
| Single Unit, Attached | 0 (0.0%) | 0 (0.0%) |
| 2 Unit Apartments | 0 (0.0%) | 0 (0.0%) |
| 3 or 4 Unit Apartments | 0 (0.0%) | 0 (0.0%) |
| 5 to 9 Unit Apartments | 0 (0.0%) | 0 (0.0%) |
| 10 or more Apartments | 0 (0.0%) | 0 (0.0%) |
| Mobile Home / Other | 10 (100.0%) | 0 (0.0%) |
| Total | 73 (83.9%) | 14 (16.1%) |
Housing Structures by Number of Rooms in Eschbach
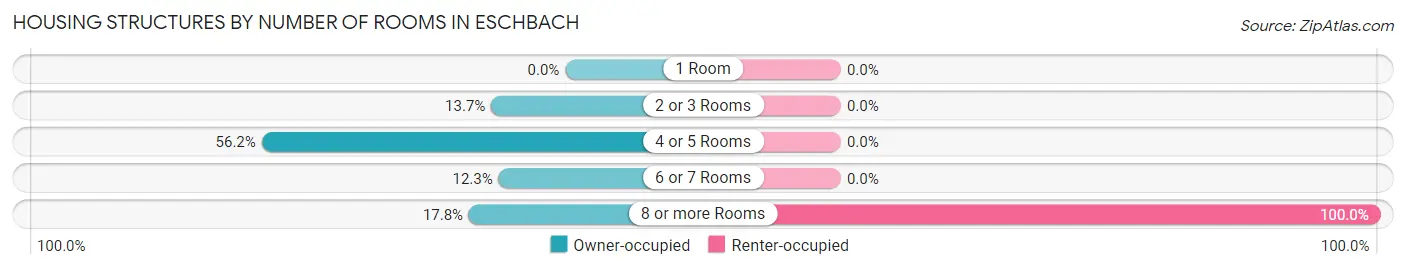
| Number of Rooms | Owner-occupied | Renter-occupied |
| 1 Room | 0 (0.0%) | 0 (0.0%) |
| 2 or 3 Rooms | 10 (13.7%) | 0 (0.0%) |
| 4 or 5 Rooms | 41 (56.2%) | 0 (0.0%) |
| 6 or 7 Rooms | 9 (12.3%) | 0 (0.0%) |
| 8 or more Rooms | 13 (17.8%) | 14 (100.0%) |
| Total | 73 (100.0%) | 14 (100.0%) |
Housing Structure by Heating Type in Eschbach
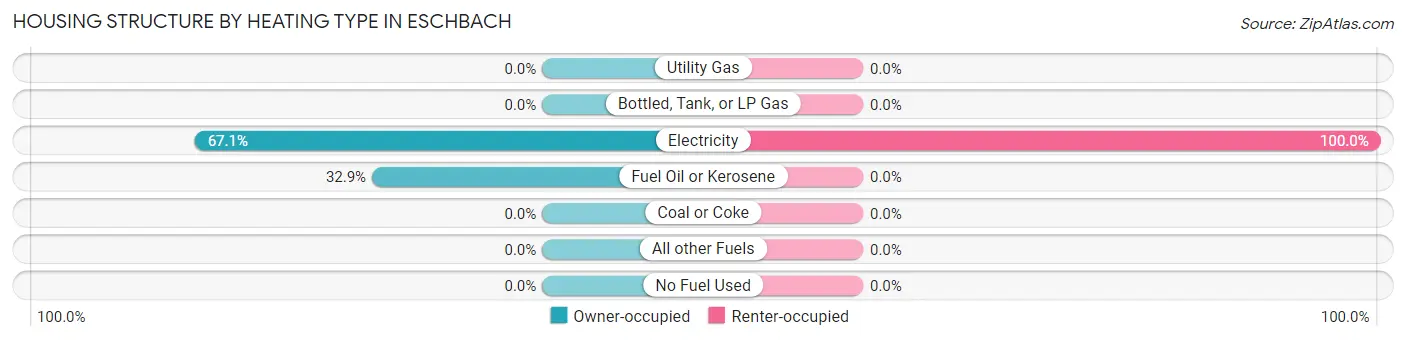
| Heating Type | Owner-occupied | Renter-occupied |
| Utility Gas | 0 (0.0%) | 0 (0.0%) |
| Bottled, Tank, or LP Gas | 0 (0.0%) | 0 (0.0%) |
| Electricity | 49 (67.1%) | 14 (100.0%) |
| Fuel Oil or Kerosene | 24 (32.9%) | 0 (0.0%) |
| Coal or Coke | 0 (0.0%) | 0 (0.0%) |
| All other Fuels | 0 (0.0%) | 0 (0.0%) |
| No Fuel Used | 0 (0.0%) | 0 (0.0%) |
| Total | 73 (100.0%) | 14 (100.0%) |
Household Vehicle Usage in Eschbach
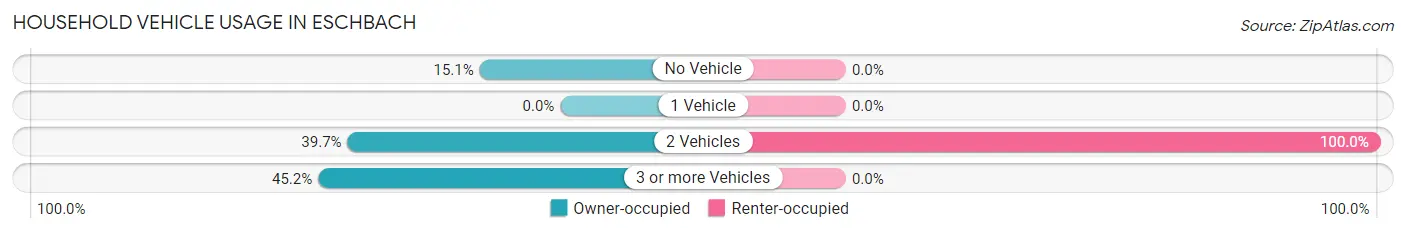
| Vehicles per Household | Owner-occupied | Renter-occupied |
| No Vehicle | 11 (15.1%) | 0 (0.0%) |
| 1 Vehicle | 0 (0.0%) | 0 (0.0%) |
| 2 Vehicles | 29 (39.7%) | 14 (100.0%) |
| 3 or more Vehicles | 33 (45.2%) | 0 (0.0%) |
| Total | 73 (100.0%) | 14 (100.0%) |
Real Estate & Mortgages in Eschbach
Real Estate and Mortgage Overview in Eschbach
| Characteristic | Without Mortgage | With Mortgage |
| Housing Units | 35 | 38 |
| Median Property Value | $350,000 | $0 |
| Median Household Income | - | - |
| Monthly Housing Costs | $375 | $0 |
| Real Estate Taxes | - | - |
Property Value by Mortgage Status in Eschbach
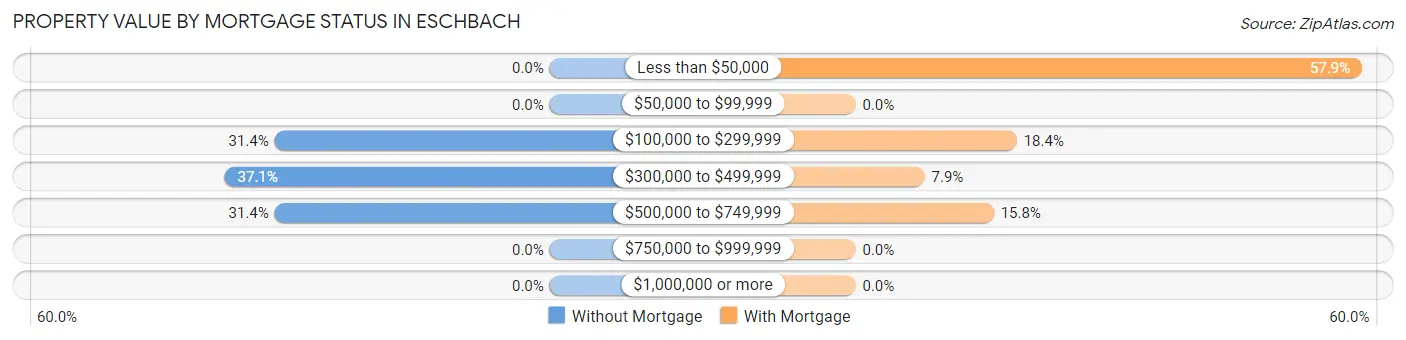
| Property Value | Without Mortgage | With Mortgage |
| Less than $50,000 | 0 (0.0%) | 22 (57.9%) |
| $50,000 to $99,999 | 0 (0.0%) | 0 (0.0%) |
| $100,000 to $299,999 | 11 (31.4%) | 7 (18.4%) |
| $300,000 to $499,999 | 13 (37.1%) | 3 (7.9%) |
| $500,000 to $749,999 | 11 (31.4%) | 6 (15.8%) |
| $750,000 to $999,999 | 0 (0.0%) | 0 (0.0%) |
| $1,000,000 or more | 0 (0.0%) | 0 (0.0%) |
| Total | 35 (100.0%) | 38 (100.0%) |
Household Income by Mortgage Status in Eschbach
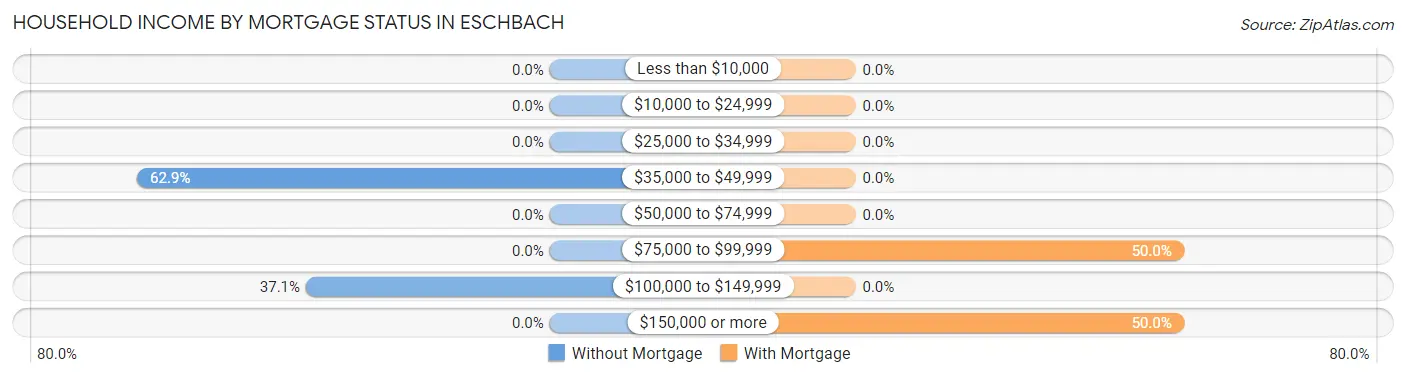
| Household Income | Without Mortgage | With Mortgage |
| Less than $10,000 | 0 (0.0%) | 0 (0.0%) |
| $10,000 to $24,999 | 0 (0.0%) | 0 (0.0%) |
| $25,000 to $34,999 | 0 (0.0%) | 0 (0.0%) |
| $35,000 to $49,999 | 22 (62.9%) | 0 (0.0%) |
| $50,000 to $74,999 | 0 (0.0%) | 0 (0.0%) |
| $75,000 to $99,999 | 0 (0.0%) | 19 (50.0%) |
| $100,000 to $149,999 | 13 (37.1%) | 0 (0.0%) |
| $150,000 or more | 0 (0.0%) | 19 (50.0%) |
| Total | 35 (100.0%) | 38 (100.0%) |
Property Value to Household Income Ratio in Eschbach
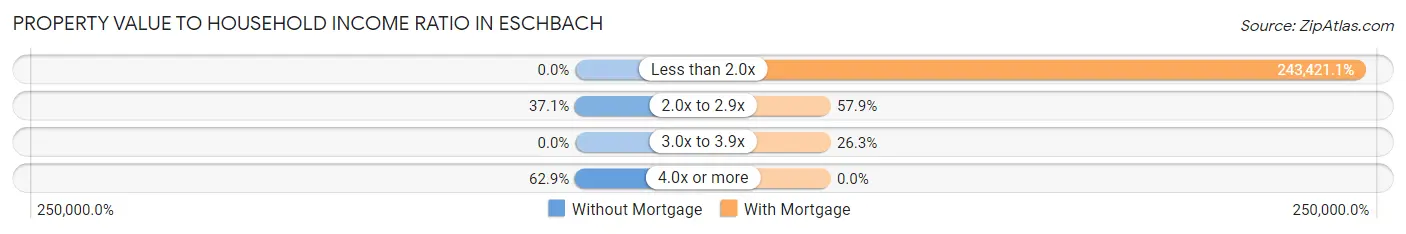
| Value-to-Income Ratio | Without Mortgage | With Mortgage |
| Less than 2.0x | 0 (0.0%) | 92,500 (243,421.1%) |
| 2.0x to 2.9x | 13 (37.1%) | 22 (57.9%) |
| 3.0x to 3.9x | 0 (0.0%) | 10 (26.3%) |
| 4.0x or more | 22 (62.9%) | 0 (0.0%) |
| Total | 35 (100.0%) | 38 (100.0%) |
Real Estate Taxes by Mortgage Status in Eschbach
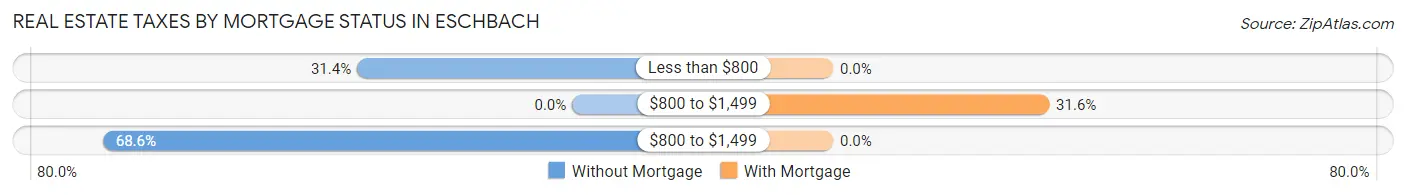
| Property Taxes | Without Mortgage | With Mortgage |
| Less than $800 | 11 (31.4%) | 0 (0.0%) |
| $800 to $1,499 | 0 (0.0%) | 12 (31.6%) |
| $800 to $1,499 | 24 (68.6%) | 0 (0.0%) |
| Total | 35 (100.0%) | 38 (100.0%) |
Health & Disability in Eschbach
Health Insurance Coverage by Age in Eschbach
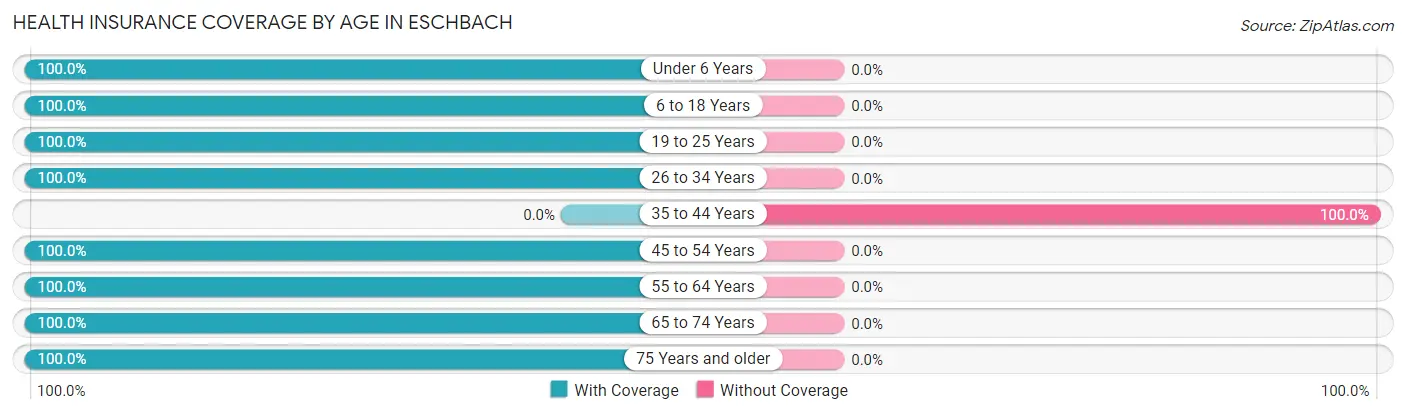
| Age Bracket | With Coverage | Without Coverage |
| Under 6 Years | 11 (100.0%) | 0 (0.0%) |
| 6 to 18 Years | 9 (100.0%) | 0 (0.0%) |
| 19 to 25 Years | 54 (100.0%) | 0 (0.0%) |
| 26 to 34 Years | 23 (100.0%) | 0 (0.0%) |
| 35 to 44 Years | 0 (0.0%) | 17 (100.0%) |
| 45 to 54 Years | 6 (100.0%) | 0 (0.0%) |
| 55 to 64 Years | 39 (100.0%) | 0 (0.0%) |
| 65 to 74 Years | 39 (100.0%) | 0 (0.0%) |
| 75 Years and older | 11 (100.0%) | 0 (0.0%) |
| Total | 192 (91.9%) | 17 (8.1%) |
Health Insurance Coverage by Citizenship Status in Eschbach
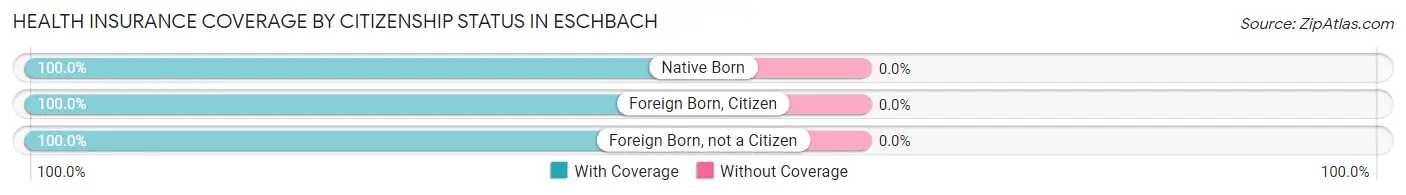
| Citizenship Status | With Coverage | Without Coverage |
| Native Born | 11 (100.0%) | 0 (0.0%) |
| Foreign Born, Citizen | 9 (100.0%) | 0 (0.0%) |
| Foreign Born, not a Citizen | 54 (100.0%) | 0 (0.0%) |
Health Insurance Coverage by Household Income in Eschbach
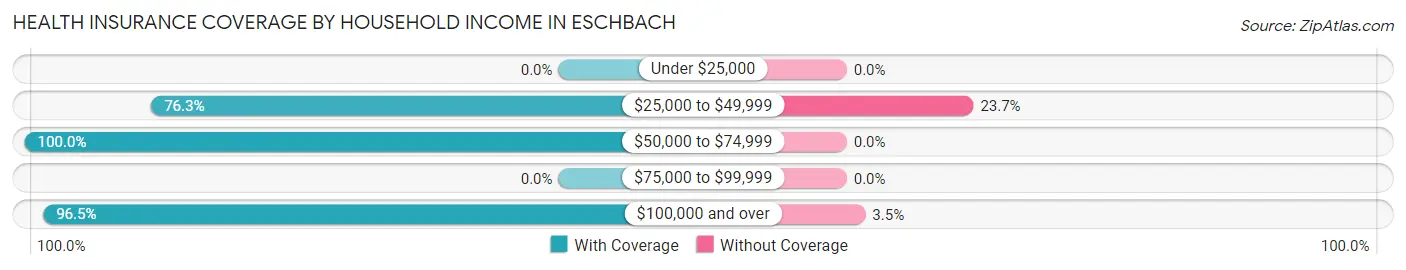
| Household Income | With Coverage | Without Coverage |
| Under $25,000 | 0 (0.0%) | 0 (0.0%) |
| $25,000 to $49,999 | 45 (76.3%) | 14 (23.7%) |
| $50,000 to $74,999 | 64 (100.0%) | 0 (0.0%) |
| $75,000 to $99,999 | 0 (0.0%) | 0 (0.0%) |
| $100,000 and over | 83 (96.5%) | 3 (3.5%) |
Public vs Private Health Insurance Coverage by Age in Eschbach
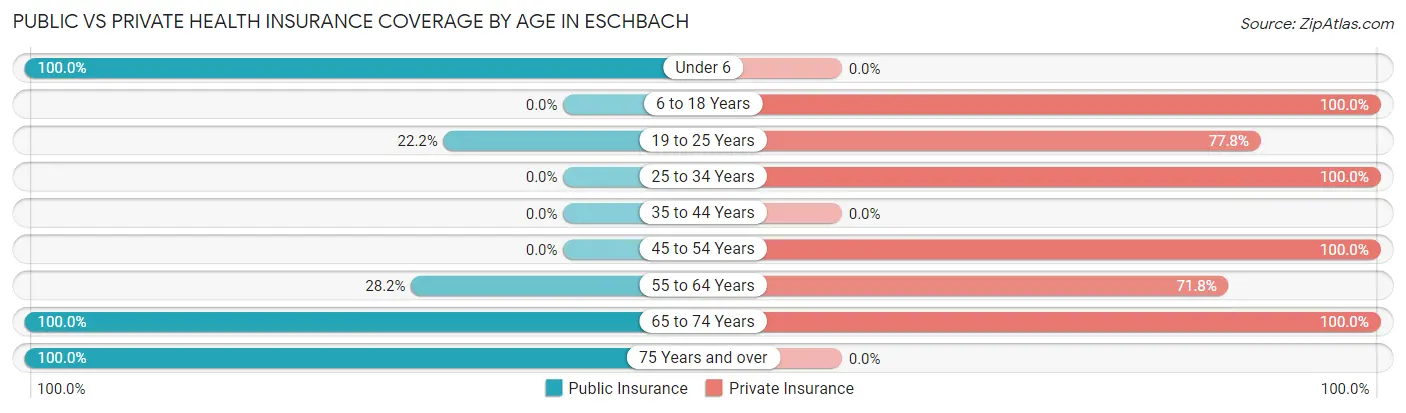
| Age Bracket | Public Insurance | Private Insurance |
| Under 6 | 11 (100.0%) | 0 (0.0%) |
| 6 to 18 Years | 0 (0.0%) | 9 (100.0%) |
| 19 to 25 Years | 12 (22.2%) | 42 (77.8%) |
| 25 to 34 Years | 0 (0.0%) | 23 (100.0%) |
| 35 to 44 Years | 0 (0.0%) | 0 (0.0%) |
| 45 to 54 Years | 0 (0.0%) | 6 (100.0%) |
| 55 to 64 Years | 11 (28.2%) | 28 (71.8%) |
| 65 to 74 Years | 39 (100.0%) | 39 (100.0%) |
| 75 Years and over | 11 (100.0%) | 0 (0.0%) |
| Total | 84 (40.2%) | 147 (70.3%) |
Disability Status by Sex by Age in Eschbach
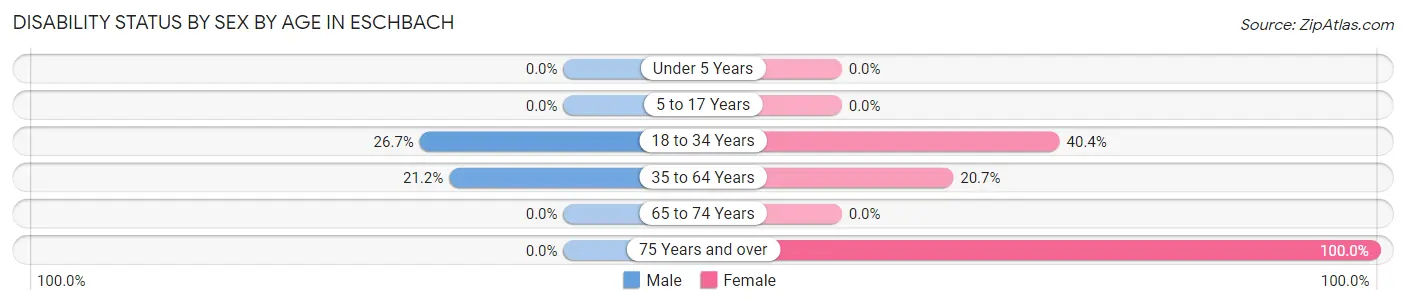
| Age Bracket | Male | Female |
| Under 5 Years | 0 (0.0%) | 0 (0.0%) |
| 5 to 17 Years | 0 (0.0%) | 0 (0.0%) |
| 18 to 34 Years | 8 (26.7%) | 19 (40.4%) |
| 35 to 64 Years | 7 (21.2%) | 6 (20.7%) |
| 65 to 74 Years | 0 (0.0%) | 0 (0.0%) |
| 75 Years and over | 0 (0.0%) | 11 (100.0%) |
Disability Class by Sex by Age in Eschbach
Disability Class: Hearing Difficulty
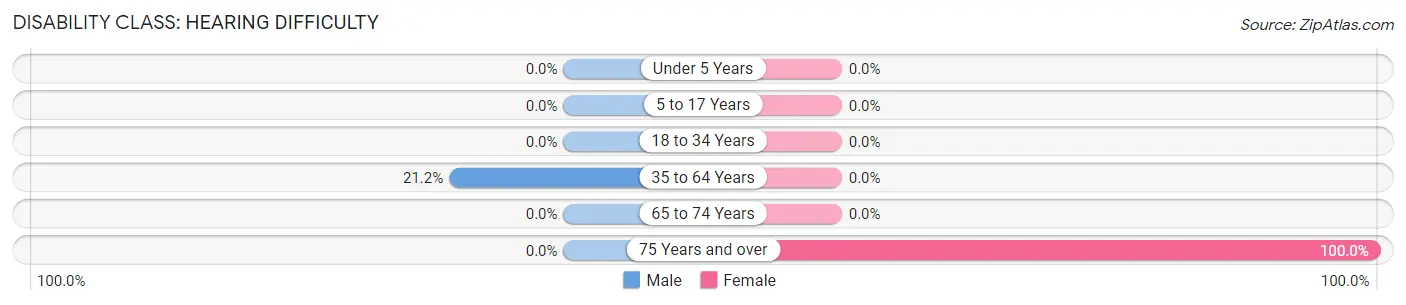
| Age Bracket | Male | Female |
| Under 5 Years | 0 (0.0%) | 0 (0.0%) |
| 5 to 17 Years | 0 (0.0%) | 0 (0.0%) |
| 18 to 34 Years | 0 (0.0%) | 0 (0.0%) |
| 35 to 64 Years | 7 (21.2%) | 0 (0.0%) |
| 65 to 74 Years | 0 (0.0%) | 0 (0.0%) |
| 75 Years and over | 0 (0.0%) | 11 (100.0%) |
Disability Class: Vision Difficulty
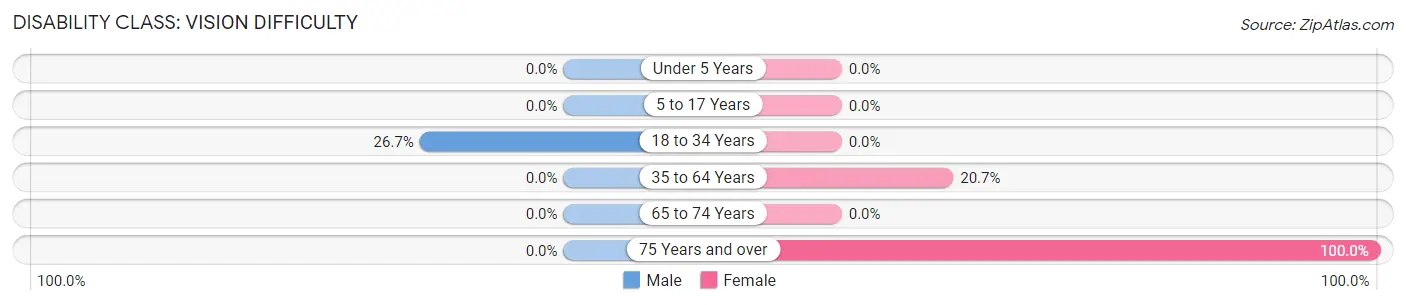
| Age Bracket | Male | Female |
| Under 5 Years | 0 (0.0%) | 0 (0.0%) |
| 5 to 17 Years | 0 (0.0%) | 0 (0.0%) |
| 18 to 34 Years | 8 (26.7%) | 0 (0.0%) |
| 35 to 64 Years | 0 (0.0%) | 6 (20.7%) |
| 65 to 74 Years | 0 (0.0%) | 0 (0.0%) |
| 75 Years and over | 0 (0.0%) | 11 (100.0%) |
Disability Class: Cognitive Difficulty
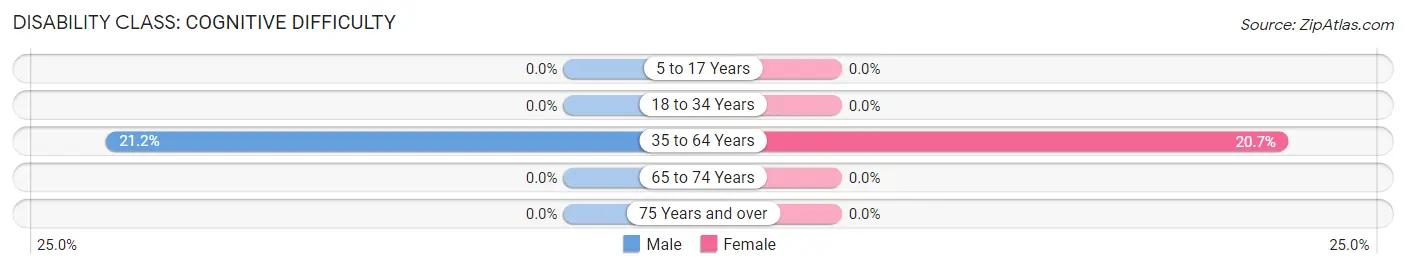
| Age Bracket | Male | Female |
| 5 to 17 Years | 0 (0.0%) | 0 (0.0%) |
| 18 to 34 Years | 0 (0.0%) | 0 (0.0%) |
| 35 to 64 Years | 7 (21.2%) | 6 (20.7%) |
| 65 to 74 Years | 0 (0.0%) | 0 (0.0%) |
| 75 Years and over | 0 (0.0%) | 0 (0.0%) |
Disability Class: Ambulatory Difficulty
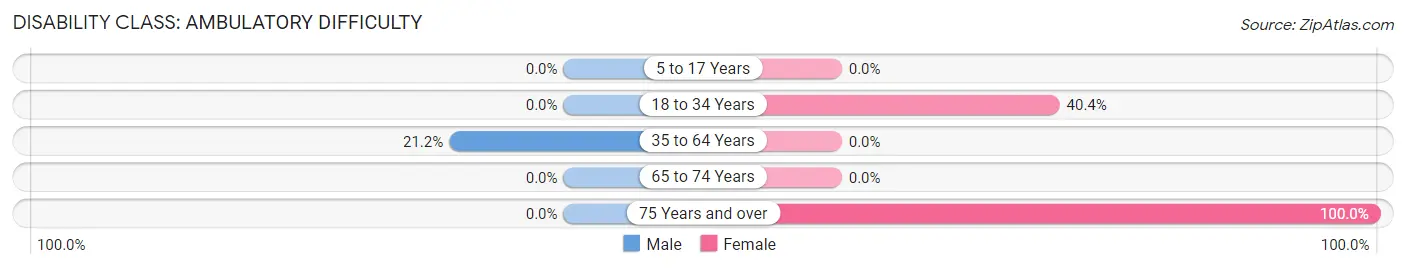
| Age Bracket | Male | Female |
| 5 to 17 Years | 0 (0.0%) | 0 (0.0%) |
| 18 to 34 Years | 0 (0.0%) | 19 (40.4%) |
| 35 to 64 Years | 7 (21.2%) | 0 (0.0%) |
| 65 to 74 Years | 0 (0.0%) | 0 (0.0%) |
| 75 Years and over | 0 (0.0%) | 11 (100.0%) |
Disability Class: Self-Care Difficulty
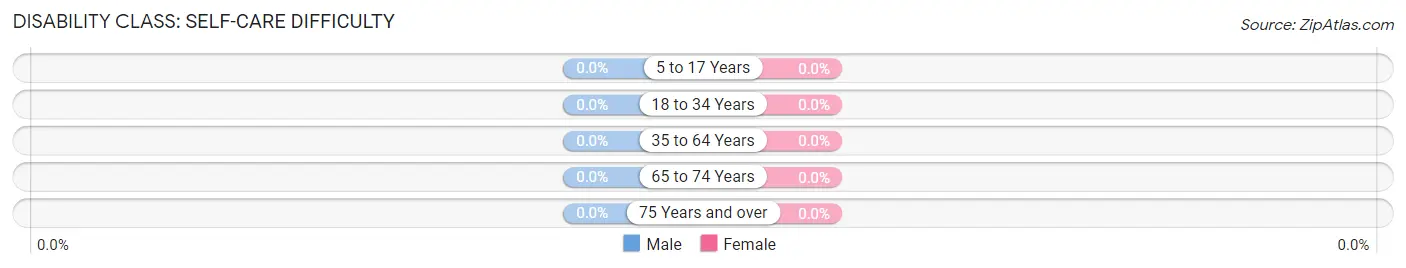
| Age Bracket | Male | Female |
| 5 to 17 Years | 0 (0.0%) | 0 (0.0%) |
| 18 to 34 Years | 0 (0.0%) | 0 (0.0%) |
| 35 to 64 Years | 0 (0.0%) | 0 (0.0%) |
| 65 to 74 Years | 0 (0.0%) | 0 (0.0%) |
| 75 Years and over | 0 (0.0%) | 0 (0.0%) |
Technology Access in Eschbach
Computing Device Access in Eschbach
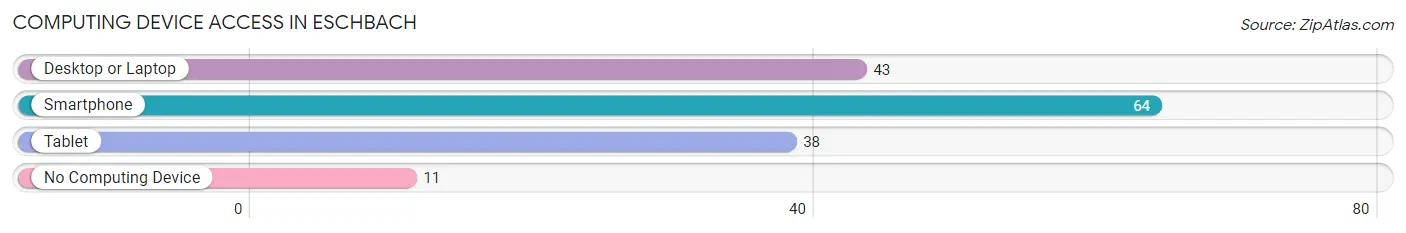
| Device Type | # Households | % Households |
| Desktop or Laptop | 43 | 49.4% |
| Smartphone | 64 | 73.6% |
| Tablet | 38 | 43.7% |
| No Computing Device | 11 | 12.6% |
| Total | 87 | 100.0% |
Internet Access in Eschbach
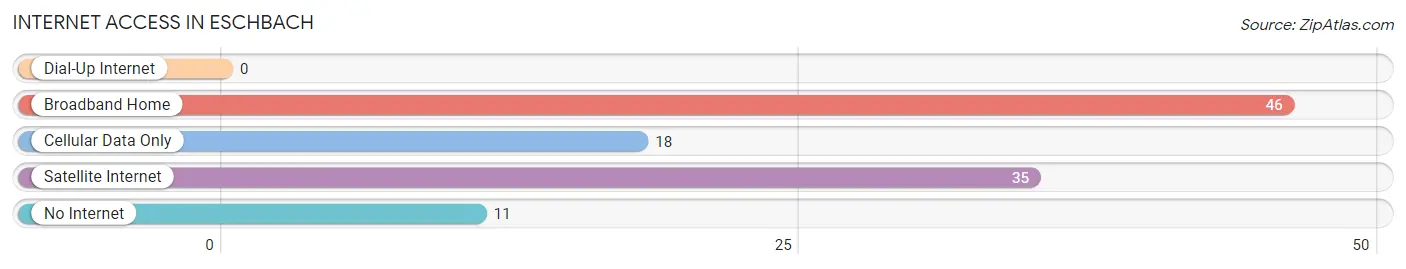
| Internet Type | # Households | % Households |
| Dial-Up Internet | 0 | 0.0% |
| Broadband Home | 46 | 52.9% |
| Cellular Data Only | 18 | 20.7% |
| Satellite Internet | 35 | 40.2% |
| No Internet | 11 | 12.6% |
| Total | 87 | 100.0% |
Eschbach Summary
Eschbach is a small village located in the state of Washington, United States. It is situated in the foothills of the Cascade Mountains, about 25 miles east of Seattle. The village has a population of about 500 people and is part of the King County area.
Geography
Eschbach is located in the foothills of the Cascade Mountains, about 25 miles east of Seattle. The village is situated in a valley surrounded by hills and mountains. The terrain is mostly flat, with some rolling hills. The climate is mild, with temperatures ranging from the mid-30s in the winter to the mid-80s in the summer. The area receives an average of 40 inches of rain per year.
Economy
Eschbach is a small, rural village with a limited economy. The main industries are agriculture and forestry. The village is home to several small farms, which produce a variety of crops, including apples, cherries, and vegetables. The area is also home to several logging companies, which harvest timber from the surrounding forests.
Demographics
As of the 2010 census, the population of Eschbach was 498. The population is predominantly white (94.2%), with a small minority of African Americans (2.2%) and Asians (1.2%). The median household income is $50,000, and the median age is 44.
The village is home to a variety of religious denominations, including Catholic, Lutheran, and Methodist. The village is served by two schools, a public elementary school and a private Christian school.
Conclusion
Eschbach is a small village located in the foothills of the Cascade Mountains, about 25 miles east of Seattle. The village has a population of about 500 people and is part of the King County area. The main industries are agriculture and forestry, and the population is predominantly white. The village is home to a variety of religious denominations, and is served by two schools. Eschbach is a small, rural village with a limited economy, but it is a peaceful and pleasant place to live.
Common Questions
What is Per Capita Income in Eschbach?
Per Capita income in Eschbach is $29,163.
What is the Median Family Income in Eschbach?
Median Family Income in Eschbach is $110,250.
What is the Median Household income in Eschbach?
Median Household Income in Eschbach is $54,063.
What is Income or Wage Gap in Eschbach?
Income or Wage Gap in Eschbach is 0.5%.
Women in Eschbach earn 99.5 cents for every dollar earned by a man.
What is Inequality or Gini Index in Eschbach?
Inequality or Gini Index in Eschbach is 0.29.
What is the Total Population of Eschbach?
Total Population of Eschbach is 209.
What is the Total Male Population of Eschbach?
Total Male Population of Eschbach is 96.
What is the Total Female Population of Eschbach?
Total Female Population of Eschbach is 113.
What is the Ratio of Males per 100 Females in Eschbach?
There are 84.96 Males per 100 Females in Eschbach.
What is the Ratio of Females per 100 Males in Eschbach?
There are 117.71 Females per 100 Males in Eschbach.
What is the Median Population Age in Eschbach?
Median Population Age in Eschbach is 35.5 Years.
What is the Average Family Size in Eschbach
Average Family Size in Eschbach is 3.0 People.
What is the Average Household Size in Eschbach
Average Household Size in Eschbach is 2.4 People.
How Large is the Labor Force in Eschbach?
There are 149 People in the Labor Forcein in Eschbach.
What is the Percentage of People in the Labor Force in Eschbach?
78.8% of People are in the Labor Force in Eschbach.
What is the Unemployment Rate in Eschbach?
Unemployment Rate in Eschbach is 12.8%.