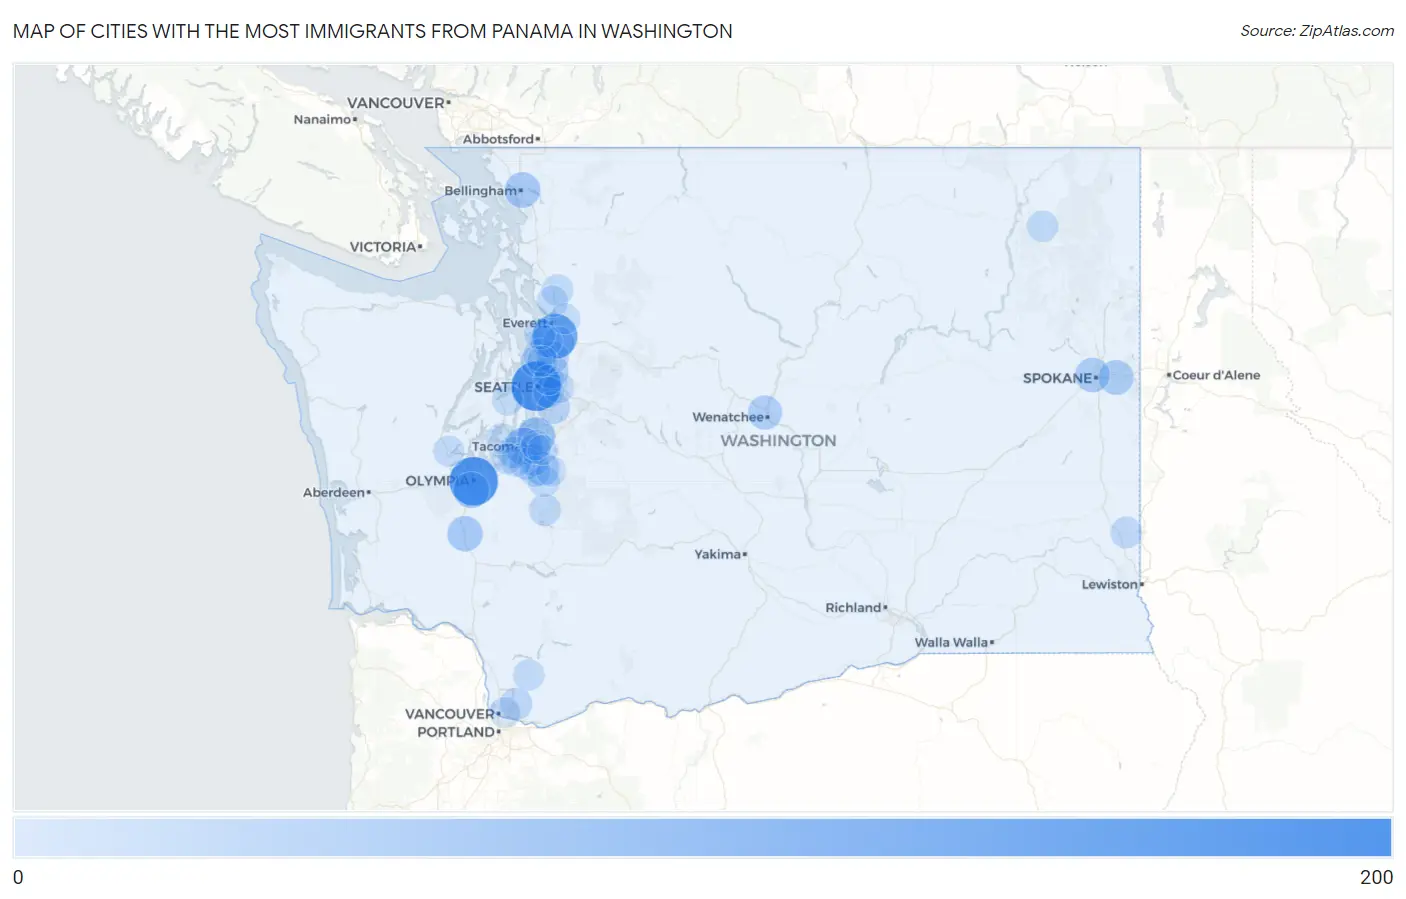
Cities with the Most Immigrants from Panama in Washington
RELATED REPORTS & OPTIONS
Panama
Washington
Compare Cities
Map of Cities with the Most Immigrants from Panama in Washington
0
200
Cities with the Most Immigrants from Panama in Washington
| City | Panama | vs State | vs National | |
| 1. | Seattle | 170 | 1,444(11.77%)#1 | 105,274(0.16%)#74 |
| 2. | Olympia | 161 | 1,444(11.15%)#2 | 105,274(0.15%)#84 |
| 3. | Eastmont | 127 | 1,444(8.80%)#3 | 105,274(0.12%)#118 |
| 4. | Federal Way | 65 | 1,444(4.50%)#4 | 105,274(0.06%)#284 |
| 5. | Tacoma | 61 | 1,444(4.22%)#5 | 105,274(0.06%)#306 |
| 6. | Tumwater | 51 | 1,444(3.53%)#6 | 105,274(0.05%)#372 |
| 7. | Bellingham | 46 | 1,444(3.19%)#7 | 105,274(0.04%)#415 |
| 8. | Centralia | 44 | 1,444(3.05%)#8 | 105,274(0.04%)#440 |
| 9. | Spokane Valley | 41 | 1,444(2.84%)#9 | 105,274(0.04%)#452 |
| 10. | Spokane | 39 | 1,444(2.70%)#10 | 105,274(0.04%)#473 |
| 11. | Kirkland | 38 | 1,444(2.63%)#11 | 105,274(0.04%)#481 |
| 12. | Wenatchee | 35 | 1,444(2.42%)#12 | 105,274(0.03%)#516 |
| 13. | South Hill | 31 | 1,444(2.15%)#13 | 105,274(0.03%)#559 |
| 14. | Renton | 22 | 1,444(1.52%)#14 | 105,274(0.02%)#757 |
| 15. | Bothell | 22 | 1,444(1.52%)#15 | 105,274(0.02%)#760 |
| 16. | Mountlake Terrace | 22 | 1,444(1.52%)#16 | 105,274(0.02%)#763 |
| 17. | Orchards | 17 | 1,444(1.18%)#17 | 105,274(0.02%)#897 |
| 18. | Fairwood Cdp Spokane County | 17 | 1,444(1.18%)#18 | 105,274(0.02%)#912 |
| 19. | Parkland | 16 | 1,444(1.11%)#19 | 105,274(0.02%)#930 |
| 20. | Silver Firs | 16 | 1,444(1.11%)#20 | 105,274(0.02%)#936 |
| 21. | Lake Stickney | 15 | 1,444(1.04%)#21 | 105,274(0.01%)#969 |
| 22. | University Place | 14 | 1,444(0.97%)#22 | 105,274(0.01%)#993 |
| 23. | Pullman | 14 | 1,444(0.97%)#23 | 105,274(0.01%)#997 |
| 24. | Eatonville | 14 | 1,444(0.97%)#24 | 105,274(0.01%)#1,016 |
| 25. | Graham | 12 | 1,444(0.83%)#25 | 105,274(0.01%)#1,082 |
| 26. | Arlington | 12 | 1,444(0.83%)#26 | 105,274(0.01%)#1,089 |
| 27. | Bellevue | 11 | 1,444(0.76%)#27 | 105,274(0.01%)#1,118 |
| 28. | Summit | 11 | 1,444(0.76%)#28 | 105,274(0.01%)#1,149 |
| 29. | Yacolt | 11 | 1,444(0.76%)#29 | 105,274(0.01%)#1,157 |
| 30. | Marysville | 10 | 1,444(0.69%)#30 | 105,274(0.01%)#1,169 |
| 31. | Shoreline | 10 | 1,444(0.69%)#31 | 105,274(0.01%)#1,172 |
| 32. | Frederickson | 10 | 1,444(0.69%)#32 | 105,274(0.01%)#1,183 |
| 33. | Mukilteo | 10 | 1,444(0.69%)#33 | 105,274(0.01%)#1,186 |
| 34. | Shelton | 10 | 1,444(0.69%)#34 | 105,274(0.01%)#1,195 |
| 35. | Parkwood | 10 | 1,444(0.69%)#35 | 105,274(0.01%)#1,197 |
| 36. | Colville | 10 | 1,444(0.69%)#36 | 105,274(0.01%)#1,200 |
| 37. | Lakewood | 8 | 1,444(0.55%)#37 | 105,274(0.01%)#1,255 |
| 38. | Mercer Island | 8 | 1,444(0.55%)#38 | 105,274(0.01%)#1,277 |
| 39. | Vancouver | 7 | 1,444(0.48%)#39 | 105,274(0.01%)#1,309 |
| 40. | Lake Stevens | 7 | 1,444(0.48%)#40 | 105,274(0.01%)#1,320 |
| 41. | Artondale | 5 | 1,444(0.35%)#41 | 105,274(0.00%)#1,418 |
| 42. | Lake Forest Park | 5 | 1,444(0.35%)#42 | 105,274(0.00%)#1,419 |
| 43. | Fife | 5 | 1,444(0.35%)#43 | 105,274(0.00%)#1,422 |
| 44. | Steilacoom | 5 | 1,444(0.35%)#44 | 105,274(0.00%)#1,424 |
| 45. | Fife Heights | 4 | 1,444(0.28%)#45 | 105,274(0.00%)#1,483 |
| 46. | Orting | 3 | 1,444(0.21%)#46 | 105,274(0.00%)#1,503 |
| 47. | Edgewood | 2 | 1,444(0.14%)#47 | 105,274(0.00%)#1,548 |
| 48. | Hunts Point | 2 | 1,444(0.14%)#48 | 105,274(0.00%)#1,574 |
Common Questions
What are the Top 10 Cities with the Most Immigrants from Panama in Washington?
Top 10 Cities with the Most Immigrants from Panama in Washington are:
#1
170
#2
161
#3
127
#4
65
#5
61
#6
51
#7
46
#8
44
#9
41
#10
39
What city has the Most Immigrants from Panama in Washington?
Seattle has the Most Immigrants from Panama in Washington with 170.
What is the Total Immigrants from Panama in the State of Washington?
Total Immigrants from Panama in Washington is 1,444.
What is the Total Immigrants from Panama in the United States?
Total Immigrants from Panama in the United States is 105,274.