Leavenworth, WA Map & Demographics
Leavenworth Map
Leavenworth Overview
$41,683
PER CAPITA INCOME
$101,208
AVG FAMILY INCOME
$66,042
AVG HOUSEHOLD INCOME
48.6%
WAGE / INCOME GAP [ % ]
51.4¢/ $1
WAGE / INCOME GAP [ $ ]
0.45
INEQUALITY / GINI INDEX
2,619
TOTAL POPULATION
1,295
MALE POPULATION
1,324
FEMALE POPULATION
97.81
MALES / 100 FEMALES
102.24
FEMALES / 100 MALES
40.9
MEDIAN AGE
3.0
AVG FAMILY SIZE
2.3
AVG HOUSEHOLD SIZE
1,313
LABOR FORCE [ PEOPLE ]
61.1%
PERCENT IN LABOR FORCE
0.3%
UNEMPLOYMENT RATE
Leavenworth Zip Codes
Leavenworth Area Codes
Income in Leavenworth
Income Overview in Leavenworth
Per Capita Income in Leavenworth is $41,683, while median incomes of families and households are $101,208 and $66,042 respectively.
| Characteristic | Number | Measure |
| Per Capita Income | 2,619 | $41,683 |
| Median Family Income | 662 | $101,208 |
| Mean Family Income | 662 | $117,477 |
| Median Household Income | 1,154 | $66,042 |
| Mean Household Income | 1,154 | $91,815 |
| Income Deficit | 662 | $0 |
| Wage / Income Gap (%) | 2,619 | 48.57% |
| Wage / Income Gap ($) | 2,619 | 51.43¢ per $1 |
| Gini / Inequality Index | 2,619 | 0.45 |
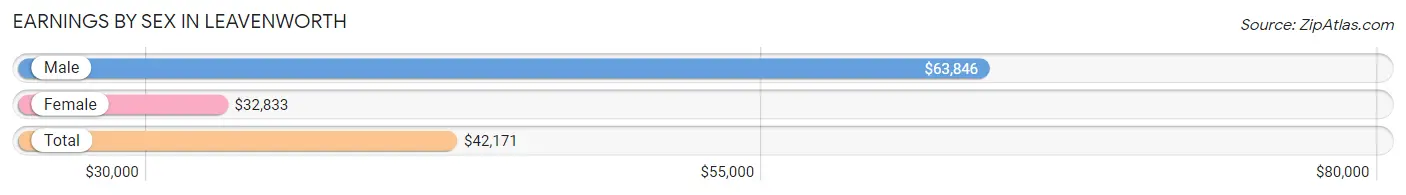
Earnings by Sex in Leavenworth
Average Earnings in Leavenworth are $42,171, $63,846 for men and $32,833 for women, a difference of 48.6%.
| Sex | Number | Average Earnings |
| Male | 798 (53.7%) | $63,846 |
| Female | 688 (46.3%) | $32,833 |
| Total | 1,486 (100.0%) | $42,171 |
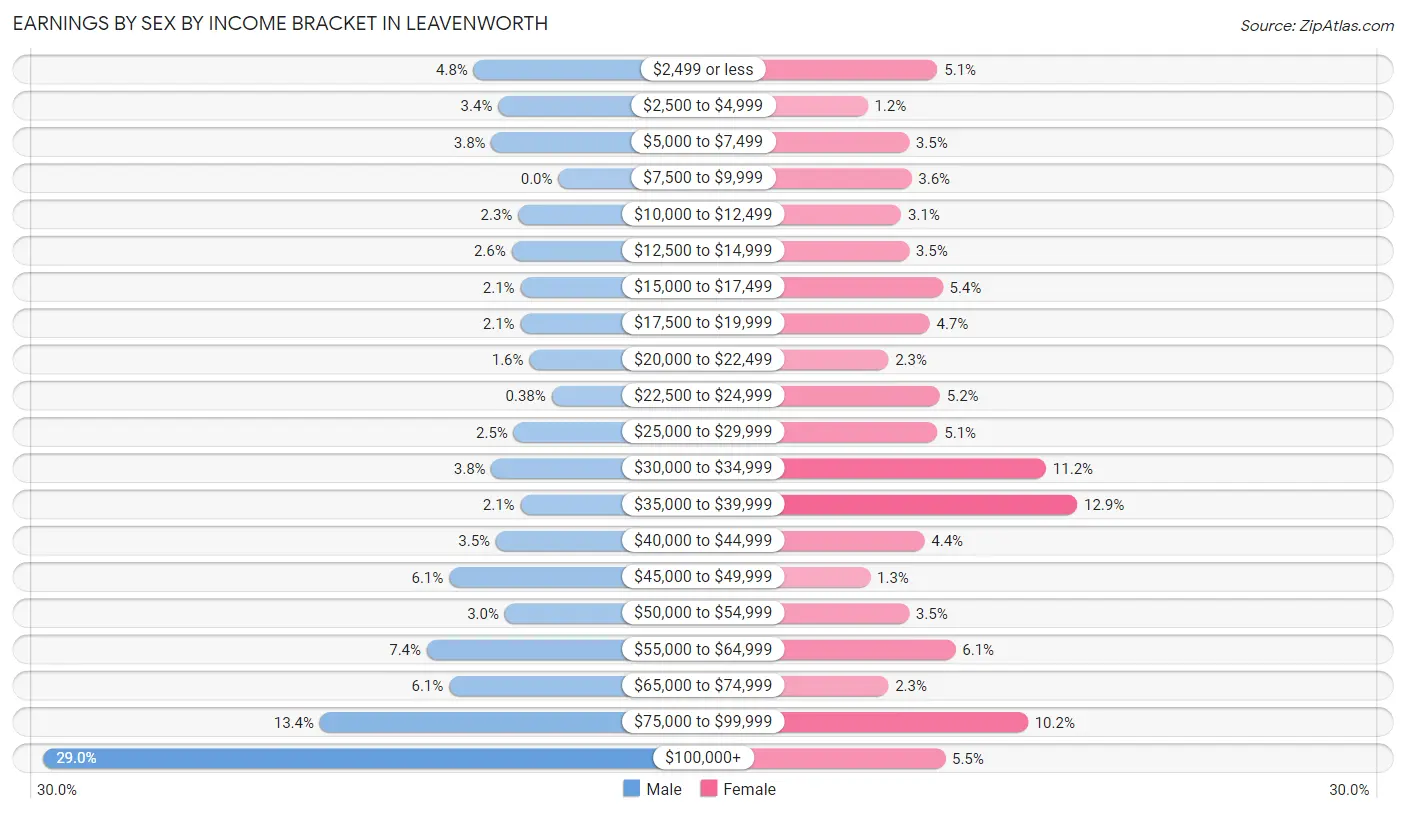
Earnings by Sex by Income Bracket in Leavenworth
The most common earnings brackets in Leavenworth are $100,000+ for men (231 | 28.9%) and $35,000 to $39,999 for women (89 | 12.9%).
| Income | Male | Female |
| $2,499 or less | 38 (4.8%) | 35 (5.1%) |
| $2,500 to $4,999 | 27 (3.4%) | 8 (1.2%) |
| $5,000 to $7,499 | 30 (3.8%) | 24 (3.5%) |
| $7,500 to $9,999 | 0 (0.0%) | 25 (3.6%) |
| $10,000 to $12,499 | 18 (2.3%) | 21 (3.0%) |
| $12,500 to $14,999 | 21 (2.6%) | 24 (3.5%) |
| $15,000 to $17,499 | 17 (2.1%) | 37 (5.4%) |
| $17,500 to $19,999 | 17 (2.1%) | 32 (4.6%) |
| $20,000 to $22,499 | 13 (1.6%) | 16 (2.3%) |
| $22,500 to $24,999 | 3 (0.4%) | 36 (5.2%) |
| $25,000 to $29,999 | 20 (2.5%) | 35 (5.1%) |
| $30,000 to $34,999 | 30 (3.8%) | 77 (11.2%) |
| $35,000 to $39,999 | 17 (2.1%) | 89 (12.9%) |
| $40,000 to $44,999 | 28 (3.5%) | 30 (4.4%) |
| $45,000 to $49,999 | 49 (6.1%) | 9 (1.3%) |
| $50,000 to $54,999 | 24 (3.0%) | 24 (3.5%) |
| $55,000 to $64,999 | 59 (7.4%) | 42 (6.1%) |
| $65,000 to $74,999 | 49 (6.1%) | 16 (2.3%) |
| $75,000 to $99,999 | 107 (13.4%) | 70 (10.2%) |
| $100,000+ | 231 (28.9%) | 38 (5.5%) |
| Total | 798 (100.0%) | 688 (100.0%) |
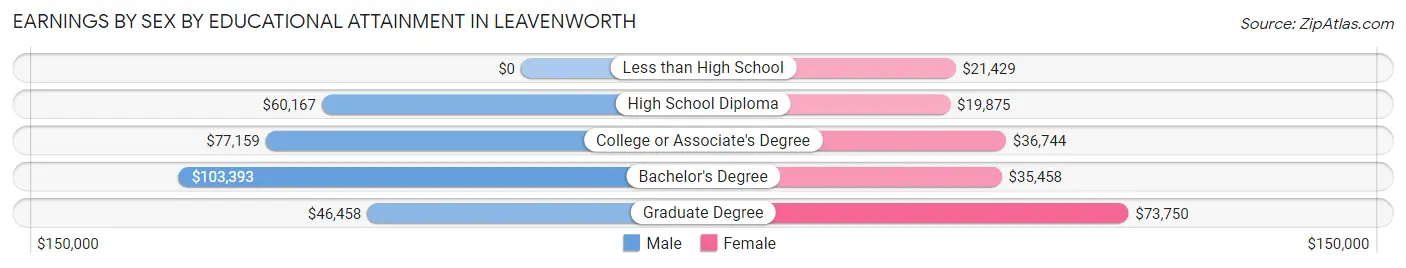
Earnings by Sex by Educational Attainment in Leavenworth
Average earnings in Leavenworth are $69,500 for men and $36,010 for women, a difference of 48.2%. Men with an educational attainment of bachelor's degree enjoy the highest average annual earnings of $103,393, while those with graduate degree education earn the least with $46,458. Women with an educational attainment of graduate degree earn the most with the average annual earnings of $73,750, while those with high school diploma education have the smallest earnings of $19,875.
| Educational Attainment | Male Income | Female Income |
| Less than High School | - | - |
| High School Diploma | $60,167 | $19,875 |
| College or Associate's Degree | $77,159 | $36,744 |
| Bachelor's Degree | $103,393 | $35,458 |
| Graduate Degree | $46,458 | $73,750 |
| Total | $69,500 | $36,010 |
Family Income in Leavenworth
Family Income Brackets in Leavenworth
According to the Leavenworth family income data, there are 209 families falling into the $100,000 to $149,999 income range, which is the most common income bracket and makes up 31.6% of all families.
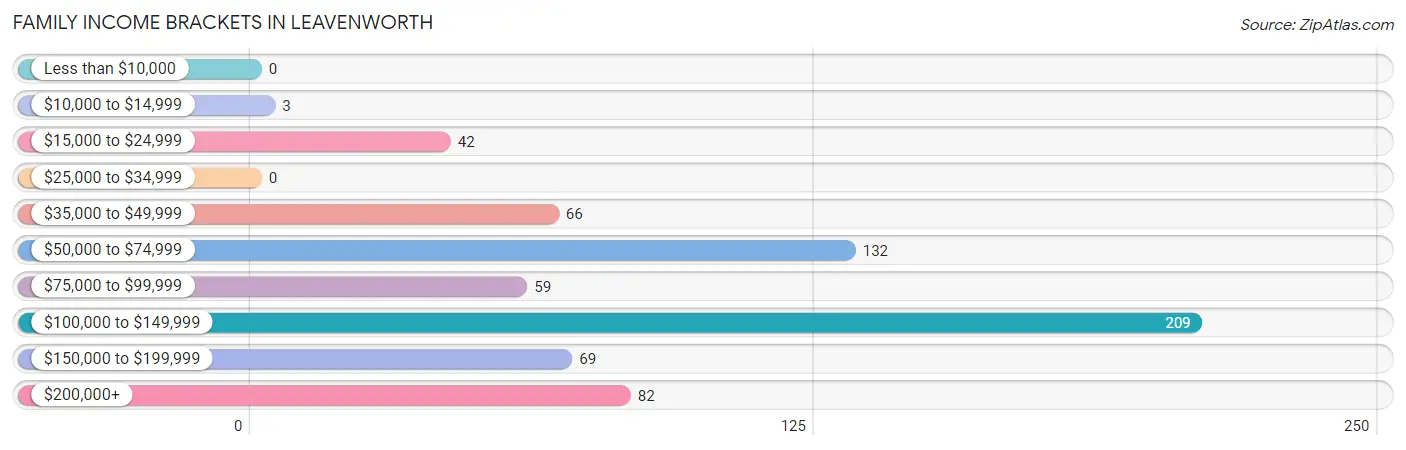
| Income Bracket | # Families | % Families |
| Less than $10,000 | 0 | 0.0% |
| $10,000 to $14,999 | 3 | 0.5% |
| $15,000 to $24,999 | 42 | 6.3% |
| $25,000 to $34,999 | 0 | 0.0% |
| $35,000 to $49,999 | 66 | 10.0% |
| $50,000 to $74,999 | 132 | 19.9% |
| $75,000 to $99,999 | 59 | 8.9% |
| $100,000 to $149,999 | 209 | 31.6% |
| $150,000 to $199,999 | 69 | 10.4% |
| $200,000+ | 82 | 12.4% |
Family Income by Famaliy Size in Leavenworth
4-person families (112 | 16.9%) account for the highest median family income in Leavenworth with $215,061 per family, while 4-person families (112 | 16.9%) have the highest median income of $53,765 per family member.
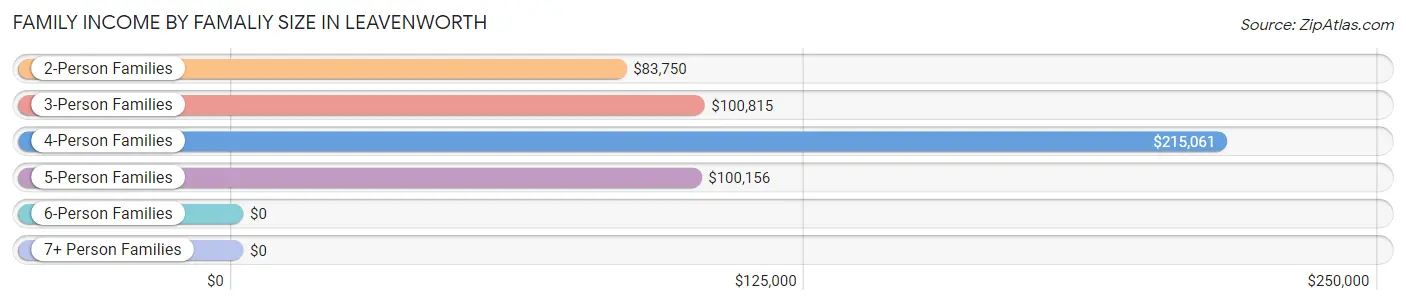
| Income Bracket | # Families | Median Income |
| 2-Person Families | 302 (45.6%) | $83,750 |
| 3-Person Families | 196 (29.6%) | $100,815 |
| 4-Person Families | 112 (16.9%) | $215,061 |
| 5-Person Families | 35 (5.3%) | $100,156 |
| 6-Person Families | 14 (2.1%) | $0 |
| 7+ Person Families | 3 (0.4%) | $0 |
| Total | 662 (100.0%) | $101,208 |
Family Income by Number of Earners in Leavenworth
The median family income in Leavenworth is $101,208, with families comprising 3+ earners (91) having the highest median family income of $157,656, while families with no earners (110) have the lowest median family income of $51,722, accounting for 13.8% and 16.6% of families, respectively.
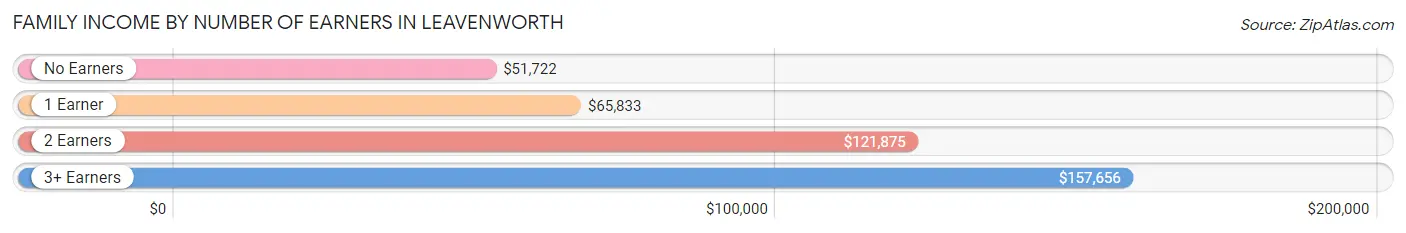
| Number of Earners | # Families | Median Income |
| No Earners | 110 (16.6%) | $51,722 |
| 1 Earner | 150 (22.7%) | $65,833 |
| 2 Earners | 311 (47.0%) | $121,875 |
| 3+ Earners | 91 (13.8%) | $157,656 |
| Total | 662 (100.0%) | $101,208 |
Household Income in Leavenworth
Household Income Brackets in Leavenworth
With 245 households falling in the category, the $100,000 to $149,999 income range is the most frequent in Leavenworth, accounting for 21.2% of all households. In contrast, only 28 households (2.4%) fall into the less than $10,000 income bracket, making it the least populous group.
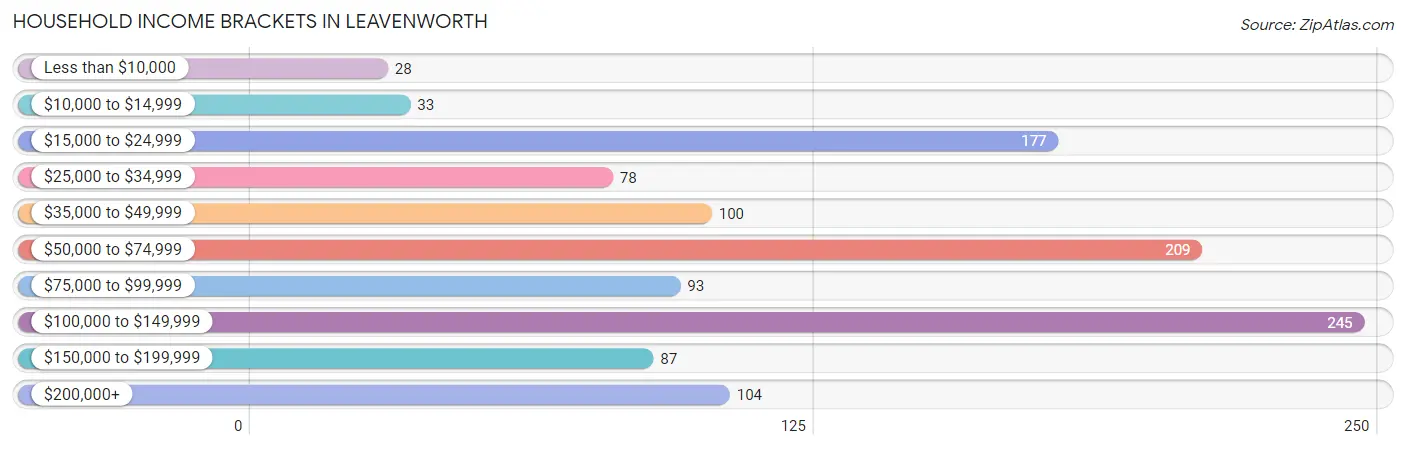
| Income Bracket | # Households | % Households |
| Less than $10,000 | 28 | 2.4% |
| $10,000 to $14,999 | 33 | 2.9% |
| $15,000 to $24,999 | 177 | 15.3% |
| $25,000 to $34,999 | 78 | 6.8% |
| $35,000 to $49,999 | 100 | 8.7% |
| $50,000 to $74,999 | 209 | 18.1% |
| $75,000 to $99,999 | 93 | 8.1% |
| $100,000 to $149,999 | 245 | 21.2% |
| $150,000 to $199,999 | 87 | 7.5% |
| $200,000+ | 104 | 9.0% |
Household Income by Householder Age in Leavenworth
The median household income in Leavenworth is $66,042, with the highest median household income of $102,031 found in the 25 to 44 years age bracket for the primary householder. A total of 355 households (30.8%) fall into this category. Meanwhile, the 15 to 24 years age bracket for the primary householder has the lowest median household income of $0, with 10 households (0.9%) in this group.
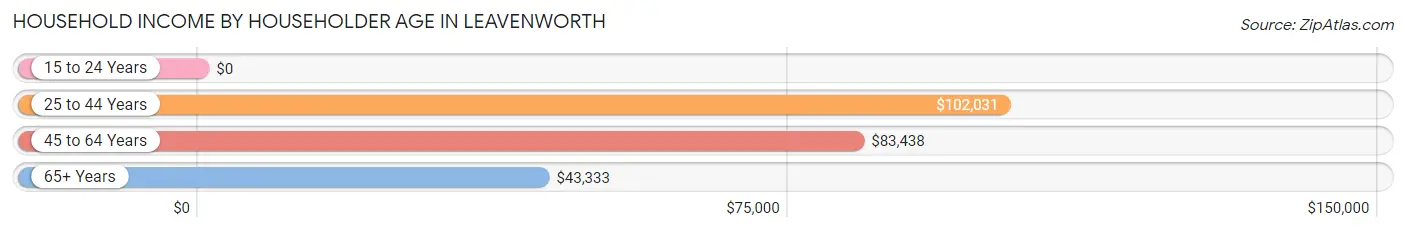
| Income Bracket | # Households | Median Income |
| 15 to 24 Years | 10 (0.9%) | $0 |
| 25 to 44 Years | 355 (30.8%) | $102,031 |
| 45 to 64 Years | 457 (39.6%) | $83,438 |
| 65+ Years | 332 (28.8%) | $43,333 |
| Total | 1,154 (100.0%) | $66,042 |
Poverty in Leavenworth
Income Below Poverty by Sex and Age in Leavenworth
With 3.8% poverty level for males and 8.4% for females among the residents of Leavenworth, under 5 year old males and under 5 year old females are the most vulnerable to poverty, with 6 males (15.4%) and 19 females (22.1%) in their respective age groups living below the poverty level.
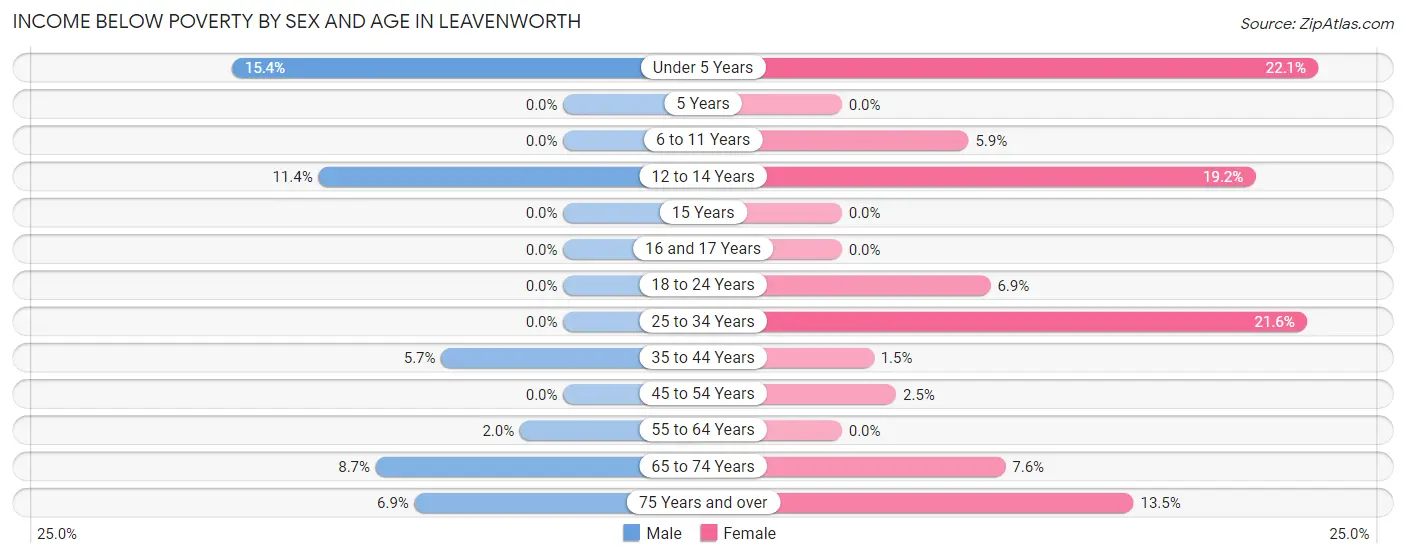
| Age Bracket | Male | Female |
| Under 5 Years | 6 (15.4%) | 19 (22.1%) |
| 5 Years | 0 (0.0%) | 0 (0.0%) |
| 6 to 11 Years | 0 (0.0%) | 5 (5.9%) |
| 12 to 14 Years | 5 (11.4%) | 14 (19.2%) |
| 15 Years | 0 (0.0%) | 0 (0.0%) |
| 16 and 17 Years | 0 (0.0%) | 0 (0.0%) |
| 18 to 24 Years | 0 (0.0%) | 6 (6.9%) |
| 25 to 34 Years | 0 (0.0%) | 33 (21.6%) |
| 35 to 44 Years | 15 (5.7%) | 3 (1.5%) |
| 45 to 54 Years | 0 (0.0%) | 4 (2.5%) |
| 55 to 64 Years | 5 (2.0%) | 0 (0.0%) |
| 65 to 74 Years | 12 (8.7%) | 12 (7.6%) |
| 75 Years and over | 6 (6.9%) | 13 (13.5%) |
| Total | 49 (3.8%) | 109 (8.4%) |
Income Above Poverty by Sex and Age in Leavenworth
According to the poverty statistics in Leavenworth, males aged 5 years and females aged 15 years are the age groups that are most secure financially, with 100.0% of males and 100.0% of females in these age groups living above the poverty line.
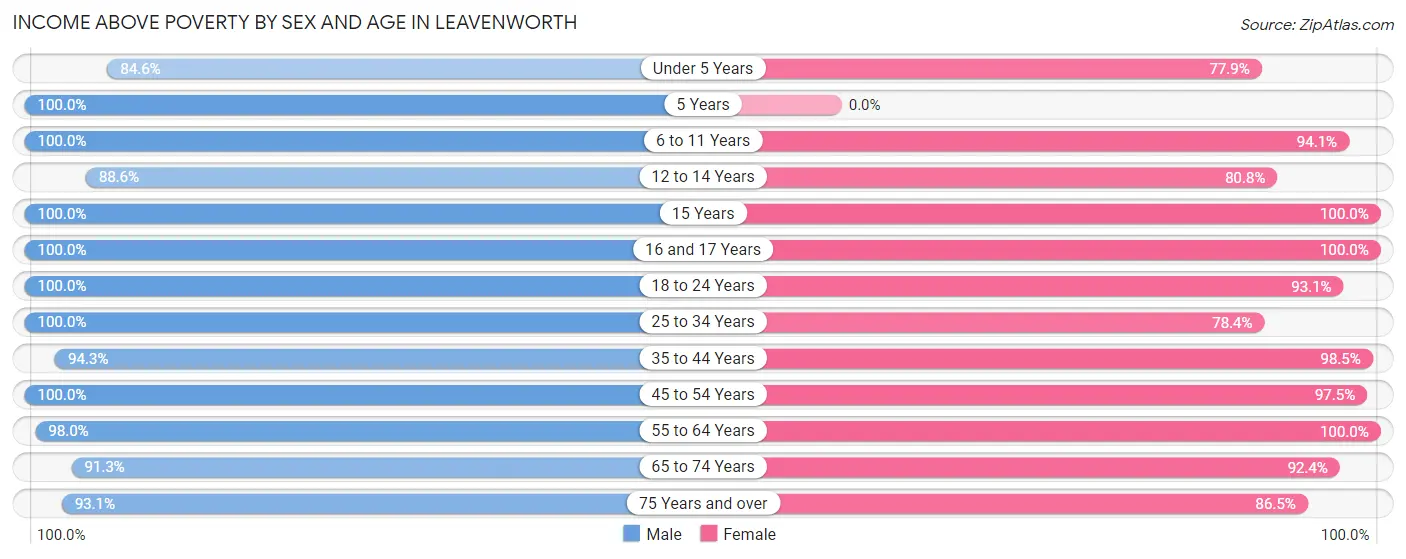
| Age Bracket | Male | Female |
| Under 5 Years | 33 (84.6%) | 67 (77.9%) |
| 5 Years | 54 (100.0%) | 0 (0.0%) |
| 6 to 11 Years | 60 (100.0%) | 80 (94.1%) |
| 12 to 14 Years | 39 (88.6%) | 59 (80.8%) |
| 15 Years | 4 (100.0%) | 19 (100.0%) |
| 16 and 17 Years | 47 (100.0%) | 45 (100.0%) |
| 18 to 24 Years | 87 (100.0%) | 81 (93.1%) |
| 25 to 34 Years | 92 (100.0%) | 120 (78.4%) |
| 35 to 44 Years | 250 (94.3%) | 200 (98.5%) |
| 45 to 54 Years | 129 (100.0%) | 155 (97.5%) |
| 55 to 64 Years | 244 (98.0%) | 141 (100.0%) |
| 65 to 74 Years | 126 (91.3%) | 146 (92.4%) |
| 75 Years and over | 81 (93.1%) | 83 (86.5%) |
| Total | 1,246 (96.2%) | 1,196 (91.6%) |
Income Below Poverty Among Married-Couple Families in Leavenworth
The poverty statistics for married-couple families in Leavenworth show that 0.5% or 3 of the total 542 families live below the poverty line. Families with 3 or 4 children have the highest poverty rate of 9.7%, comprising of 3 families. On the other hand, families with no children have the lowest poverty rate of 0.0%, which includes 0 families.
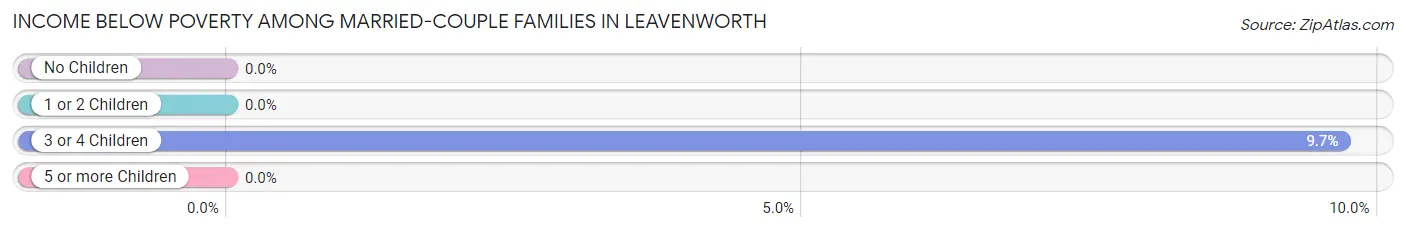
| Children | Above Poverty | Below Poverty |
| No Children | 327 (100.0%) | 0 (0.0%) |
| 1 or 2 Children | 184 (100.0%) | 0 (0.0%) |
| 3 or 4 Children | 28 (90.3%) | 3 (9.7%) |
| 5 or more Children | 0 (0.0%) | 0 (0.0%) |
| Total | 539 (99.5%) | 3 (0.5%) |
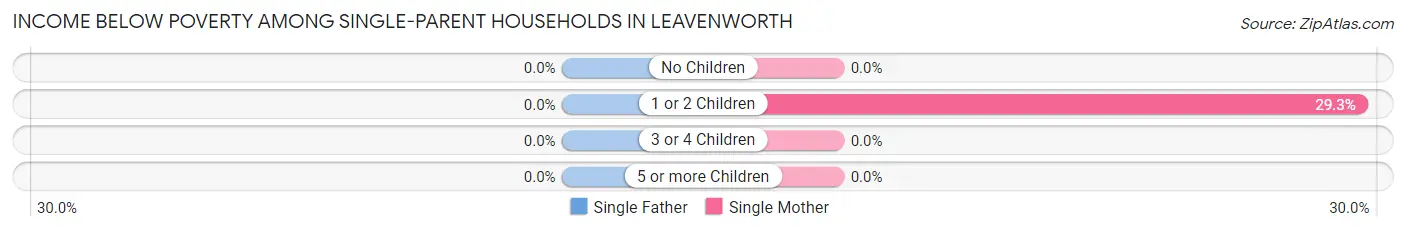
Income Below Poverty Among Single-Parent Households in Leavenworth
| Children | Single Father | Single Mother |
| No Children | 0 (0.0%) | 0 (0.0%) |
| 1 or 2 Children | 0 (0.0%) | 24 (29.3%) |
| 3 or 4 Children | 0 (0.0%) | 0 (0.0%) |
| 5 or more Children | 0 (0.0%) | 0 (0.0%) |
| Total | 0 (0.0%) | 24 (23.8%) |
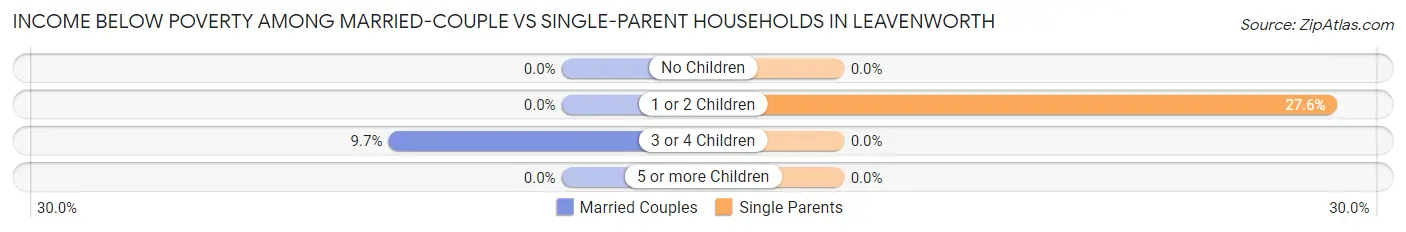
Income Below Poverty Among Married-Couple vs Single-Parent Households in Leavenworth
The poverty data for Leavenworth shows that 3 of the married-couple family households (0.5%) and 24 of the single-parent households (20.0%) are living below the poverty level. Within the married-couple family households, those with 3 or 4 children have the highest poverty rate, with 3 households (9.7%) falling below the poverty line. Among the single-parent households, those with 1 or 2 children have the highest poverty rate, with 24 household (27.6%) living below poverty.
| Children | Married-Couple Families | Single-Parent Households |
| No Children | 0 (0.0%) | 0 (0.0%) |
| 1 or 2 Children | 0 (0.0%) | 24 (27.6%) |
| 3 or 4 Children | 3 (9.7%) | 0 (0.0%) |
| 5 or more Children | 0 (0.0%) | 0 (0.0%) |
| Total | 3 (0.5%) | 24 (20.0%) |
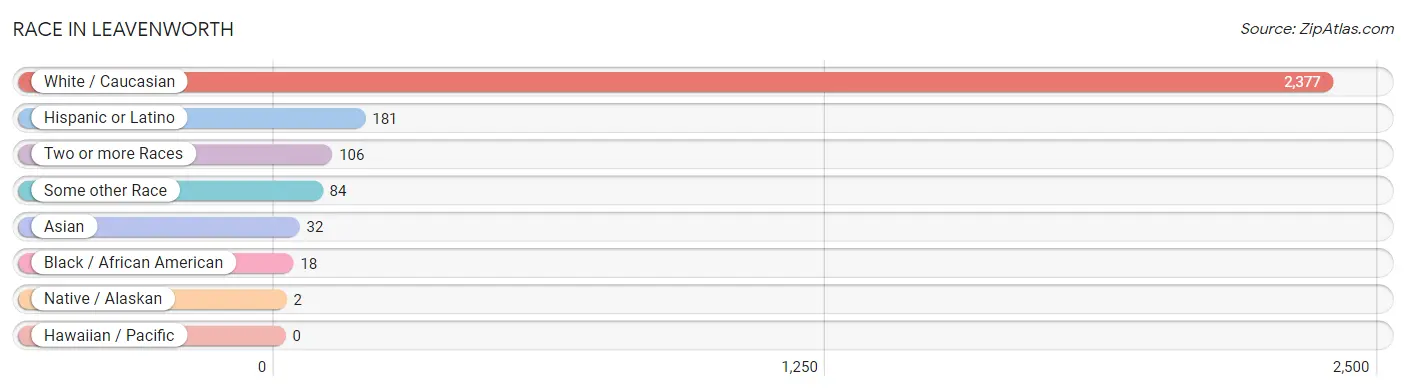
Race in Leavenworth
The most populous races in Leavenworth are White / Caucasian (2,377 | 90.8%), Hispanic or Latino (181 | 6.9%), and Two or more Races (106 | 4.1%).
| Race | # Population | % Population |
| Asian | 32 | 1.2% |
| Black / African American | 18 | 0.7% |
| Hawaiian / Pacific | 0 | 0.0% |
| Hispanic or Latino | 181 | 6.9% |
| Native / Alaskan | 2 | 0.1% |
| White / Caucasian | 2,377 | 90.8% |
| Two or more Races | 106 | 4.1% |
| Some other Race | 84 | 3.2% |
| Total | 2,619 | 100.0% |
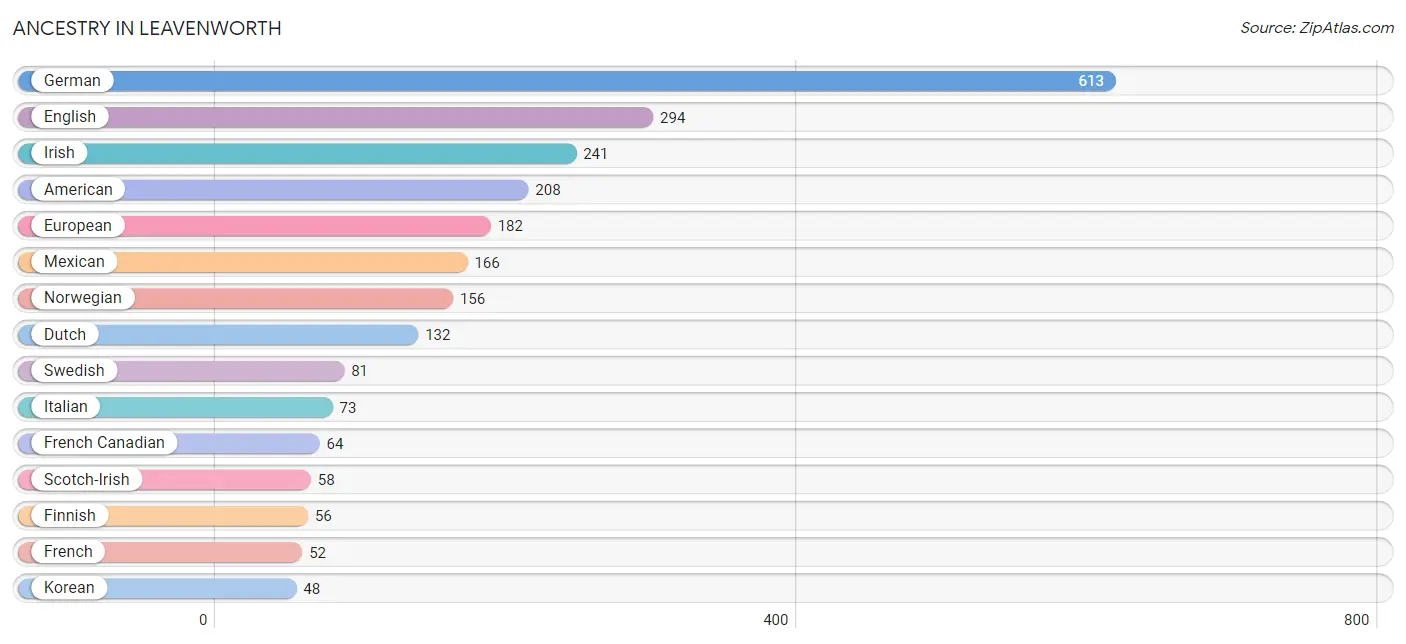
Ancestry in Leavenworth
The most populous ancestries reported in Leavenworth are German (613 | 23.4%), English (294 | 11.2%), Irish (241 | 9.2%), American (208 | 7.9%), and European (182 | 7.0%), together accounting for 58.7% of all Leavenworth residents.
| Ancestry | # Population | % Population |
| American | 208 | 7.9% |
| Arab | 30 | 1.1% |
| Armenian | 7 | 0.3% |
| Austrian | 22 | 0.8% |
| British | 19 | 0.7% |
| Cherokee | 6 | 0.2% |
| Czech | 7 | 0.3% |
| Czechoslovakian | 10 | 0.4% |
| Danish | 23 | 0.9% |
| Dutch | 132 | 5.0% |
| English | 294 | 11.2% |
| European | 182 | 7.0% |
| Finnish | 56 | 2.1% |
| French | 52 | 2.0% |
| French Canadian | 64 | 2.4% |
| German | 613 | 23.4% |
| Greek | 5 | 0.2% |
| Hungarian | 6 | 0.2% |
| Icelander | 7 | 0.3% |
| Irish | 241 | 9.2% |
| Italian | 73 | 2.8% |
| Jordanian | 18 | 0.7% |
| Korean | 48 | 1.8% |
| Lebanese | 18 | 0.7% |
| Lithuanian | 13 | 0.5% |
| Mexican | 166 | 6.3% |
| Northern European | 22 | 0.8% |
| Norwegian | 156 | 6.0% |
| Polish | 38 | 1.5% |
| Romanian | 13 | 0.5% |
| Russian | 10 | 0.4% |
| Scandinavian | 4 | 0.2% |
| Scotch-Irish | 58 | 2.2% |
| Scottish | 44 | 1.7% |
| Slovak | 3 | 0.1% |
| Spaniard | 3 | 0.1% |
| Spanish | 12 | 0.5% |
| Swedish | 81 | 3.1% |
| Swiss | 6 | 0.2% |
| Thai | 25 | 0.9% |
| Turkish | 20 | 0.8% |
| Ukrainian | 7 | 0.3% |
| Welsh | 14 | 0.5% | View All 43 Rows |
Immigrants in Leavenworth
The most numerous immigrant groups reported in Leavenworth came from Central America (82 | 3.1%), Latin America (82 | 3.1%), Mexico (82 | 3.1%), Asia (25 | 0.9%), and India (25 | 0.9%), together accounting for 11.3% of all Leavenworth residents.
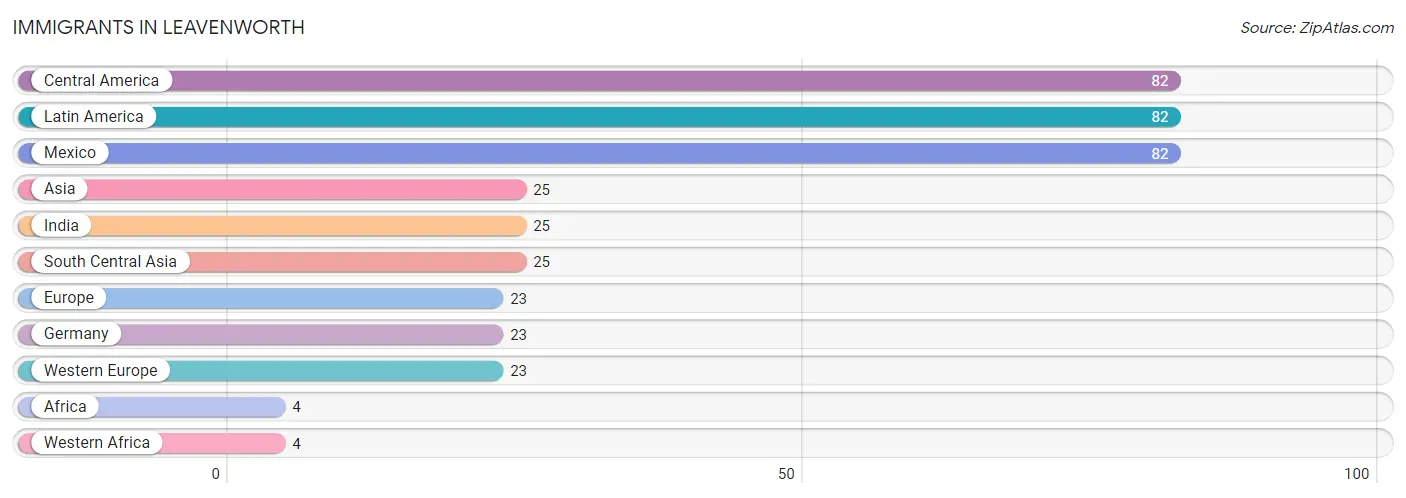
| Immigration Origin | # Population | % Population |
| Africa | 4 | 0.2% |
| Asia | 25 | 0.9% |
| Central America | 82 | 3.1% |
| Europe | 23 | 0.9% |
| Germany | 23 | 0.9% |
| India | 25 | 0.9% |
| Latin America | 82 | 3.1% |
| Mexico | 82 | 3.1% |
| South Central Asia | 25 | 0.9% |
| Western Africa | 4 | 0.2% |
| Western Europe | 23 | 0.9% | View All 11 Rows |
Sex and Age in Leavenworth
Sex and Age in Leavenworth
The most populous age groups in Leavenworth are 40 to 44 Years (155 | 12.0%) for men and 40 to 44 Years (146 | 11.0%) for women.
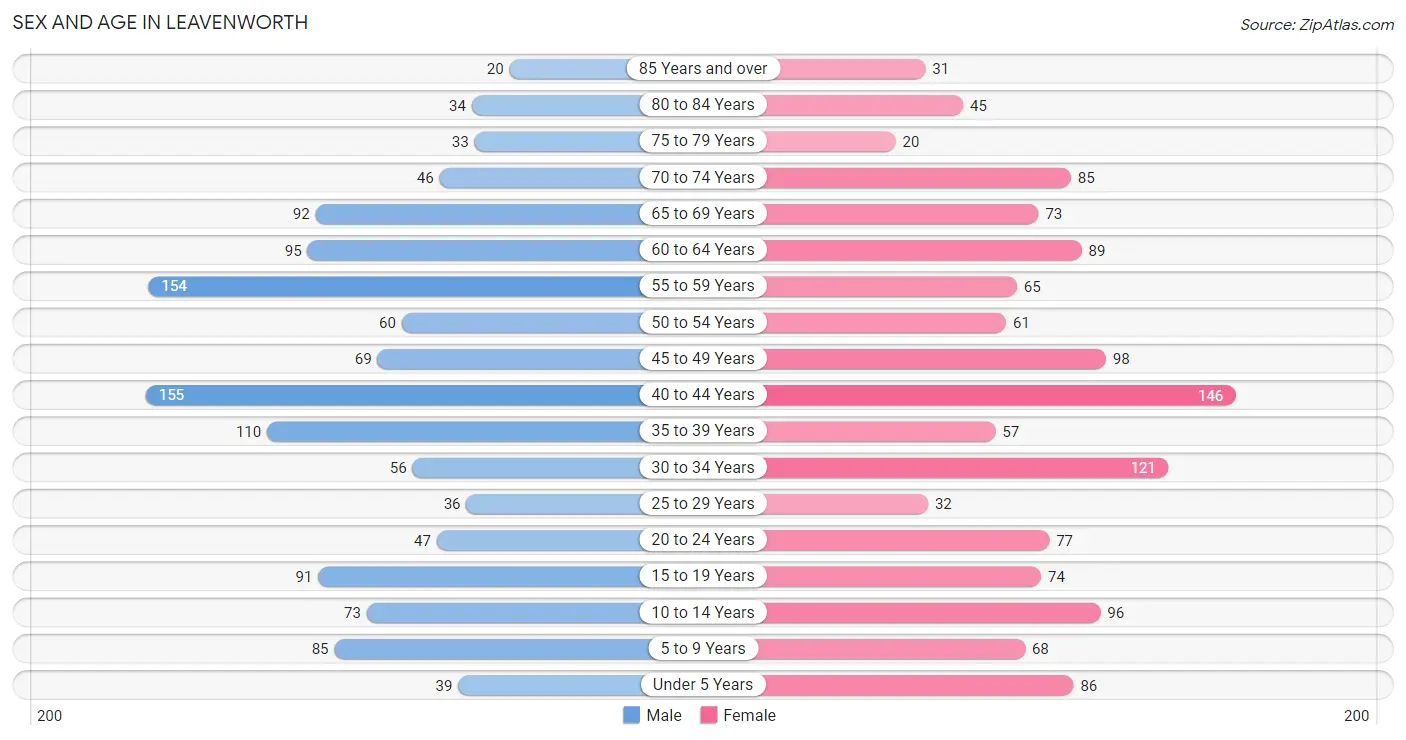
| Age Bracket | Male | Female |
| Under 5 Years | 39 (3.0%) | 86 (6.5%) |
| 5 to 9 Years | 85 (6.6%) | 68 (5.1%) |
| 10 to 14 Years | 73 (5.6%) | 96 (7.2%) |
| 15 to 19 Years | 91 (7.0%) | 74 (5.6%) |
| 20 to 24 Years | 47 (3.6%) | 77 (5.8%) |
| 25 to 29 Years | 36 (2.8%) | 32 (2.4%) |
| 30 to 34 Years | 56 (4.3%) | 121 (9.1%) |
| 35 to 39 Years | 110 (8.5%) | 57 (4.3%) |
| 40 to 44 Years | 155 (12.0%) | 146 (11.0%) |
| 45 to 49 Years | 69 (5.3%) | 98 (7.4%) |
| 50 to 54 Years | 60 (4.6%) | 61 (4.6%) |
| 55 to 59 Years | 154 (11.9%) | 65 (4.9%) |
| 60 to 64 Years | 95 (7.3%) | 89 (6.7%) |
| 65 to 69 Years | 92 (7.1%) | 73 (5.5%) |
| 70 to 74 Years | 46 (3.5%) | 85 (6.4%) |
| 75 to 79 Years | 33 (2.5%) | 20 (1.5%) |
| 80 to 84 Years | 34 (2.6%) | 45 (3.4%) |
| 85 Years and over | 20 (1.5%) | 31 (2.3%) |
| Total | 1,295 (100.0%) | 1,324 (100.0%) |
Families and Households in Leavenworth
Median Family Size in Leavenworth
The median family size in Leavenworth is 2.99 persons per family, with single female/mother families (101 | 15.3%) accounting for the largest median family size of 3.51 persons per family. On the other hand, single male/father families (19 | 2.9%) represent the smallest median family size with 2.74 persons per family.
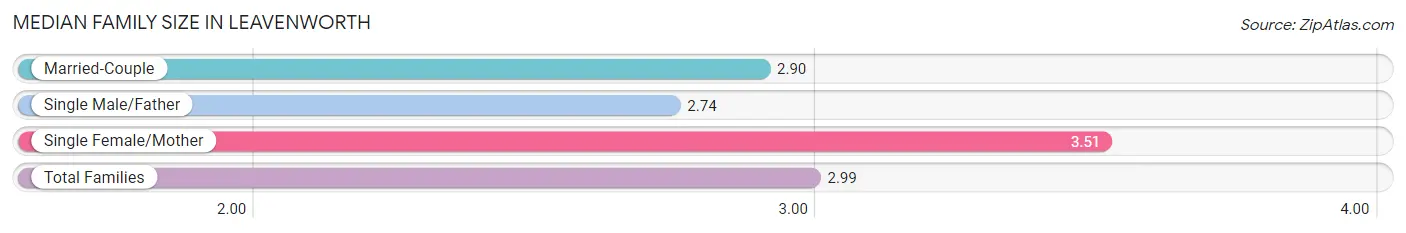
| Family Type | # Families | Family Size |
| Married-Couple | 542 (81.9%) | 2.90 |
| Single Male/Father | 19 (2.9%) | 2.74 |
| Single Female/Mother | 101 (15.3%) | 3.51 |
| Total Families | 662 (100.0%) | 2.99 |
Median Household Size in Leavenworth
The median household size in Leavenworth is 2.26 persons per household, with single female/mother households (101 | 8.7%) accounting for the largest median household size of 3.51 persons per household. non-family households (492 | 42.6%) represent the smallest median household size with 1.23 persons per household.
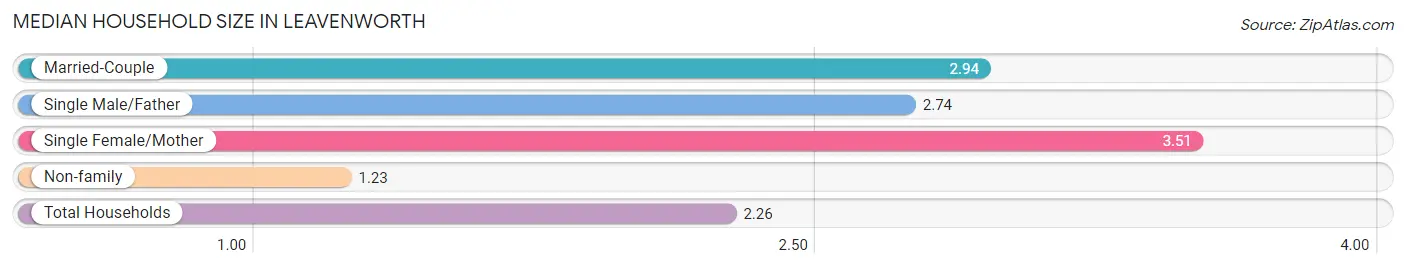
| Household Type | # Households | Household Size |
| Married-Couple | 542 (47.0%) | 2.94 |
| Single Male/Father | 19 (1.7%) | 2.74 |
| Single Female/Mother | 101 (8.7%) | 3.51 |
| Non-family | 492 (42.6%) | 1.23 |
| Total Households | 1,154 (100.0%) | 2.26 |
Household Size by Marriage Status in Leavenworth
Out of a total of 1,154 households in Leavenworth, 662 (57.4%) are family households, while 492 (42.6%) are nonfamily households. The most numerous type of family households are 2-person households, comprising 298, and the most common type of nonfamily households are 1-person households, comprising 396.
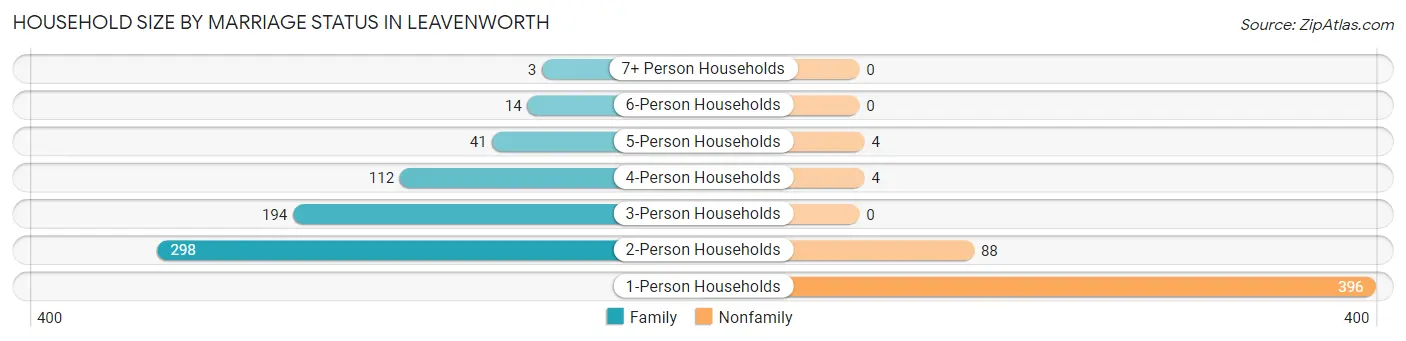
| Household Size | Family Households | Nonfamily Households |
| 1-Person Households | - | 396 (34.3%) |
| 2-Person Households | 298 (25.8%) | 88 (7.6%) |
| 3-Person Households | 194 (16.8%) | 0 (0.0%) |
| 4-Person Households | 112 (9.7%) | 4 (0.4%) |
| 5-Person Households | 41 (3.5%) | 4 (0.4%) |
| 6-Person Households | 14 (1.2%) | 0 (0.0%) |
| 7+ Person Households | 3 (0.3%) | 0 (0.0%) |
| Total | 662 (57.4%) | 492 (42.6%) |
Female Fertility in Leavenworth
Fertility by Age in Leavenworth
Average fertility rate in Leavenworth is 48.0 births per 1,000 women. Women in the age bracket of 20 to 34 years have the highest fertility rate with 74.0 births per 1,000 women. Women in the age bracket of 20 to 34 years acount for 54.8% of all women with births.
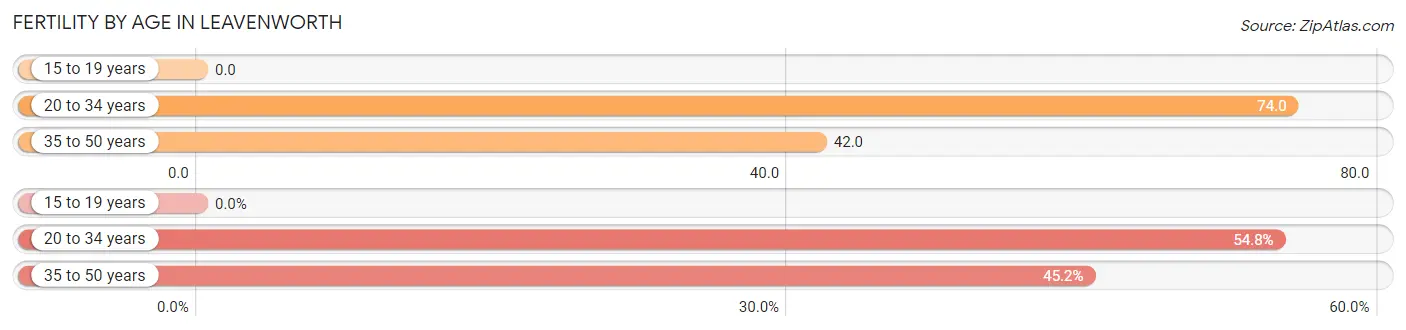
| Age Bracket | Women with Births | Births / 1,000 Women |
| 15 to 19 years | 0 (0.0%) | 0.0 |
| 20 to 34 years | 17 (54.8%) | 74.0 |
| 35 to 50 years | 14 (45.2%) | 42.0 |
| Total | 31 (100.0%) | 48.0 |
Fertility by Age by Marriage Status in Leavenworth
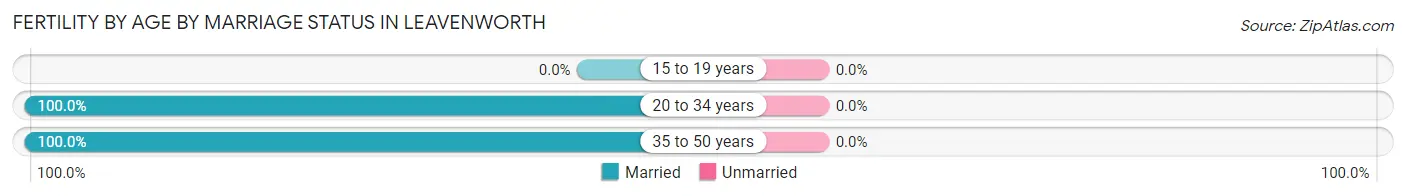
| Age Bracket | Married | Unmarried |
| 15 to 19 years | 0 (0.0%) | 0 (0.0%) |
| 20 to 34 years | 17 (100.0%) | 0 (0.0%) |
| 35 to 50 years | 14 (100.0%) | 0 (0.0%) |
| Total | 31 (100.0%) | 0 (0.0%) |
Fertility by Education in Leavenworth
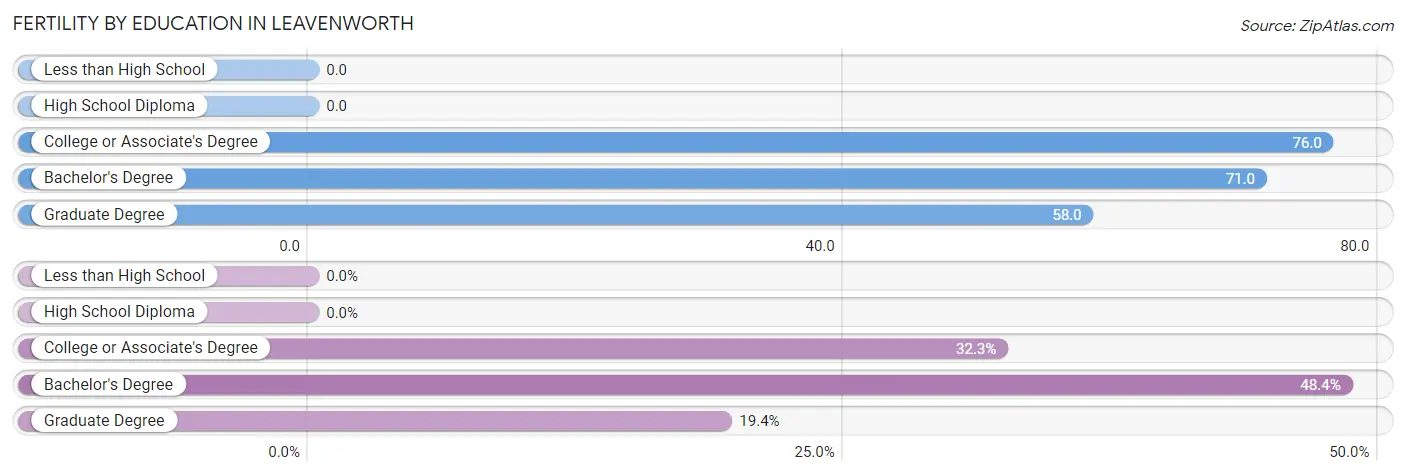
| Educational Attainment | Women with Births | Births / 1,000 Women |
| Less than High School | 0 (0.0%) | 0.0 |
| High School Diploma | 0 (0.0%) | 0.0 |
| College or Associate's Degree | 10 (32.3%) | 76.0 |
| Bachelor's Degree | 15 (48.4%) | 71.0 |
| Graduate Degree | 6 (19.4%) | 58.0 |
| Total | 31 (100.0%) | 48.0 |
Fertility by Education by Marriage Status in Leavenworth
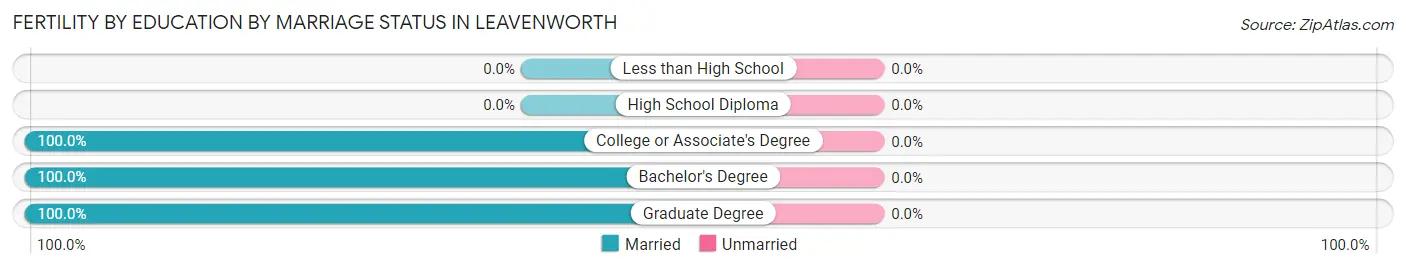
| Educational Attainment | Married | Unmarried |
| Less than High School | 0 (0.0%) | 0 (0.0%) |
| High School Diploma | 0 (0.0%) | 0 (0.0%) |
| College or Associate's Degree | 10 (100.0%) | 0 (0.0%) |
| Bachelor's Degree | 15 (100.0%) | 0 (0.0%) |
| Graduate Degree | 6 (100.0%) | 0 (0.0%) |
| Total | 31 (100.0%) | 0 (0.0%) |
Employment Characteristics in Leavenworth
Employment by Class of Employer in Leavenworth
Among the 1,300 employed individuals in Leavenworth, private company employees (735 | 56.5%), local government employees (163 | 12.5%), and not-for-profit organizations (154 | 11.8%) make up the most common classes of employment.
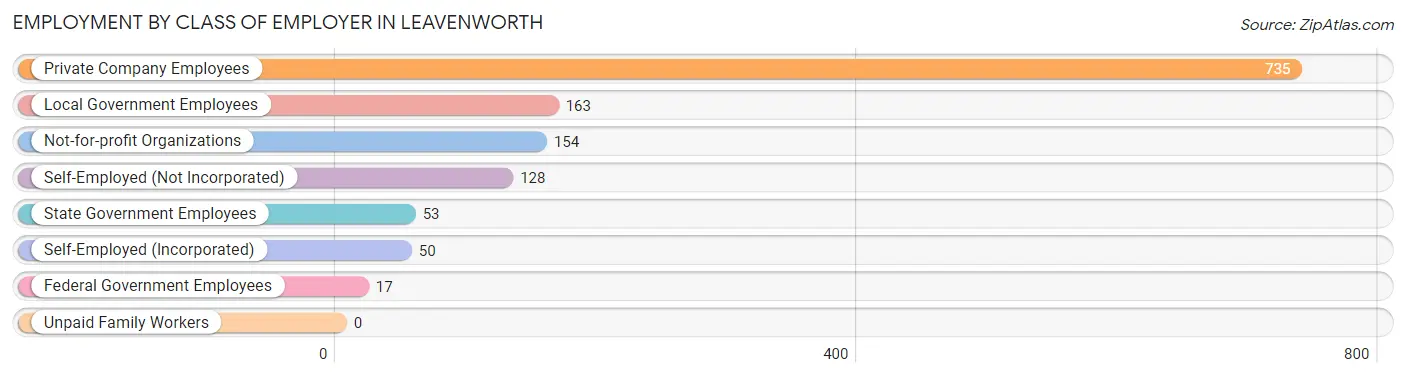
| Employer Class | # Employees | % Employees |
| Private Company Employees | 735 | 56.5% |
| Self-Employed (Incorporated) | 50 | 3.8% |
| Self-Employed (Not Incorporated) | 128 | 9.9% |
| Not-for-profit Organizations | 154 | 11.8% |
| Local Government Employees | 163 | 12.5% |
| State Government Employees | 53 | 4.1% |
| Federal Government Employees | 17 | 1.3% |
| Unpaid Family Workers | 0 | 0.0% |
| Total | 1,300 | 100.0% |
Employment Status by Age in Leavenworth
According to the labor force statistics for Leavenworth, out of the total population over 16 years of age (2,149), 61.1% or 1,313 individuals are in the labor force, with 0.3% or 4 of them unemployed. The age group with the highest labor force participation rate is 20 to 24 years, with 100.0% or 124 individuals in the labor force. Within the labor force, the 55 to 59 years age range has the highest percentage of unemployed individuals, with 4.1% or 4 of them being unemployed.
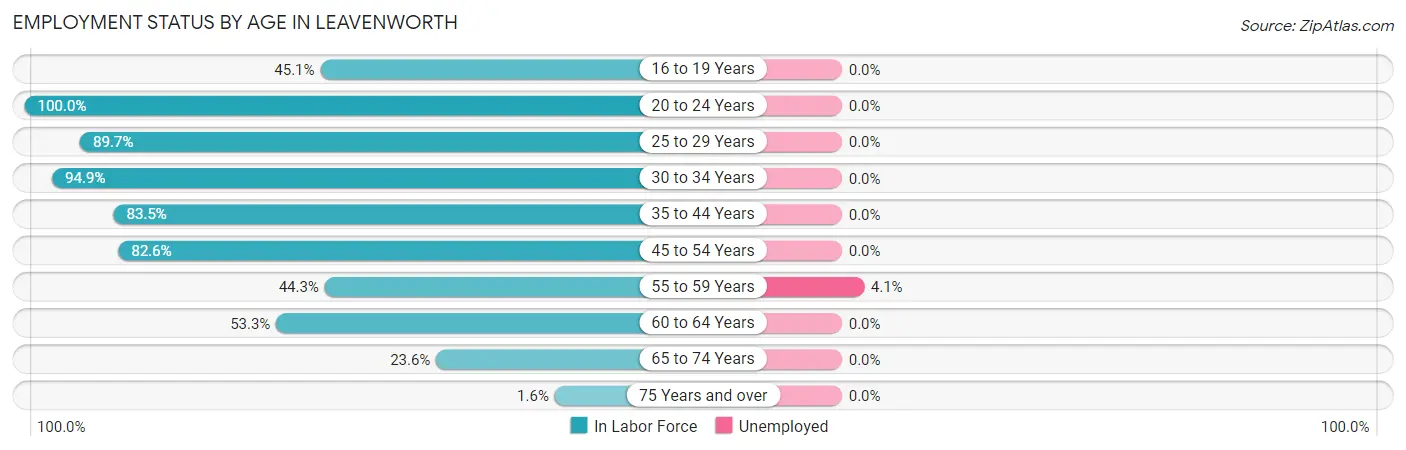
| Age Bracket | In Labor Force | Unemployed |
| 16 to 19 Years | 64 (45.1%) | 0 (0.0%) |
| 20 to 24 Years | 124 (100.0%) | 0 (0.0%) |
| 25 to 29 Years | 61 (89.7%) | 0 (0.0%) |
| 30 to 34 Years | 168 (94.9%) | 0 (0.0%) |
| 35 to 44 Years | 391 (83.5%) | 0 (0.0%) |
| 45 to 54 Years | 238 (82.6%) | 0 (0.0%) |
| 55 to 59 Years | 97 (44.3%) | 4 (4.1%) |
| 60 to 64 Years | 98 (53.3%) | 0 (0.0%) |
| 65 to 74 Years | 70 (23.6%) | 0 (0.0%) |
| 75 Years and over | 3 (1.6%) | 0 (0.0%) |
| Total | 1,313 (61.1%) | 4 (0.3%) |
Employment Status by Educational Attainment in Leavenworth
According to labor force statistics for Leavenworth, 75.0% of individuals (1,053) out of the total population between 25 and 64 years of age (1,404) are in the labor force, with 0.4% or 4 of them being unemployed. The group with the highest labor force participation rate are those with the educational attainment of less than high school, with 88.9% or 32 individuals in the labor force. Within the labor force, individuals with bachelor's degree or higher education have the highest percentage of unemployment, with 0.7% or 4 of them being unemployed.
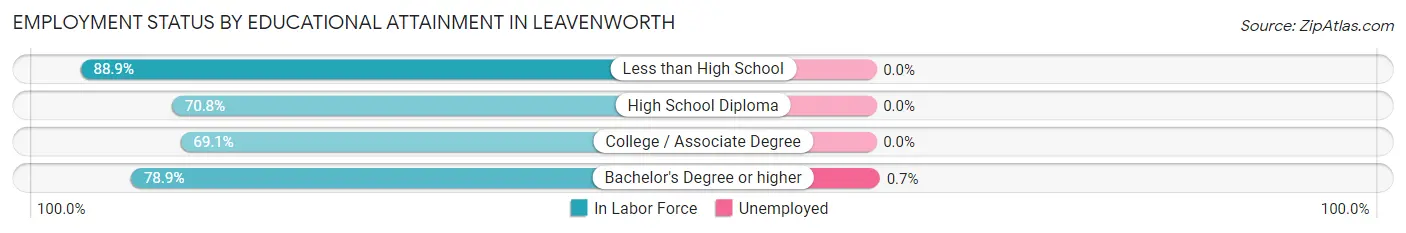
| Educational Attainment | In Labor Force | Unemployed |
| Less than High School | 32 (88.9%) | 0 (0.0%) |
| High School Diploma | 184 (70.8%) | 0 (0.0%) |
| College / Associate Degree | 264 (69.1%) | 0 (0.0%) |
| Bachelor's Degree or higher | 573 (78.9%) | 5 (0.7%) |
| Total | 1,053 (75.0%) | 6 (0.4%) |
Employment Occupations by Sex in Leavenworth
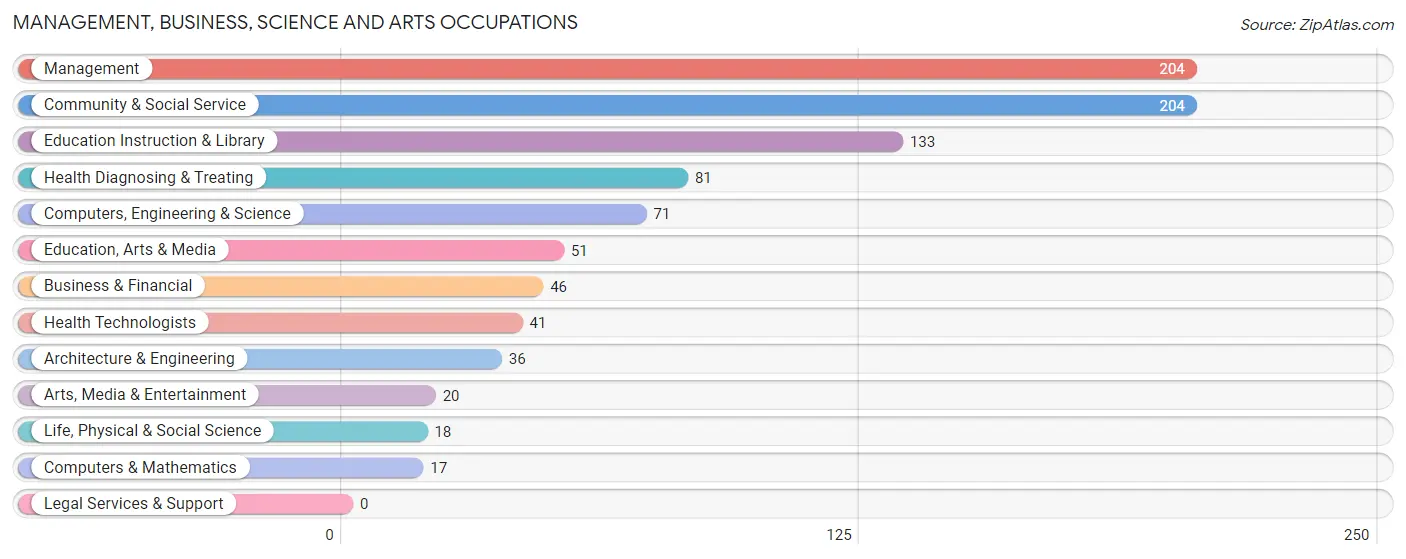
Management, Business, Science and Arts Occupations
The most common Management, Business, Science and Arts occupations in Leavenworth are Management (204 | 15.6%), Community & Social Service (204 | 15.6%), Education Instruction & Library (133 | 10.2%), Health Diagnosing & Treating (81 | 6.2%), and Computers, Engineering & Science (71 | 5.4%).
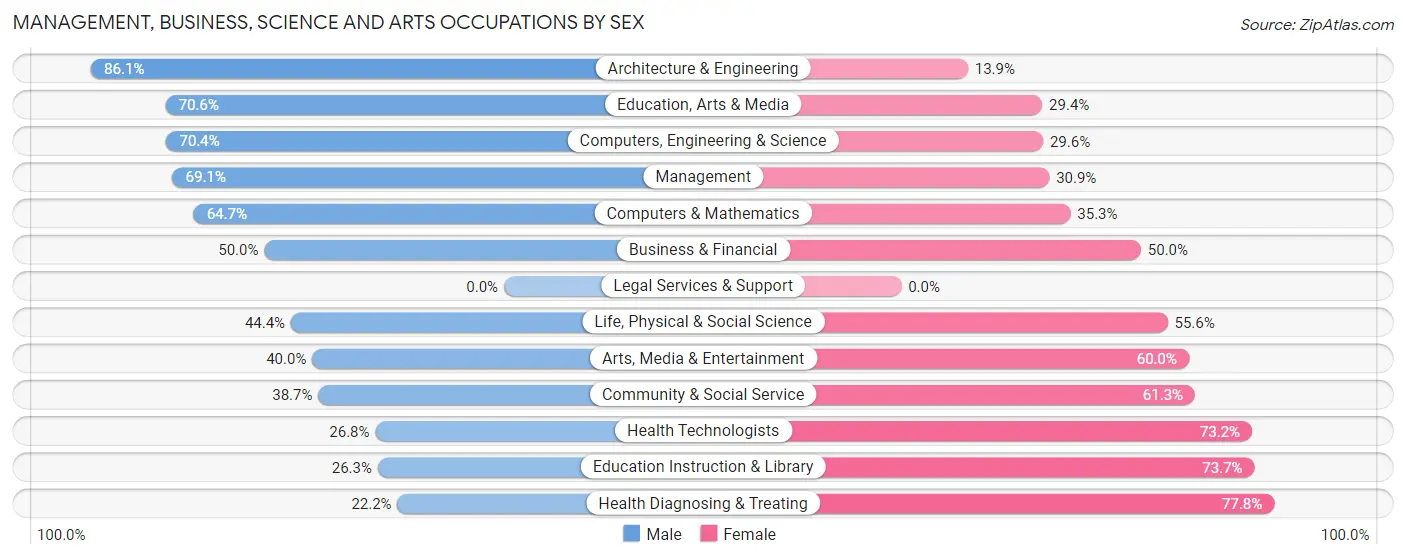
Management, Business, Science and Arts Occupations by Sex
Within the Management, Business, Science and Arts occupations in Leavenworth, the most male-oriented occupations are Architecture & Engineering (86.1%), Education, Arts & Media (70.6%), and Computers, Engineering & Science (70.4%), while the most female-oriented occupations are Health Diagnosing & Treating (77.8%), Education Instruction & Library (73.7%), and Health Technologists (73.2%).
| Occupation | Male | Female |
| Management | 141 (69.1%) | 63 (30.9%) |
| Business & Financial | 23 (50.0%) | 23 (50.0%) |
| Computers, Engineering & Science | 50 (70.4%) | 21 (29.6%) |
| Computers & Mathematics | 11 (64.7%) | 6 (35.3%) |
| Architecture & Engineering | 31 (86.1%) | 5 (13.9%) |
| Life, Physical & Social Science | 8 (44.4%) | 10 (55.6%) |
| Community & Social Service | 79 (38.7%) | 125 (61.3%) |
| Education, Arts & Media | 36 (70.6%) | 15 (29.4%) |
| Legal Services & Support | 0 (0.0%) | 0 (0.0%) |
| Education Instruction & Library | 35 (26.3%) | 98 (73.7%) |
| Arts, Media & Entertainment | 8 (40.0%) | 12 (60.0%) |
| Health Diagnosing & Treating | 18 (22.2%) | 63 (77.8%) |
| Health Technologists | 11 (26.8%) | 30 (73.2%) |
| Total (Category) | 311 (51.3%) | 295 (48.7%) |
| Total (Overall) | 655 (50.0%) | 655 (50.0%) |
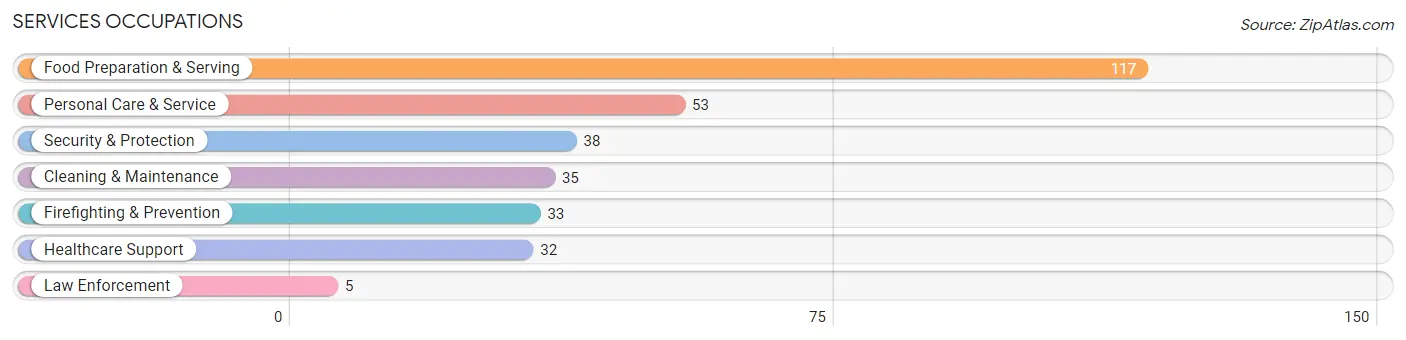
Services Occupations
The most common Services occupations in Leavenworth are Food Preparation & Serving (117 | 8.9%), Personal Care & Service (53 | 4.1%), Security & Protection (38 | 2.9%), Cleaning & Maintenance (35 | 2.7%), and Firefighting & Prevention (33 | 2.5%).
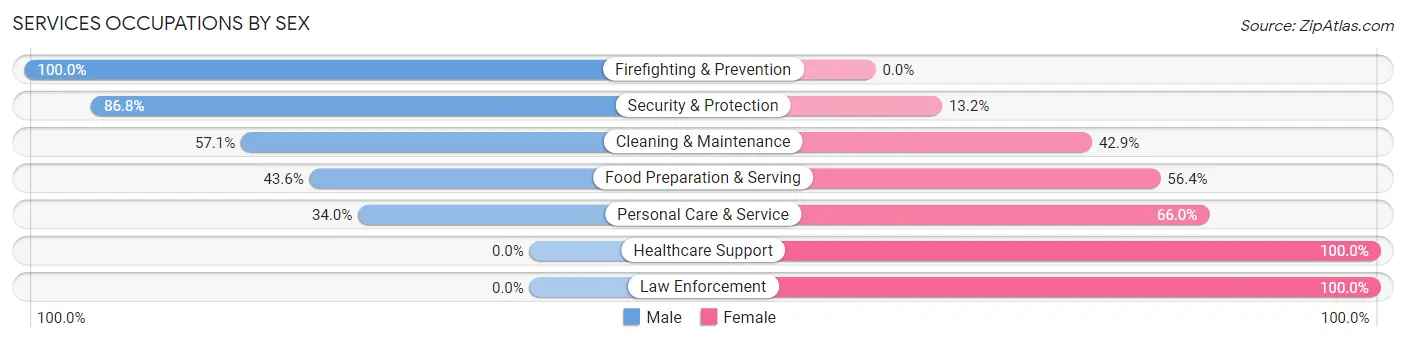
Services Occupations by Sex
Within the Services occupations in Leavenworth, the most male-oriented occupations are Firefighting & Prevention (100.0%), Security & Protection (86.8%), and Cleaning & Maintenance (57.1%), while the most female-oriented occupations are Healthcare Support (100.0%), Law Enforcement (100.0%), and Personal Care & Service (66.0%).
| Occupation | Male | Female |
| Healthcare Support | 0 (0.0%) | 32 (100.0%) |
| Security & Protection | 33 (86.8%) | 5 (13.2%) |
| Firefighting & Prevention | 33 (100.0%) | 0 (0.0%) |
| Law Enforcement | 0 (0.0%) | 5 (100.0%) |
| Food Preparation & Serving | 51 (43.6%) | 66 (56.4%) |
| Cleaning & Maintenance | 20 (57.1%) | 15 (42.9%) |
| Personal Care & Service | 18 (34.0%) | 35 (66.0%) |
| Total (Category) | 122 (44.4%) | 153 (55.6%) |
| Total (Overall) | 655 (50.0%) | 655 (50.0%) |
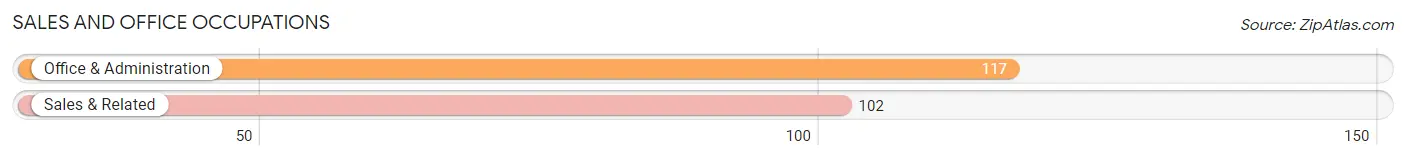
Sales and Office Occupations
The most common Sales and Office occupations in Leavenworth are Office & Administration (117 | 8.9%), and Sales & Related (102 | 7.8%).
Sales and Office Occupations by Sex
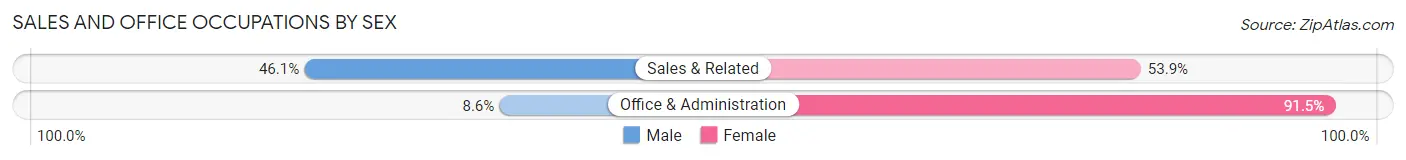
| Occupation | Male | Female |
| Sales & Related | 47 (46.1%) | 55 (53.9%) |
| Office & Administration | 10 (8.6%) | 107 (91.4%) |
| Total (Category) | 57 (26.0%) | 162 (74.0%) |
| Total (Overall) | 655 (50.0%) | 655 (50.0%) |
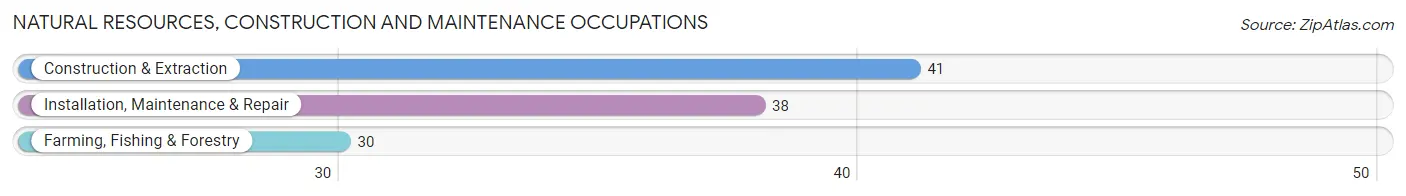
Natural Resources, Construction and Maintenance Occupations
The most common Natural Resources, Construction and Maintenance occupations in Leavenworth are Construction & Extraction (41 | 3.1%), Installation, Maintenance & Repair (38 | 2.9%), and Farming, Fishing & Forestry (30 | 2.3%).
Natural Resources, Construction and Maintenance Occupations by Sex
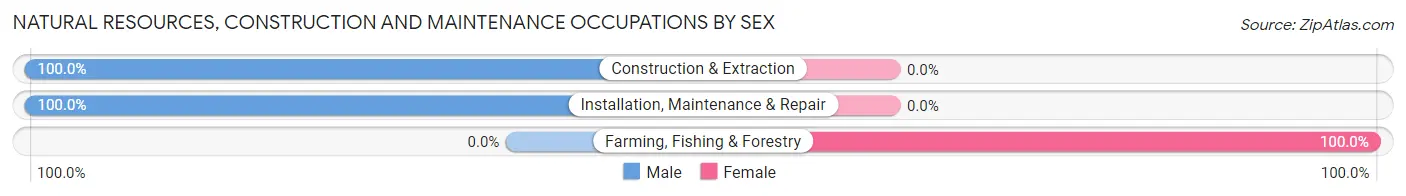
| Occupation | Male | Female |
| Farming, Fishing & Forestry | 0 (0.0%) | 30 (100.0%) |
| Construction & Extraction | 41 (100.0%) | 0 (0.0%) |
| Installation, Maintenance & Repair | 38 (100.0%) | 0 (0.0%) |
| Total (Category) | 79 (72.5%) | 30 (27.5%) |
| Total (Overall) | 655 (50.0%) | 655 (50.0%) |
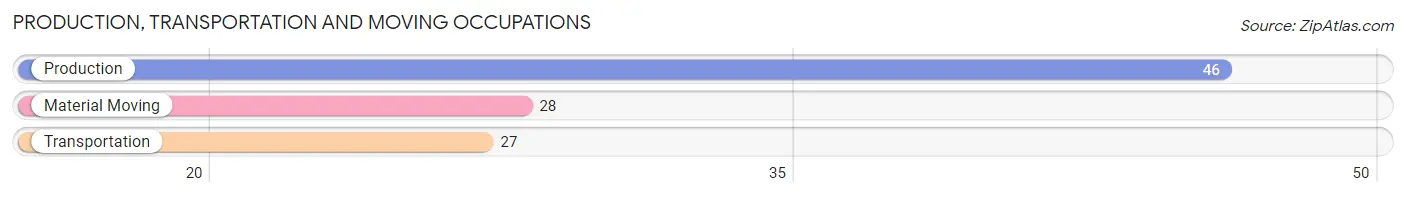
Production, Transportation and Moving Occupations
The most common Production, Transportation and Moving occupations in Leavenworth are Production (46 | 3.5%), Material Moving (28 | 2.1%), and Transportation (27 | 2.1%).
Production, Transportation and Moving Occupations by Sex
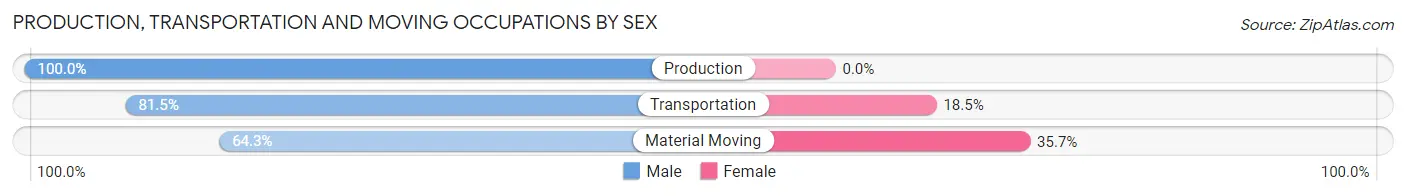
| Occupation | Male | Female |
| Production | 46 (100.0%) | 0 (0.0%) |
| Transportation | 22 (81.5%) | 5 (18.5%) |
| Material Moving | 18 (64.3%) | 10 (35.7%) |
| Total (Category) | 86 (85.2%) | 15 (14.8%) |
| Total (Overall) | 655 (50.0%) | 655 (50.0%) |
Employment Industries by Sex in Leavenworth
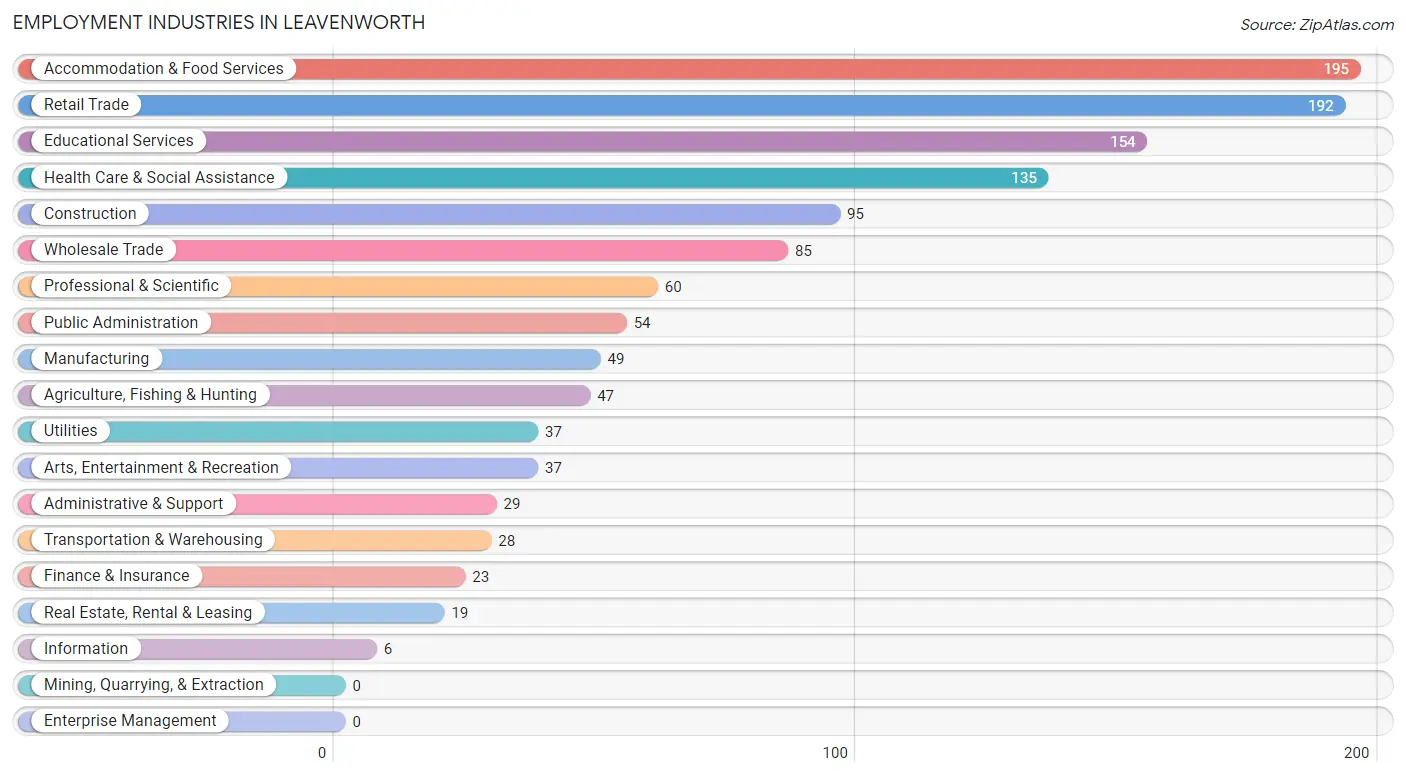
Employment Industries in Leavenworth
The major employment industries in Leavenworth include Accommodation & Food Services (195 | 14.9%), Retail Trade (192 | 14.7%), Educational Services (154 | 11.8%), Health Care & Social Assistance (135 | 10.3%), and Construction (95 | 7.2%).
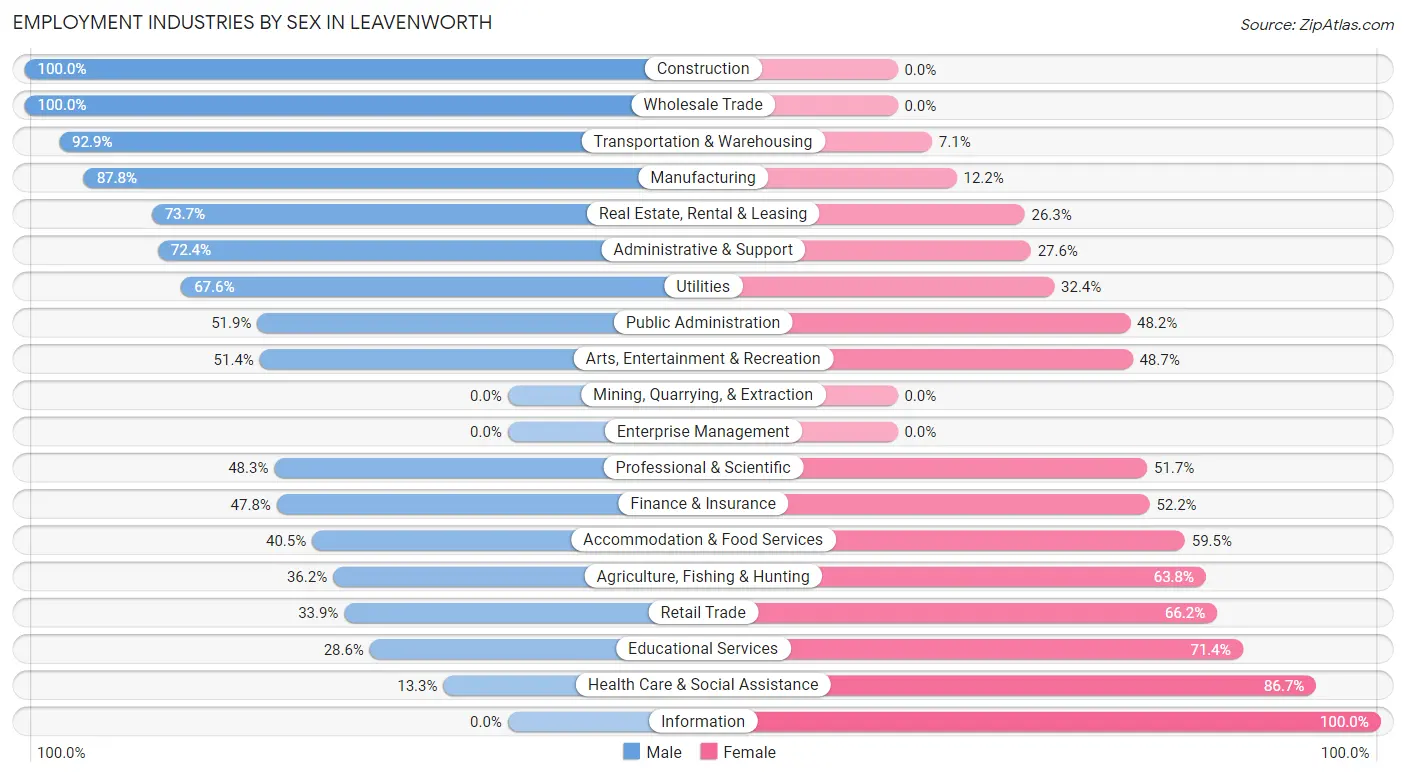
Employment Industries by Sex in Leavenworth
The Leavenworth industries that see more men than women are Construction (100.0%), Wholesale Trade (100.0%), and Transportation & Warehousing (92.9%), whereas the industries that tend to have a higher number of women are Information (100.0%), Health Care & Social Assistance (86.7%), and Educational Services (71.4%).
| Industry | Male | Female |
| Agriculture, Fishing & Hunting | 17 (36.2%) | 30 (63.8%) |
| Mining, Quarrying, & Extraction | 0 (0.0%) | 0 (0.0%) |
| Construction | 95 (100.0%) | 0 (0.0%) |
| Manufacturing | 43 (87.8%) | 6 (12.2%) |
| Wholesale Trade | 85 (100.0%) | 0 (0.0%) |
| Retail Trade | 65 (33.9%) | 127 (66.1%) |
| Transportation & Warehousing | 26 (92.9%) | 2 (7.1%) |
| Utilities | 25 (67.6%) | 12 (32.4%) |
| Information | 0 (0.0%) | 6 (100.0%) |
| Finance & Insurance | 11 (47.8%) | 12 (52.2%) |
| Real Estate, Rental & Leasing | 14 (73.7%) | 5 (26.3%) |
| Professional & Scientific | 29 (48.3%) | 31 (51.7%) |
| Enterprise Management | 0 (0.0%) | 0 (0.0%) |
| Administrative & Support | 21 (72.4%) | 8 (27.6%) |
| Educational Services | 44 (28.6%) | 110 (71.4%) |
| Health Care & Social Assistance | 18 (13.3%) | 117 (86.7%) |
| Arts, Entertainment & Recreation | 19 (51.3%) | 18 (48.6%) |
| Accommodation & Food Services | 79 (40.5%) | 116 (59.5%) |
| Public Administration | 28 (51.8%) | 26 (48.1%) |
| Total | 655 (50.0%) | 655 (50.0%) |
Education in Leavenworth
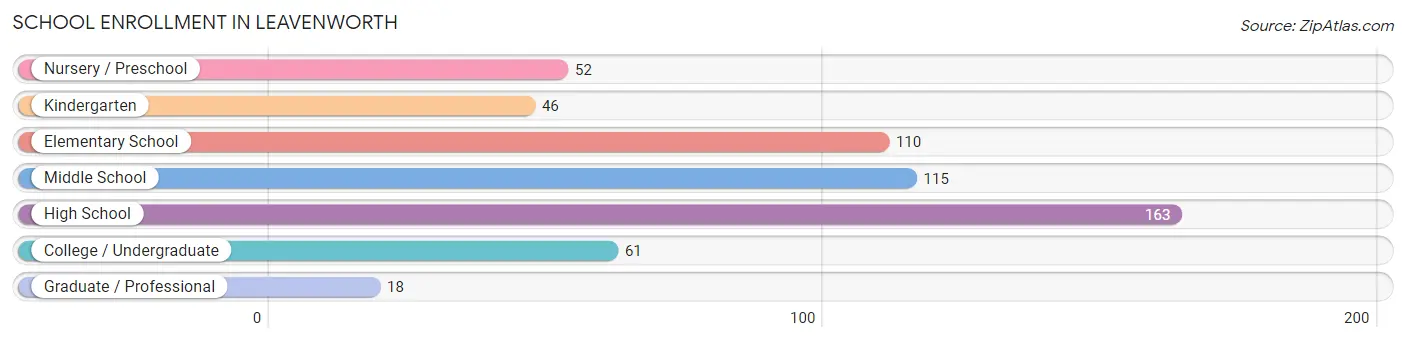
School Enrollment in Leavenworth
The most common levels of schooling among the 565 students in Leavenworth are high school (163 | 28.8%), middle school (115 | 20.3%), and elementary school (110 | 19.5%).
| School Level | # Students | % Students |
| Nursery / Preschool | 52 | 9.2% |
| Kindergarten | 46 | 8.1% |
| Elementary School | 110 | 19.5% |
| Middle School | 115 | 20.3% |
| High School | 163 | 28.8% |
| College / Undergraduate | 61 | 10.8% |
| Graduate / Professional | 18 | 3.2% |
| Total | 565 | 100.0% |
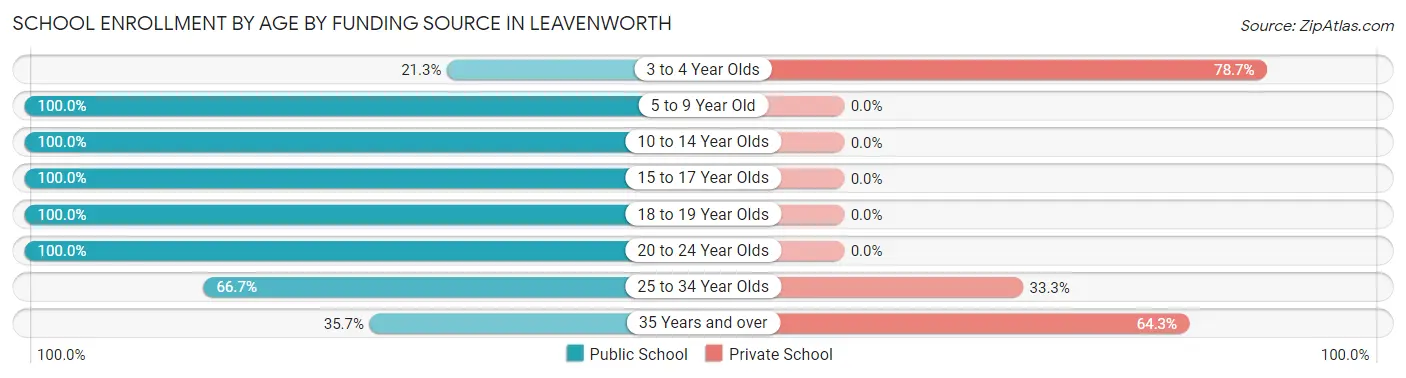
School Enrollment by Age by Funding Source in Leavenworth
Out of a total of 565 students who are enrolled in schools in Leavenworth, 48 (8.5%) attend a private institution, while the remaining 517 (91.5%) are enrolled in public schools. The age group of 3 to 4 year olds has the highest likelihood of being enrolled in private schools, with 37 (78.7% in the age bracket) enrolled. Conversely, the age group of 5 to 9 year old has the lowest likelihood of being enrolled in a private school, with 150 (100.0% in the age bracket) attending a public institution.
| Age Bracket | Public School | Private School |
| 3 to 4 Year Olds | 10 (21.3%) | 37 (78.7%) |
| 5 to 9 Year Old | 150 (100.0%) | 0 (0.0%) |
| 10 to 14 Year Olds | 161 (100.0%) | 0 (0.0%) |
| 15 to 17 Year Olds | 115 (100.0%) | 0 (0.0%) |
| 18 to 19 Year Olds | 40 (100.0%) | 0 (0.0%) |
| 20 to 24 Year Olds | 32 (100.0%) | 0 (0.0%) |
| 25 to 34 Year Olds | 4 (66.7%) | 2 (33.3%) |
| 35 Years and over | 5 (35.7%) | 9 (64.3%) |
| Total | 517 (91.5%) | 48 (8.5%) |
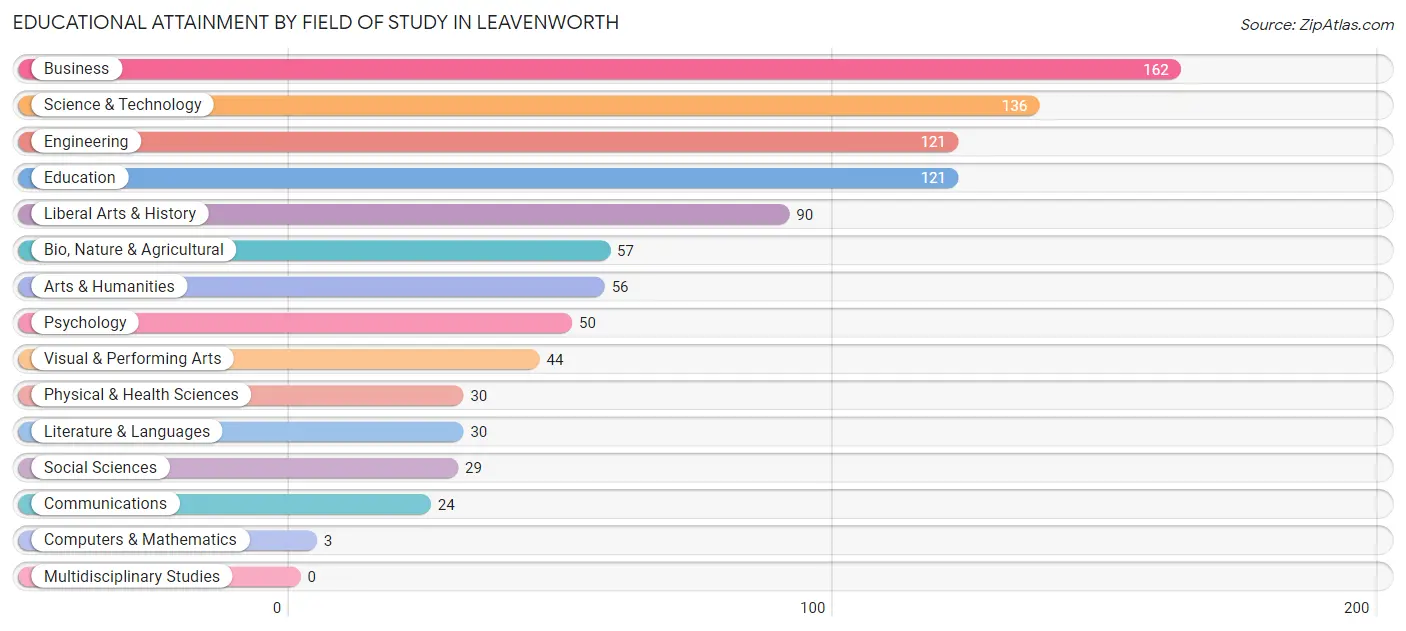
Educational Attainment by Field of Study in Leavenworth
Business (162 | 17.0%), science & technology (136 | 14.3%), engineering (121 | 12.7%), education (121 | 12.7%), and liberal arts & history (90 | 9.4%) are the most common fields of study among 953 individuals in Leavenworth who have obtained a bachelor's degree or higher.
| Field of Study | # Graduates | % Graduates |
| Computers & Mathematics | 3 | 0.3% |
| Bio, Nature & Agricultural | 57 | 6.0% |
| Physical & Health Sciences | 30 | 3.2% |
| Psychology | 50 | 5.2% |
| Social Sciences | 29 | 3.0% |
| Engineering | 121 | 12.7% |
| Multidisciplinary Studies | 0 | 0.0% |
| Science & Technology | 136 | 14.3% |
| Business | 162 | 17.0% |
| Education | 121 | 12.7% |
| Literature & Languages | 30 | 3.2% |
| Liberal Arts & History | 90 | 9.4% |
| Visual & Performing Arts | 44 | 4.6% |
| Communications | 24 | 2.5% |
| Arts & Humanities | 56 | 5.9% |
| Total | 953 | 100.0% |
Transportation & Commute in Leavenworth
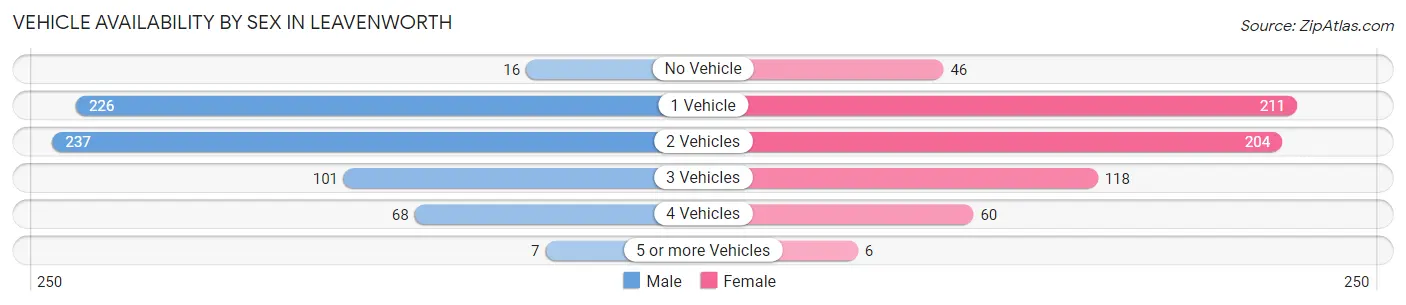
Vehicle Availability by Sex in Leavenworth
The most prevalent vehicle ownership categories in Leavenworth are males with 2 vehicles (237, accounting for 36.2%) and females with 2 vehicles (204, making up 36.7%).
| Vehicles Available | Male | Female |
| No Vehicle | 16 (2.4%) | 46 (7.1%) |
| 1 Vehicle | 226 (34.5%) | 211 (32.7%) |
| 2 Vehicles | 237 (36.2%) | 204 (31.6%) |
| 3 Vehicles | 101 (15.4%) | 118 (18.3%) |
| 4 Vehicles | 68 (10.4%) | 60 (9.3%) |
| 5 or more Vehicles | 7 (1.1%) | 6 (0.9%) |
| Total | 655 (100.0%) | 645 (100.0%) |
Commute Time in Leavenworth
The most frequently occuring commute durations in Leavenworth are 5 to 9 minutes (288 commuters, 26.9%), 15 to 19 minutes (169 commuters, 15.8%), and 10 to 14 minutes (132 commuters, 12.3%).
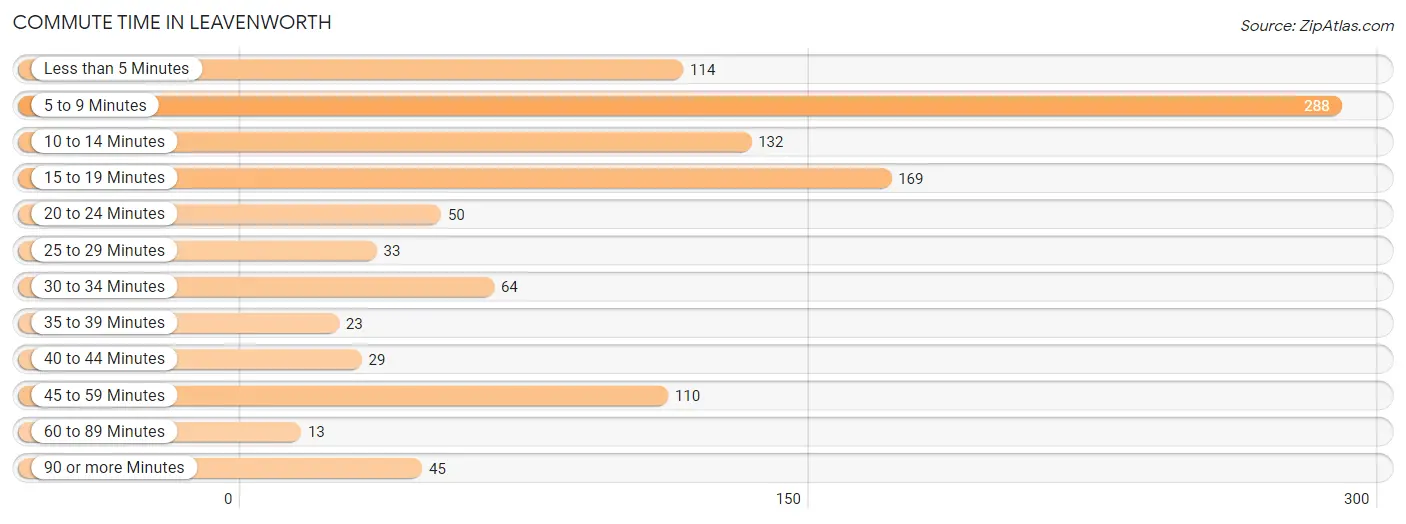
| Commute Time | # Commuters | % Commuters |
| Less than 5 Minutes | 114 | 10.6% |
| 5 to 9 Minutes | 288 | 26.9% |
| 10 to 14 Minutes | 132 | 12.3% |
| 15 to 19 Minutes | 169 | 15.8% |
| 20 to 24 Minutes | 50 | 4.7% |
| 25 to 29 Minutes | 33 | 3.1% |
| 30 to 34 Minutes | 64 | 6.0% |
| 35 to 39 Minutes | 23 | 2.1% |
| 40 to 44 Minutes | 29 | 2.7% |
| 45 to 59 Minutes | 110 | 10.3% |
| 60 to 89 Minutes | 13 | 1.2% |
| 90 or more Minutes | 45 | 4.2% |
Commute Time by Sex in Leavenworth
The most common commute times in Leavenworth are 15 to 19 minutes (114 commuters, 20.3%) for males and 5 to 9 minutes (202 commuters, 39.8%) for females.
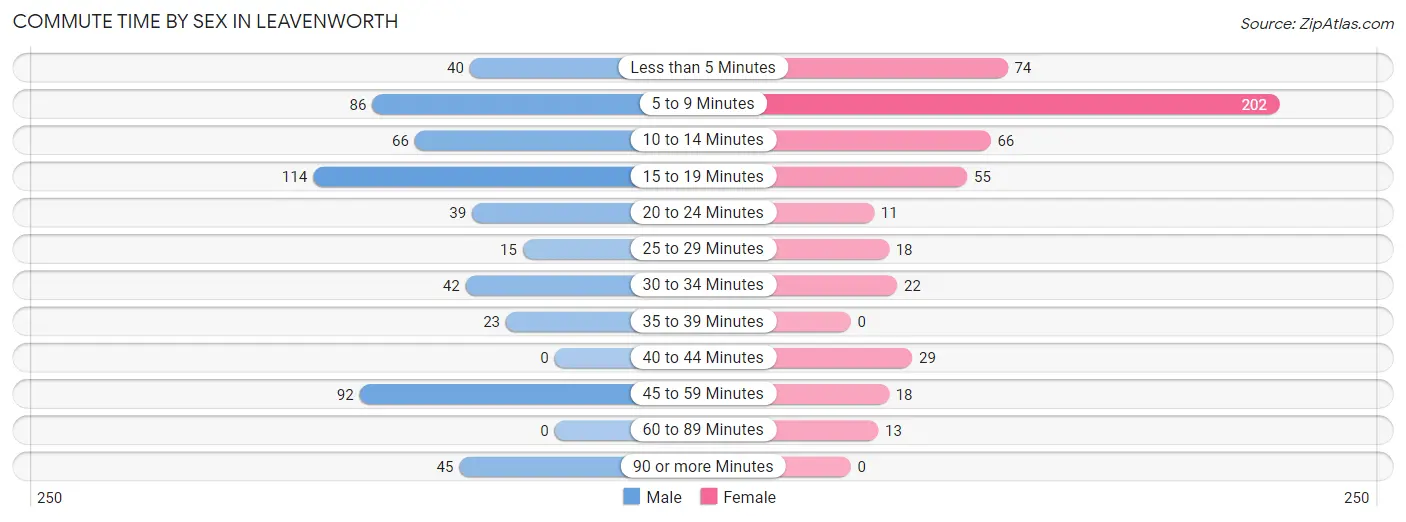
| Commute Time | Male | Female |
| Less than 5 Minutes | 40 (7.1%) | 74 (14.6%) |
| 5 to 9 Minutes | 86 (15.3%) | 202 (39.8%) |
| 10 to 14 Minutes | 66 (11.7%) | 66 (13.0%) |
| 15 to 19 Minutes | 114 (20.3%) | 55 (10.8%) |
| 20 to 24 Minutes | 39 (6.9%) | 11 (2.2%) |
| 25 to 29 Minutes | 15 (2.7%) | 18 (3.5%) |
| 30 to 34 Minutes | 42 (7.5%) | 22 (4.3%) |
| 35 to 39 Minutes | 23 (4.1%) | 0 (0.0%) |
| 40 to 44 Minutes | 0 (0.0%) | 29 (5.7%) |
| 45 to 59 Minutes | 92 (16.4%) | 18 (3.5%) |
| 60 to 89 Minutes | 0 (0.0%) | 13 (2.6%) |
| 90 or more Minutes | 45 (8.0%) | 0 (0.0%) |
Time of Departure to Work by Sex in Leavenworth
The most frequent times of departure to work in Leavenworth are 7:00 AM to 7:29 AM (120, 21.3%) for males and 10:00 AM to 10:59 AM (101, 19.9%) for females.
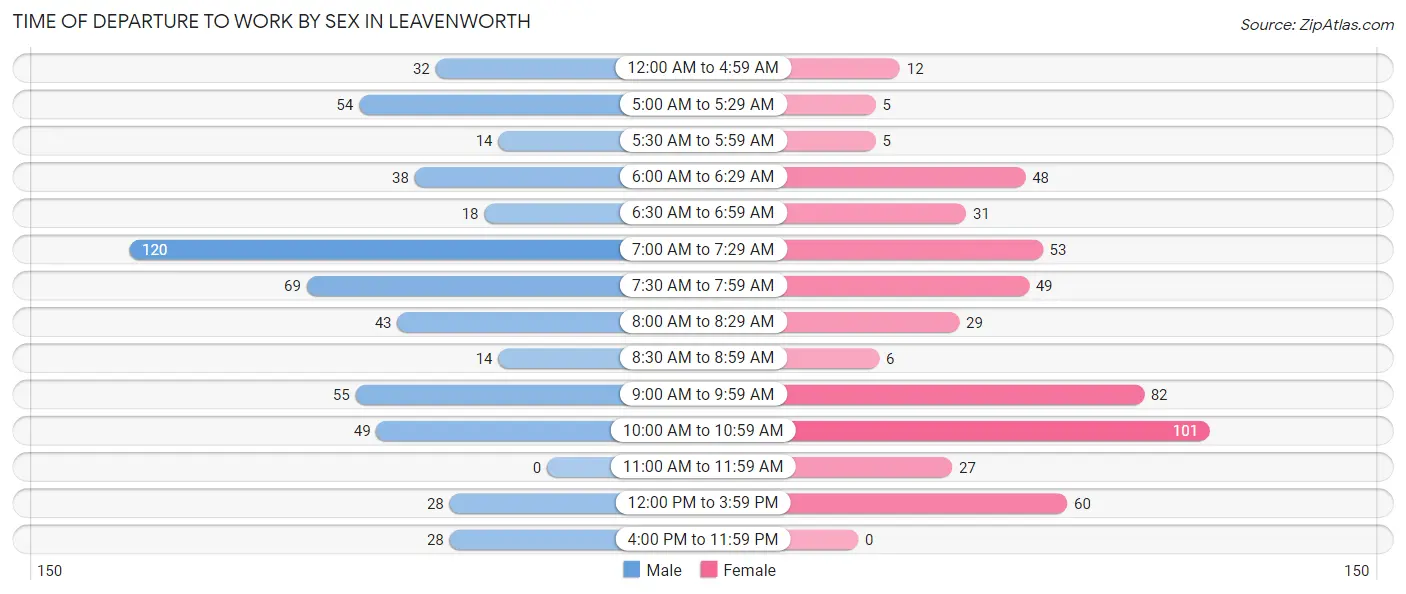
| Time of Departure | Male | Female |
| 12:00 AM to 4:59 AM | 32 (5.7%) | 12 (2.4%) |
| 5:00 AM to 5:29 AM | 54 (9.6%) | 5 (1.0%) |
| 5:30 AM to 5:59 AM | 14 (2.5%) | 5 (1.0%) |
| 6:00 AM to 6:29 AM | 38 (6.8%) | 48 (9.5%) |
| 6:30 AM to 6:59 AM | 18 (3.2%) | 31 (6.1%) |
| 7:00 AM to 7:29 AM | 120 (21.3%) | 53 (10.4%) |
| 7:30 AM to 7:59 AM | 69 (12.3%) | 49 (9.7%) |
| 8:00 AM to 8:29 AM | 43 (7.6%) | 29 (5.7%) |
| 8:30 AM to 8:59 AM | 14 (2.5%) | 6 (1.2%) |
| 9:00 AM to 9:59 AM | 55 (9.8%) | 82 (16.1%) |
| 10:00 AM to 10:59 AM | 49 (8.7%) | 101 (19.9%) |
| 11:00 AM to 11:59 AM | 0 (0.0%) | 27 (5.3%) |
| 12:00 PM to 3:59 PM | 28 (5.0%) | 60 (11.8%) |
| 4:00 PM to 11:59 PM | 28 (5.0%) | 0 (0.0%) |
| Total | 562 (100.0%) | 508 (100.0%) |
Housing Occupancy in Leavenworth
Occupancy by Ownership in Leavenworth
Of the total 1,154 dwellings in Leavenworth, owner-occupied units account for 617 (53.5%), while renter-occupied units make up 537 (46.5%).
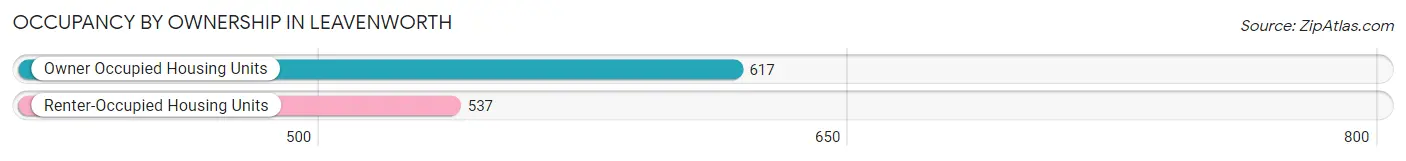
| Occupancy | # Housing Units | % Housing Units |
| Owner Occupied Housing Units | 617 | 53.5% |
| Renter-Occupied Housing Units | 537 | 46.5% |
| Total Occupied Housing Units | 1,154 | 100.0% |
Occupancy by Household Size in Leavenworth
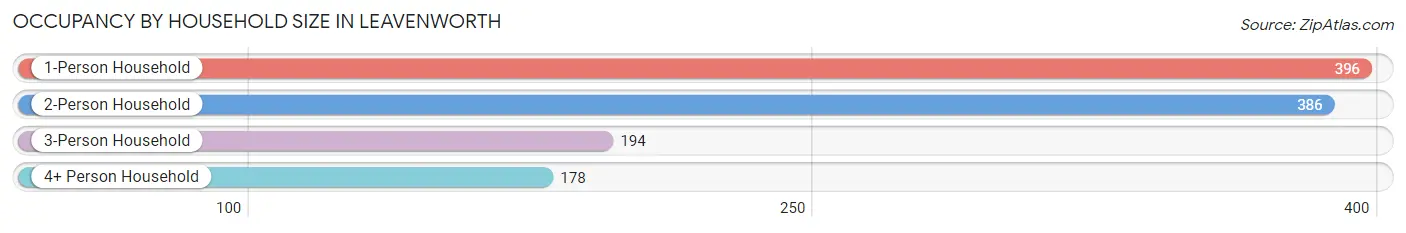
| Household Size | # Housing Units | % Housing Units |
| 1-Person Household | 396 | 34.3% |
| 2-Person Household | 386 | 33.5% |
| 3-Person Household | 194 | 16.8% |
| 4+ Person Household | 178 | 15.4% |
| Total Housing Units | 1,154 | 100.0% |
Occupancy by Ownership by Household Size in Leavenworth
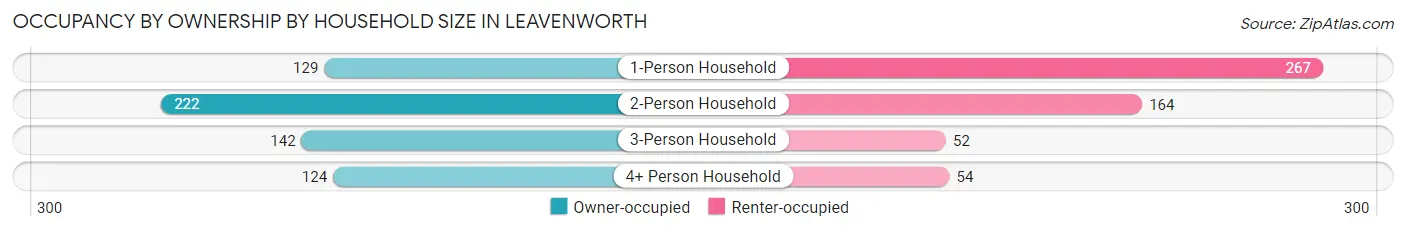
| Household Size | Owner-occupied | Renter-occupied |
| 1-Person Household | 129 (32.6%) | 267 (67.4%) |
| 2-Person Household | 222 (57.5%) | 164 (42.5%) |
| 3-Person Household | 142 (73.2%) | 52 (26.8%) |
| 4+ Person Household | 124 (69.7%) | 54 (30.3%) |
| Total Housing Units | 617 (53.5%) | 537 (46.5%) |
Occupancy by Educational Attainment in Leavenworth
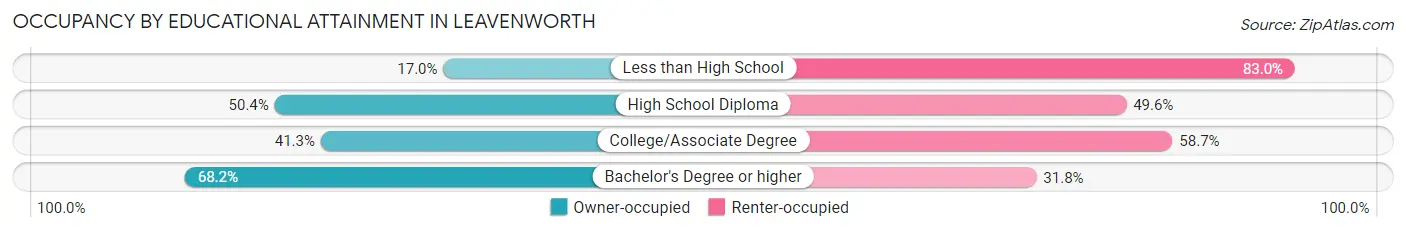
| Household Size | Owner-occupied | Renter-occupied |
| Less than High School | 9 (17.0%) | 44 (83.0%) |
| High School Diploma | 117 (50.4%) | 115 (49.6%) |
| College/Associate Degree | 156 (41.3%) | 222 (58.7%) |
| Bachelor's Degree or higher | 335 (68.2%) | 156 (31.8%) |
Occupancy by Age of Householder in Leavenworth
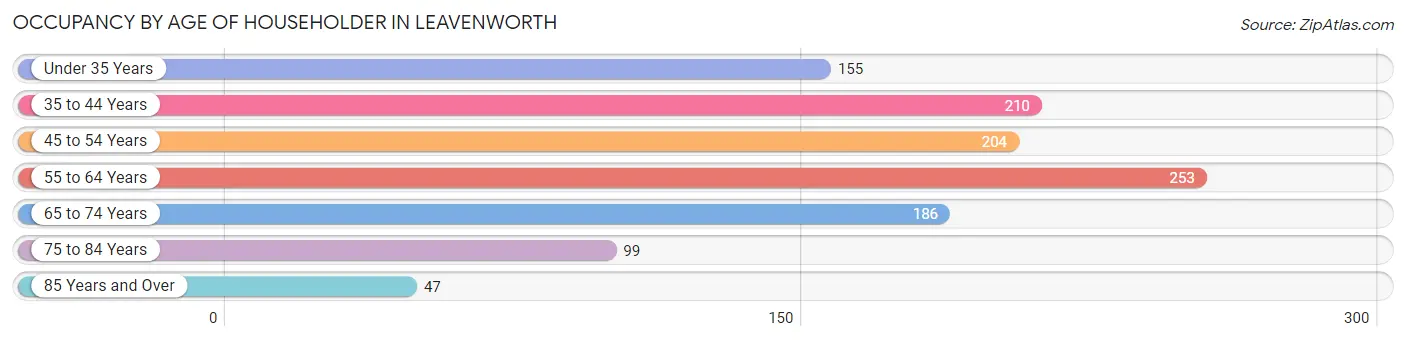
| Age Bracket | # Households | % Households |
| Under 35 Years | 155 | 13.4% |
| 35 to 44 Years | 210 | 18.2% |
| 45 to 54 Years | 204 | 17.7% |
| 55 to 64 Years | 253 | 21.9% |
| 65 to 74 Years | 186 | 16.1% |
| 75 to 84 Years | 99 | 8.6% |
| 85 Years and Over | 47 | 4.1% |
| Total | 1,154 | 100.0% |
Housing Finances in Leavenworth
Median Income by Occupancy in Leavenworth
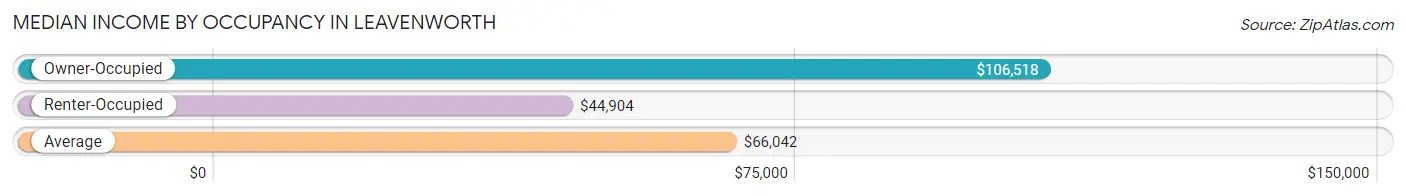
| Occupancy Type | # Households | Median Income |
| Owner-Occupied | 617 (53.5%) | $106,518 |
| Renter-Occupied | 537 (46.5%) | $44,904 |
| Average | 1,154 (100.0%) | $66,042 |
Occupancy by Householder Income Bracket in Leavenworth
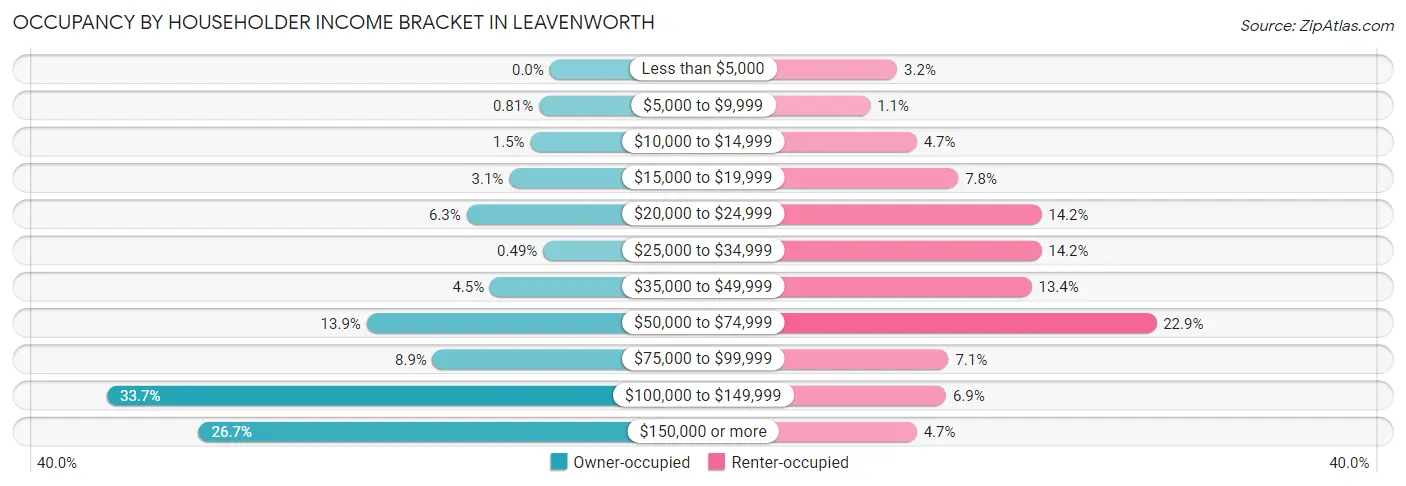
| Income Bracket | Owner-occupied | Renter-occupied |
| Less than $5,000 | 0 (0.0%) | 17 (3.2%) |
| $5,000 to $9,999 | 5 (0.8%) | 6 (1.1%) |
| $10,000 to $14,999 | 9 (1.5%) | 25 (4.7%) |
| $15,000 to $19,999 | 19 (3.1%) | 42 (7.8%) |
| $20,000 to $24,999 | 39 (6.3%) | 76 (14.1%) |
| $25,000 to $34,999 | 3 (0.5%) | 76 (14.1%) |
| $35,000 to $49,999 | 28 (4.5%) | 72 (13.4%) |
| $50,000 to $74,999 | 86 (13.9%) | 123 (22.9%) |
| $75,000 to $99,999 | 55 (8.9%) | 38 (7.1%) |
| $100,000 to $149,999 | 208 (33.7%) | 37 (6.9%) |
| $150,000 or more | 165 (26.7%) | 25 (4.7%) |
| Total | 617 (100.0%) | 537 (100.0%) |
Monthly Housing Cost Tiers in Leavenworth
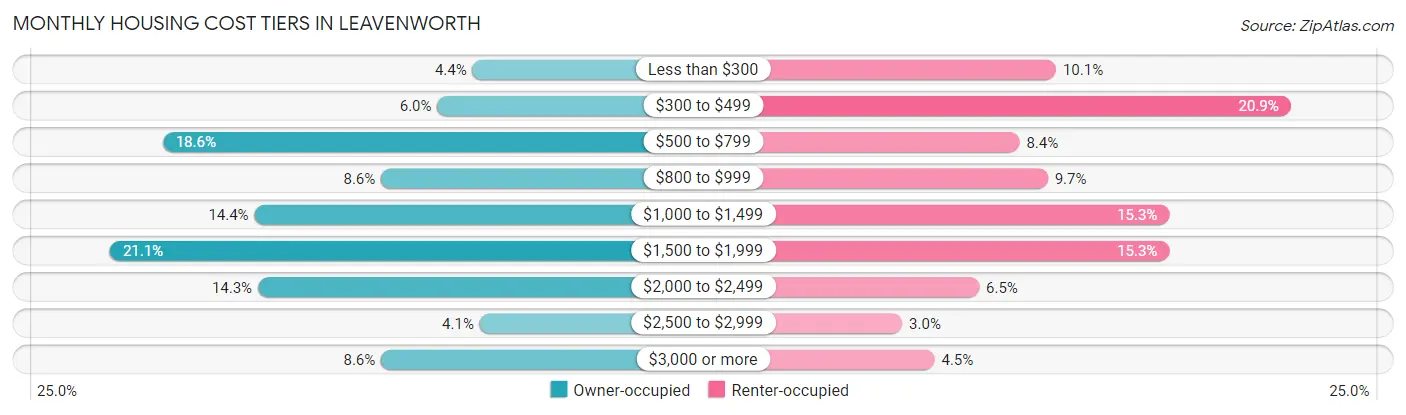
| Monthly Cost | Owner-occupied | Renter-occupied |
| Less than $300 | 27 (4.4%) | 54 (10.1%) |
| $300 to $499 | 37 (6.0%) | 112 (20.9%) |
| $500 to $799 | 115 (18.6%) | 45 (8.4%) |
| $800 to $999 | 53 (8.6%) | 52 (9.7%) |
| $1,000 to $1,499 | 89 (14.4%) | 82 (15.3%) |
| $1,500 to $1,999 | 130 (21.1%) | 82 (15.3%) |
| $2,000 to $2,499 | 88 (14.3%) | 35 (6.5%) |
| $2,500 to $2,999 | 25 (4.1%) | 16 (3.0%) |
| $3,000 or more | 53 (8.6%) | 24 (4.5%) |
| Total | 617 (100.0%) | 537 (100.0%) |
Physical Housing Characteristics in Leavenworth
Housing Structures in Leavenworth
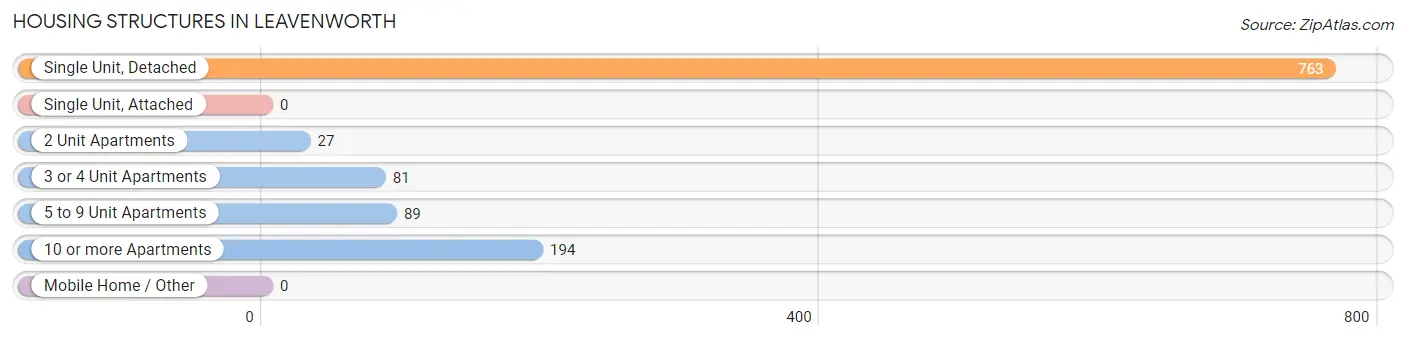
| Structure Type | # Housing Units | % Housing Units |
| Single Unit, Detached | 763 | 66.1% |
| Single Unit, Attached | 0 | 0.0% |
| 2 Unit Apartments | 27 | 2.3% |
| 3 or 4 Unit Apartments | 81 | 7.0% |
| 5 to 9 Unit Apartments | 89 | 7.7% |
| 10 or more Apartments | 194 | 16.8% |
| Mobile Home / Other | 0 | 0.0% |
| Total | 1,154 | 100.0% |
Housing Structures by Occupancy in Leavenworth
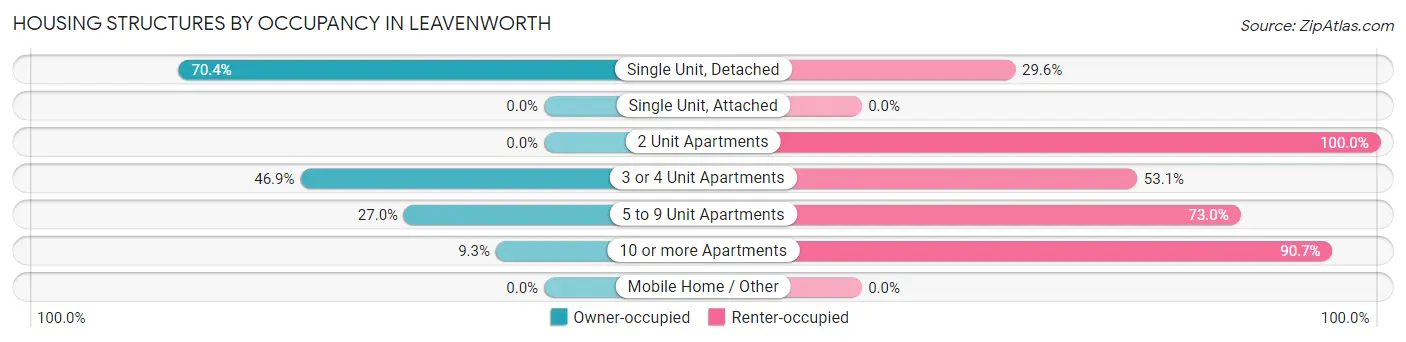
| Structure Type | Owner-occupied | Renter-occupied |
| Single Unit, Detached | 537 (70.4%) | 226 (29.6%) |
| Single Unit, Attached | 0 (0.0%) | 0 (0.0%) |
| 2 Unit Apartments | 0 (0.0%) | 27 (100.0%) |
| 3 or 4 Unit Apartments | 38 (46.9%) | 43 (53.1%) |
| 5 to 9 Unit Apartments | 24 (27.0%) | 65 (73.0%) |
| 10 or more Apartments | 18 (9.3%) | 176 (90.7%) |
| Mobile Home / Other | 0 (0.0%) | 0 (0.0%) |
| Total | 617 (53.5%) | 537 (46.5%) |
Housing Structures by Number of Rooms in Leavenworth
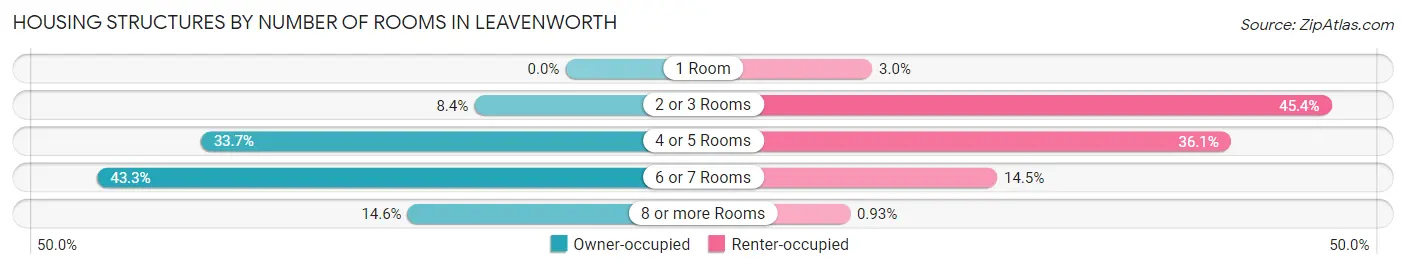
| Number of Rooms | Owner-occupied | Renter-occupied |
| 1 Room | 0 (0.0%) | 16 (3.0%) |
| 2 or 3 Rooms | 52 (8.4%) | 244 (45.4%) |
| 4 or 5 Rooms | 208 (33.7%) | 194 (36.1%) |
| 6 or 7 Rooms | 267 (43.3%) | 78 (14.5%) |
| 8 or more Rooms | 90 (14.6%) | 5 (0.9%) |
| Total | 617 (100.0%) | 537 (100.0%) |
Housing Structure by Heating Type in Leavenworth
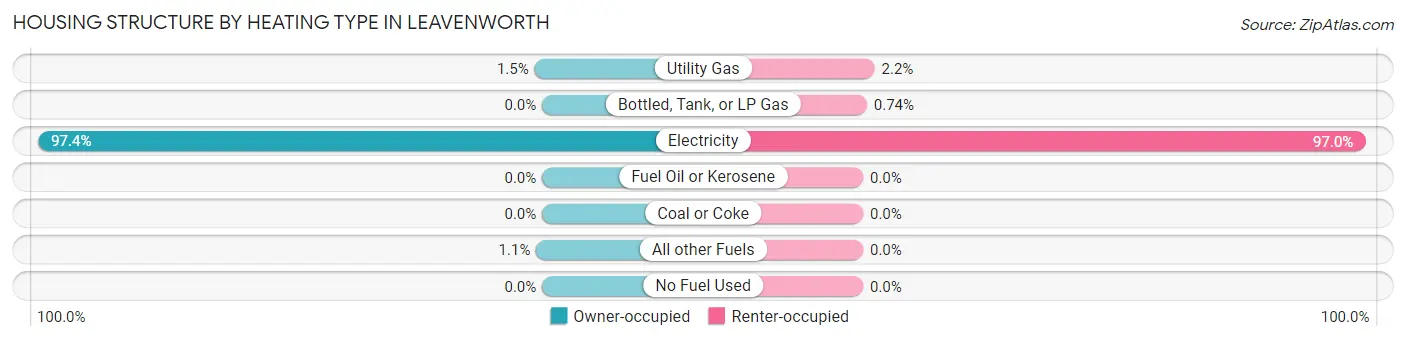
| Heating Type | Owner-occupied | Renter-occupied |
| Utility Gas | 9 (1.5%) | 12 (2.2%) |
| Bottled, Tank, or LP Gas | 0 (0.0%) | 4 (0.7%) |
| Electricity | 601 (97.4%) | 521 (97.0%) |
| Fuel Oil or Kerosene | 0 (0.0%) | 0 (0.0%) |
| Coal or Coke | 0 (0.0%) | 0 (0.0%) |
| All other Fuels | 7 (1.1%) | 0 (0.0%) |
| No Fuel Used | 0 (0.0%) | 0 (0.0%) |
| Total | 617 (100.0%) | 537 (100.0%) |
Household Vehicle Usage in Leavenworth
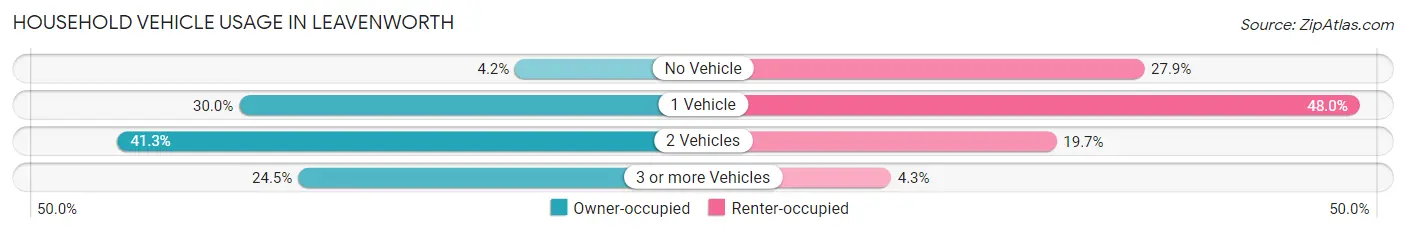
| Vehicles per Household | Owner-occupied | Renter-occupied |
| No Vehicle | 26 (4.2%) | 150 (27.9%) |
| 1 Vehicle | 185 (30.0%) | 258 (48.0%) |
| 2 Vehicles | 255 (41.3%) | 106 (19.7%) |
| 3 or more Vehicles | 151 (24.5%) | 23 (4.3%) |
| Total | 617 (100.0%) | 537 (100.0%) |
Real Estate & Mortgages in Leavenworth
Real Estate and Mortgage Overview in Leavenworth
| Characteristic | Without Mortgage | With Mortgage |
| Housing Units | 222 | 395 |
| Median Property Value | $455,300 | $519,800 |
| Median Household Income | $100,536 | $122 |
| Monthly Housing Costs | $594 | $53 |
| Real Estate Taxes | $3,511 | $0 |
Property Value by Mortgage Status in Leavenworth
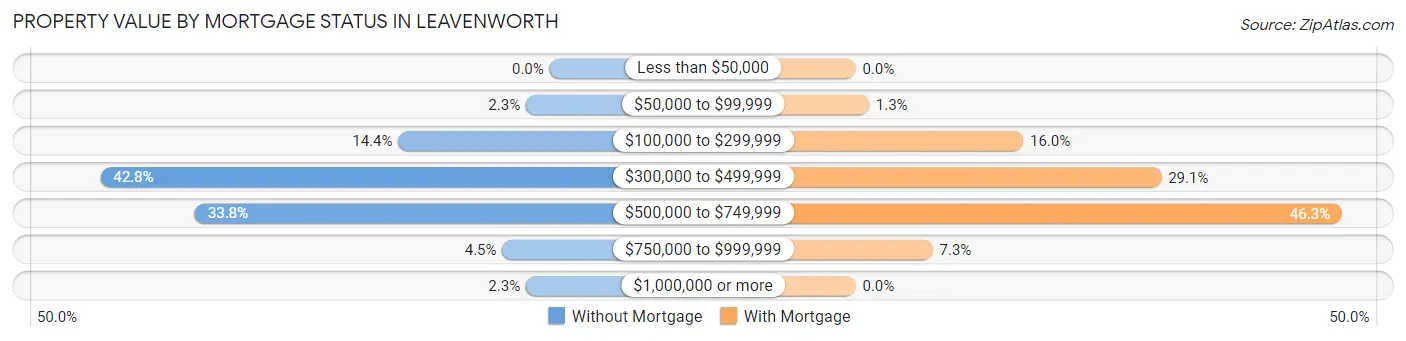
| Property Value | Without Mortgage | With Mortgage |
| Less than $50,000 | 0 (0.0%) | 0 (0.0%) |
| $50,000 to $99,999 | 5 (2.2%) | 5 (1.3%) |
| $100,000 to $299,999 | 32 (14.4%) | 63 (16.0%) |
| $300,000 to $499,999 | 95 (42.8%) | 115 (29.1%) |
| $500,000 to $749,999 | 75 (33.8%) | 183 (46.3%) |
| $750,000 to $999,999 | 10 (4.5%) | 29 (7.3%) |
| $1,000,000 or more | 5 (2.2%) | 0 (0.0%) |
| Total | 222 (100.0%) | 395 (100.0%) |
Household Income by Mortgage Status in Leavenworth
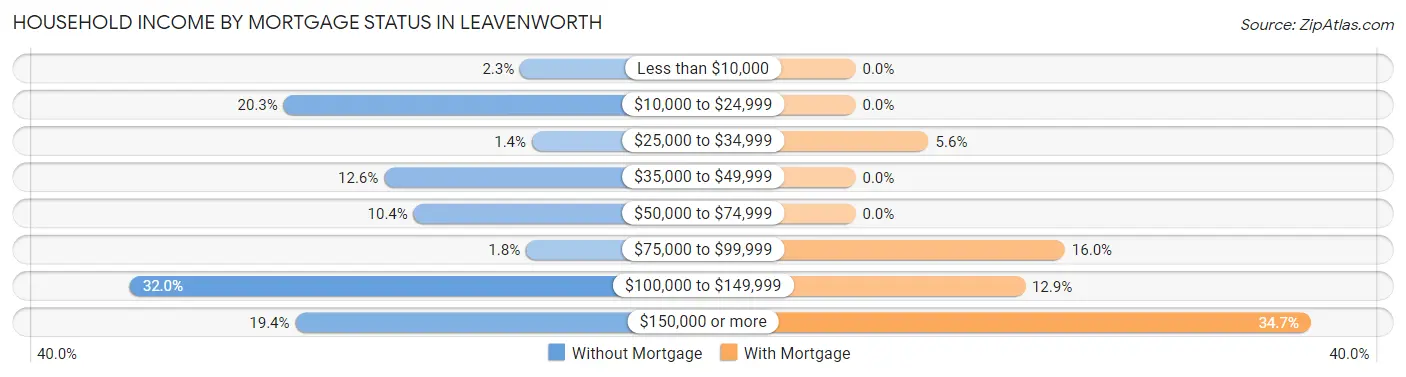
| Household Income | Without Mortgage | With Mortgage |
| Less than $10,000 | 5 (2.2%) | 0 (0.0%) |
| $10,000 to $24,999 | 45 (20.3%) | 0 (0.0%) |
| $25,000 to $34,999 | 3 (1.3%) | 22 (5.6%) |
| $35,000 to $49,999 | 28 (12.6%) | 0 (0.0%) |
| $50,000 to $74,999 | 23 (10.4%) | 0 (0.0%) |
| $75,000 to $99,999 | 4 (1.8%) | 63 (16.0%) |
| $100,000 to $149,999 | 71 (32.0%) | 51 (12.9%) |
| $150,000 or more | 43 (19.4%) | 137 (34.7%) |
| Total | 222 (100.0%) | 395 (100.0%) |
Property Value to Household Income Ratio in Leavenworth
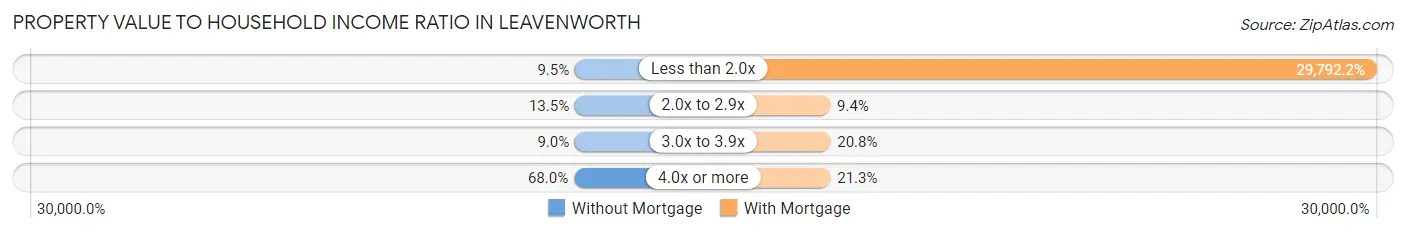
| Value-to-Income Ratio | Without Mortgage | With Mortgage |
| Less than 2.0x | 21 (9.5%) | 117,679 (29,792.1%) |
| 2.0x to 2.9x | 30 (13.5%) | 37 (9.4%) |
| 3.0x to 3.9x | 20 (9.0%) | 82 (20.8%) |
| 4.0x or more | 151 (68.0%) | 84 (21.3%) |
| Total | 222 (100.0%) | 395 (100.0%) |
Real Estate Taxes by Mortgage Status in Leavenworth
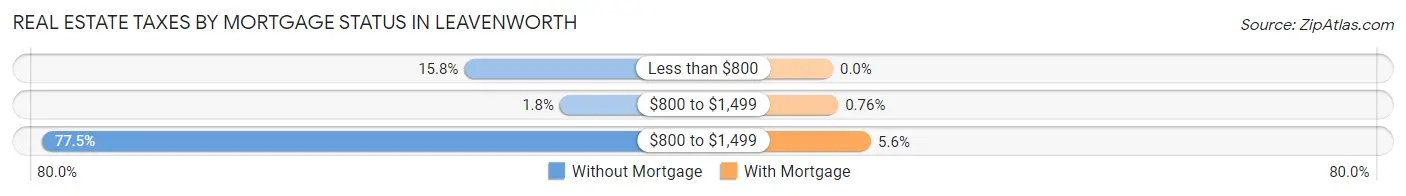
| Property Taxes | Without Mortgage | With Mortgage |
| Less than $800 | 35 (15.8%) | 0 (0.0%) |
| $800 to $1,499 | 4 (1.8%) | 3 (0.8%) |
| $800 to $1,499 | 172 (77.5%) | 22 (5.6%) |
| Total | 222 (100.0%) | 395 (100.0%) |
Health & Disability in Leavenworth
Health Insurance Coverage by Age in Leavenworth
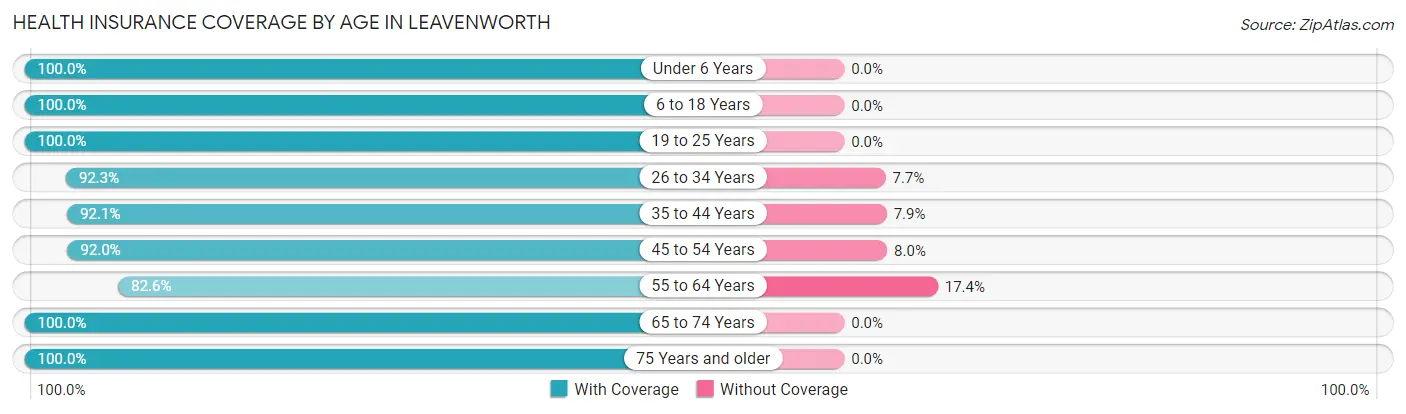
| Age Bracket | With Coverage | Without Coverage |
| Under 6 Years | 179 (100.0%) | 0 (0.0%) |
| 6 to 18 Years | 406 (100.0%) | 0 (0.0%) |
| 19 to 25 Years | 162 (100.0%) | 0 (0.0%) |
| 26 to 34 Years | 216 (92.3%) | 18 (7.7%) |
| 35 to 44 Years | 431 (92.1%) | 37 (7.9%) |
| 45 to 54 Years | 265 (92.0%) | 23 (8.0%) |
| 55 to 64 Years | 322 (82.6%) | 68 (17.4%) |
| 65 to 74 Years | 296 (100.0%) | 0 (0.0%) |
| 75 Years and older | 183 (100.0%) | 0 (0.0%) |
| Total | 2,460 (94.4%) | 146 (5.6%) |
Health Insurance Coverage by Citizenship Status in Leavenworth
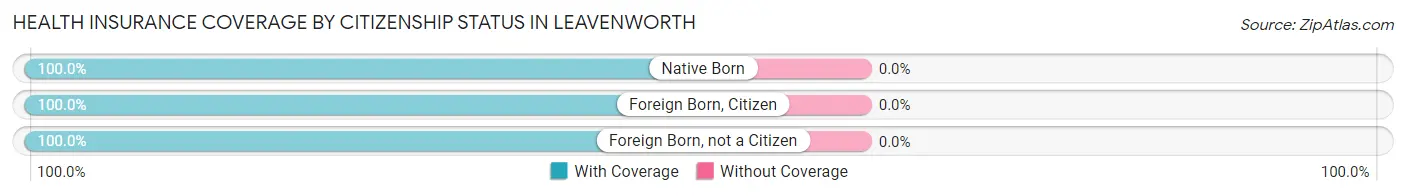
| Citizenship Status | With Coverage | Without Coverage |
| Native Born | 179 (100.0%) | 0 (0.0%) |
| Foreign Born, Citizen | 406 (100.0%) | 0 (0.0%) |
| Foreign Born, not a Citizen | 162 (100.0%) | 0 (0.0%) |
Health Insurance Coverage by Household Income in Leavenworth
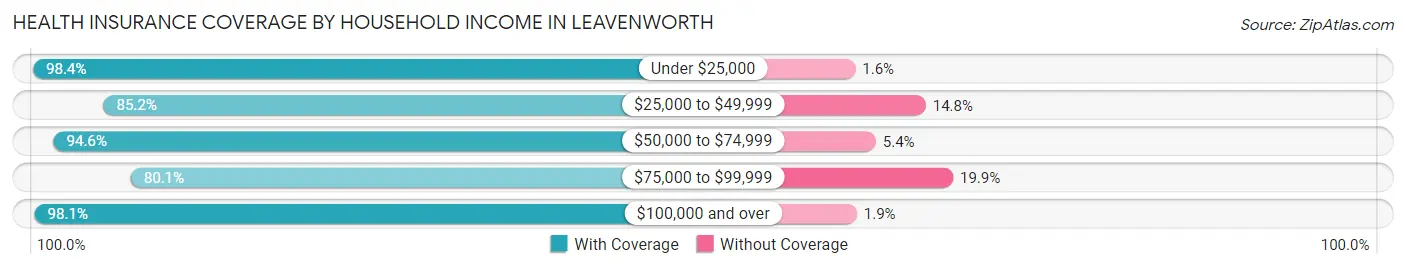
| Household Income | With Coverage | Without Coverage |
| Under $25,000 | 308 (98.4%) | 5 (1.6%) |
| $25,000 to $49,999 | 259 (85.2%) | 45 (14.8%) |
| $50,000 to $74,999 | 469 (94.6%) | 27 (5.4%) |
| $75,000 to $99,999 | 181 (80.1%) | 45 (19.9%) |
| $100,000 and over | 1,243 (98.1%) | 24 (1.9%) |
Public vs Private Health Insurance Coverage by Age in Leavenworth
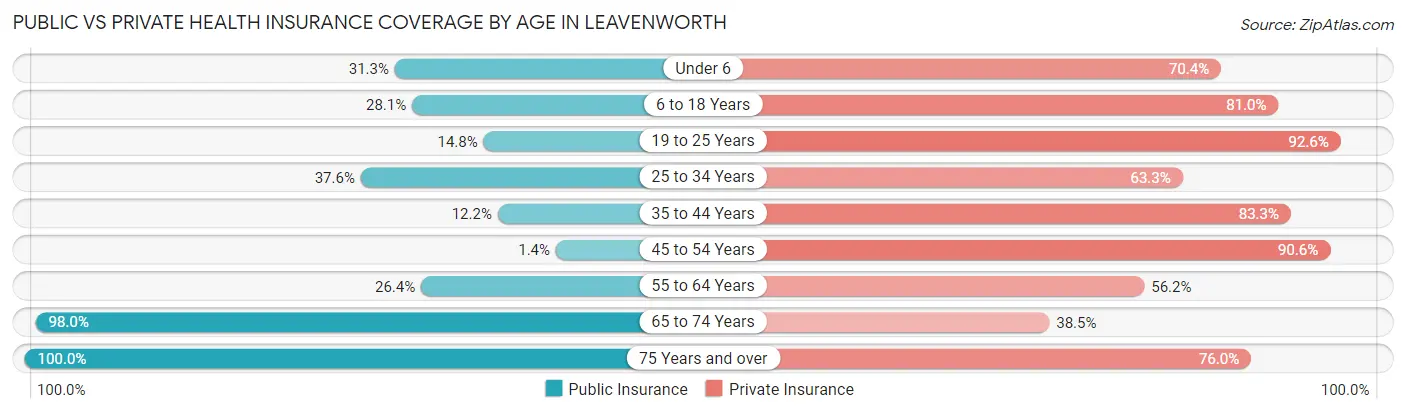
| Age Bracket | Public Insurance | Private Insurance |
| Under 6 | 56 (31.3%) | 126 (70.4%) |
| 6 to 18 Years | 114 (28.1%) | 329 (81.0%) |
| 19 to 25 Years | 24 (14.8%) | 150 (92.6%) |
| 25 to 34 Years | 88 (37.6%) | 148 (63.2%) |
| 35 to 44 Years | 57 (12.2%) | 390 (83.3%) |
| 45 to 54 Years | 4 (1.4%) | 261 (90.6%) |
| 55 to 64 Years | 103 (26.4%) | 219 (56.1%) |
| 65 to 74 Years | 290 (98.0%) | 114 (38.5%) |
| 75 Years and over | 183 (100.0%) | 139 (76.0%) |
| Total | 919 (35.3%) | 1,876 (72.0%) |
Disability Status by Sex by Age in Leavenworth
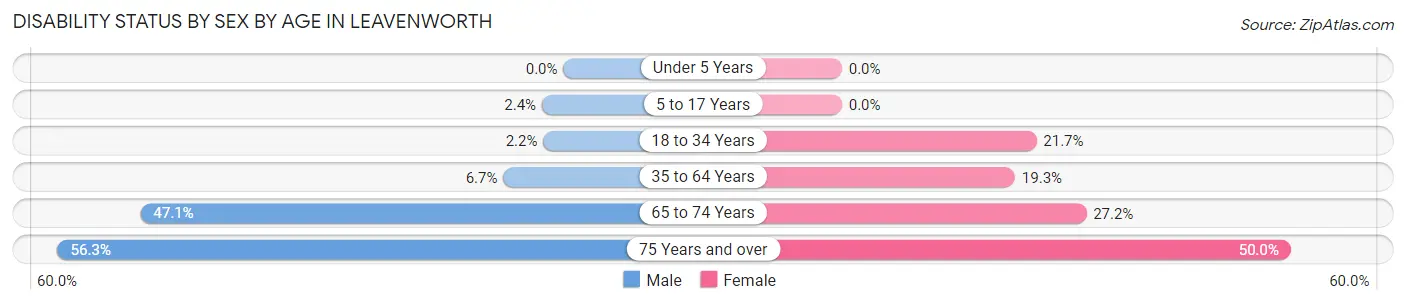
| Age Bracket | Male | Female |
| Under 5 Years | 0 (0.0%) | 0 (0.0%) |
| 5 to 17 Years | 5 (2.4%) | 0 (0.0%) |
| 18 to 34 Years | 4 (2.2%) | 52 (21.7%) |
| 35 to 64 Years | 43 (6.7%) | 97 (19.3%) |
| 65 to 74 Years | 65 (47.1%) | 43 (27.2%) |
| 75 Years and over | 49 (56.3%) | 48 (50.0%) |
Disability Class by Sex by Age in Leavenworth
Disability Class: Hearing Difficulty
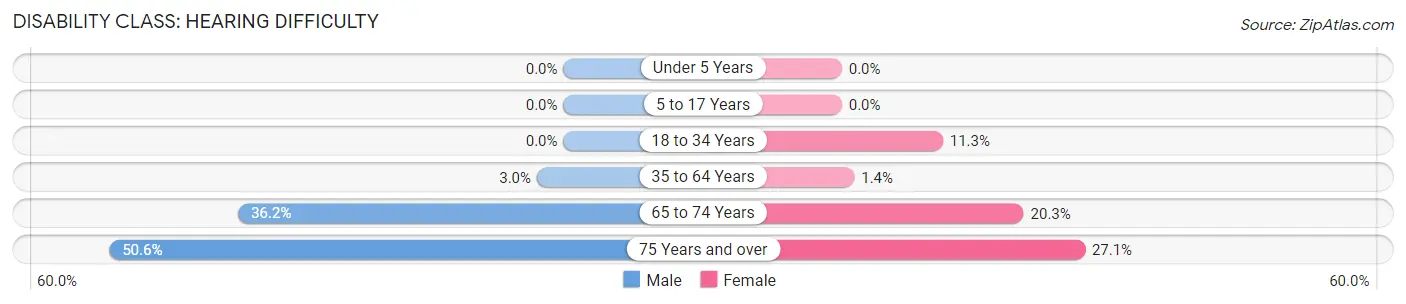
| Age Bracket | Male | Female |
| Under 5 Years | 0 (0.0%) | 0 (0.0%) |
| 5 to 17 Years | 0 (0.0%) | 0 (0.0%) |
| 18 to 34 Years | 0 (0.0%) | 27 (11.3%) |
| 35 to 64 Years | 19 (2.9%) | 7 (1.4%) |
| 65 to 74 Years | 50 (36.2%) | 32 (20.3%) |
| 75 Years and over | 44 (50.6%) | 26 (27.1%) |
Disability Class: Vision Difficulty
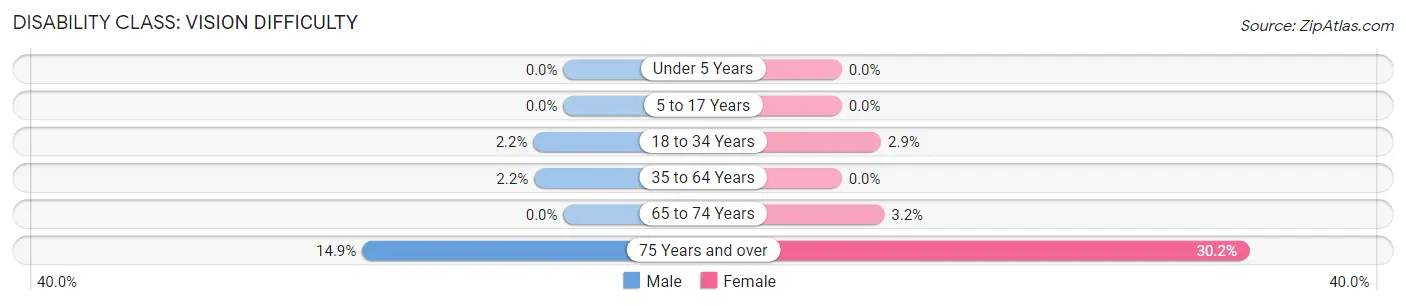
| Age Bracket | Male | Female |
| Under 5 Years | 0 (0.0%) | 0 (0.0%) |
| 5 to 17 Years | 0 (0.0%) | 0 (0.0%) |
| 18 to 34 Years | 4 (2.2%) | 7 (2.9%) |
| 35 to 64 Years | 14 (2.2%) | 0 (0.0%) |
| 65 to 74 Years | 0 (0.0%) | 5 (3.2%) |
| 75 Years and over | 13 (14.9%) | 29 (30.2%) |
Disability Class: Cognitive Difficulty
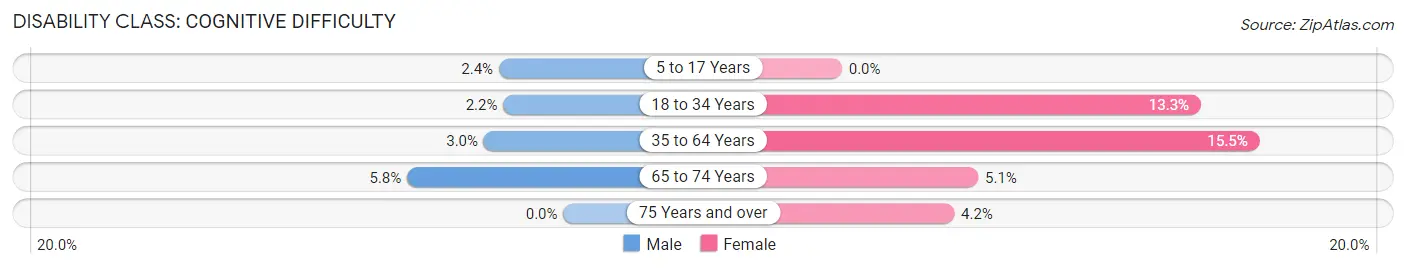
| Age Bracket | Male | Female |
| 5 to 17 Years | 5 (2.4%) | 0 (0.0%) |
| 18 to 34 Years | 4 (2.2%) | 32 (13.3%) |
| 35 to 64 Years | 19 (2.9%) | 78 (15.5%) |
| 65 to 74 Years | 8 (5.8%) | 8 (5.1%) |
| 75 Years and over | 0 (0.0%) | 4 (4.2%) |
Disability Class: Ambulatory Difficulty
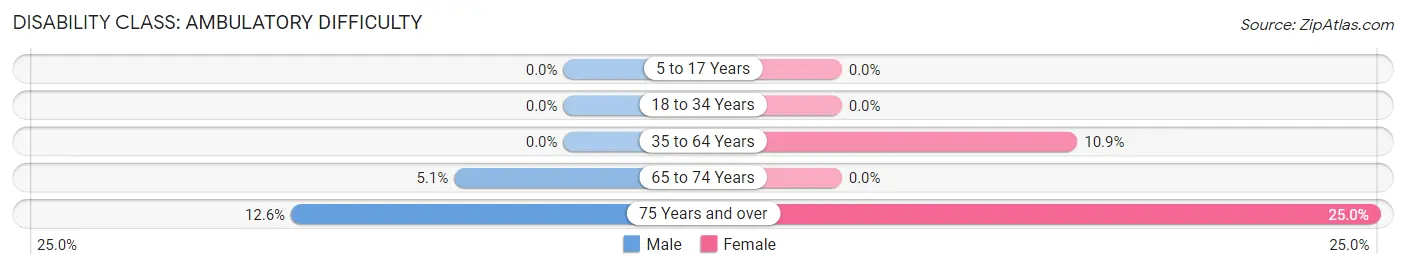
| Age Bracket | Male | Female |
| 5 to 17 Years | 0 (0.0%) | 0 (0.0%) |
| 18 to 34 Years | 0 (0.0%) | 0 (0.0%) |
| 35 to 64 Years | 0 (0.0%) | 55 (10.9%) |
| 65 to 74 Years | 7 (5.1%) | 0 (0.0%) |
| 75 Years and over | 11 (12.6%) | 24 (25.0%) |
Disability Class: Self-Care Difficulty
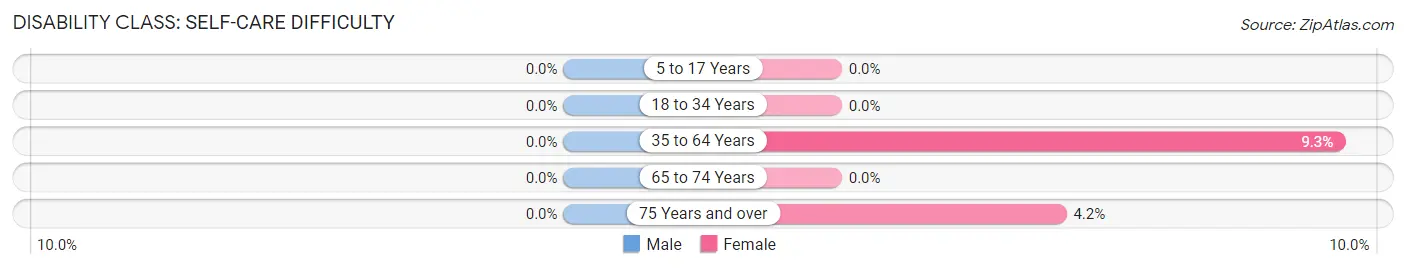
| Age Bracket | Male | Female |
| 5 to 17 Years | 0 (0.0%) | 0 (0.0%) |
| 18 to 34 Years | 0 (0.0%) | 0 (0.0%) |
| 35 to 64 Years | 0 (0.0%) | 47 (9.3%) |
| 65 to 74 Years | 0 (0.0%) | 0 (0.0%) |
| 75 Years and over | 0 (0.0%) | 4 (4.2%) |
Technology Access in Leavenworth
Computing Device Access in Leavenworth
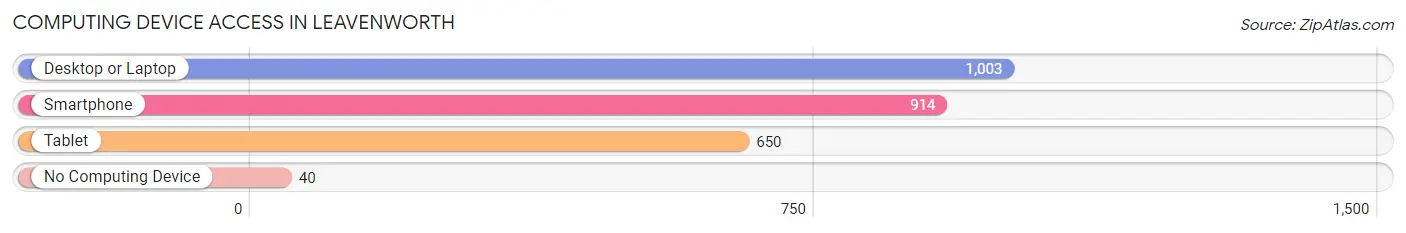
| Device Type | # Households | % Households |
| Desktop or Laptop | 1,003 | 86.9% |
| Smartphone | 914 | 79.2% |
| Tablet | 650 | 56.3% |
| No Computing Device | 40 | 3.5% |
| Total | 1,154 | 100.0% |
Internet Access in Leavenworth
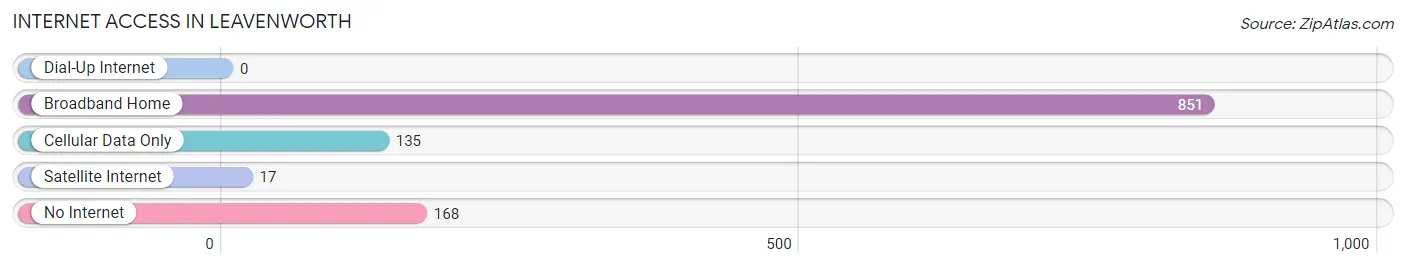
| Internet Type | # Households | % Households |
| Dial-Up Internet | 0 | 0.0% |
| Broadband Home | 851 | 73.7% |
| Cellular Data Only | 135 | 11.7% |
| Satellite Internet | 17 | 1.5% |
| No Internet | 168 | 14.6% |
| Total | 1,154 | 100.0% |
Leavenworth Summary
Leavenworth, Washington is a small town located in the Cascade Mountains of Chelan County, Washington. It is situated along the Wenatchee River, approximately two hours east of Seattle. The town is known for its Bavarian-style architecture, which was adopted in the 1960s to attract tourists. The population of Leavenworth was 2,074 at the 2010 census.
History
Leavenworth was founded in 1906 as a railroad town. The Great Northern Railway built a line through the area, and the town was named after railroad official and former Civil War general Henry Leavenworth. The town was incorporated in 1906 and was initially a logging and farming community.
In the 1960s, the town was in decline and the local chamber of commerce decided to adopt a Bavarian theme to attract tourists. The town was remodeled to resemble a Bavarian village, with buildings painted in bright colors and adorned with window boxes and flower baskets. The transformation was successful and the town has become a popular tourist destination.
Geography
Leavenworth is located in the Cascade Mountains of Chelan County, Washington. It is situated along the Wenatchee River, approximately two hours east of Seattle. The town is surrounded by the Wenatchee National Forest and is close to several ski resorts, including Stevens Pass and Mission Ridge.
The climate in Leavenworth is generally mild, with warm summers and cold winters. The average high temperature in July is 85°F (29°C) and the average low temperature in January is 22°F (-6°C).
Economy
Leavenworth’s economy is largely based on tourism. The town is a popular destination for outdoor activities such as skiing, hiking, and camping. It is also home to several wineries and breweries, as well as a variety of shops and restaurants.
The town is also home to several manufacturing companies, including a wood products company and a metal fabrication company. The town is also home to a number of government agencies, including the U.S. Forest Service and the Bureau of Reclamation.
Demographics
As of the 2010 census, the population of Leavenworth was 2,074. The racial makeup of the town was 94.3% White, 0.7% African American, 0.7% Native American, 0.7% Asian, 0.2% Pacific Islander, 1.2% from other races, and 2.1% from two or more races. Hispanic or Latino of any race were 4.2% of the population.
The median income for a household in Leavenworth was $41,944, and the median income for a family was $50,000. The per capita income for the town was $22,845. About 11.2% of families and 14.2% of the population were below the poverty line, including 18.2% of those under age 18 and 8.2% of those age 65 or over.
Common Questions
What is Per Capita Income in Leavenworth?
Per Capita income in Leavenworth is $41,683.
What is the Median Family Income in Leavenworth?
Median Family Income in Leavenworth is $101,208.
What is the Median Household income in Leavenworth?
Median Household Income in Leavenworth is $66,042.
What is Income or Wage Gap in Leavenworth?
Income or Wage Gap in Leavenworth is 48.6%.
Women in Leavenworth earn 51.4 cents for every dollar earned by a man.
What is Inequality or Gini Index in Leavenworth?
Inequality or Gini Index in Leavenworth is 0.45.
What is the Total Population of Leavenworth?
Total Population of Leavenworth is 2,619.
What is the Total Male Population of Leavenworth?
Total Male Population of Leavenworth is 1,295.
What is the Total Female Population of Leavenworth?
Total Female Population of Leavenworth is 1,324.
What is the Ratio of Males per 100 Females in Leavenworth?
There are 97.81 Males per 100 Females in Leavenworth.
What is the Ratio of Females per 100 Males in Leavenworth?
There are 102.24 Females per 100 Males in Leavenworth.
What is the Median Population Age in Leavenworth?
Median Population Age in Leavenworth is 40.9 Years.
What is the Average Family Size in Leavenworth
Average Family Size in Leavenworth is 3.0 People.
What is the Average Household Size in Leavenworth
Average Household Size in Leavenworth is 2.3 People.
How Large is the Labor Force in Leavenworth?
There are 1,313 People in the Labor Forcein in Leavenworth.
What is the Percentage of People in the Labor Force in Leavenworth?
61.1% of People are in the Labor Force in Leavenworth.
What is the Unemployment Rate in Leavenworth?
Unemployment Rate in Leavenworth is 0.3%.