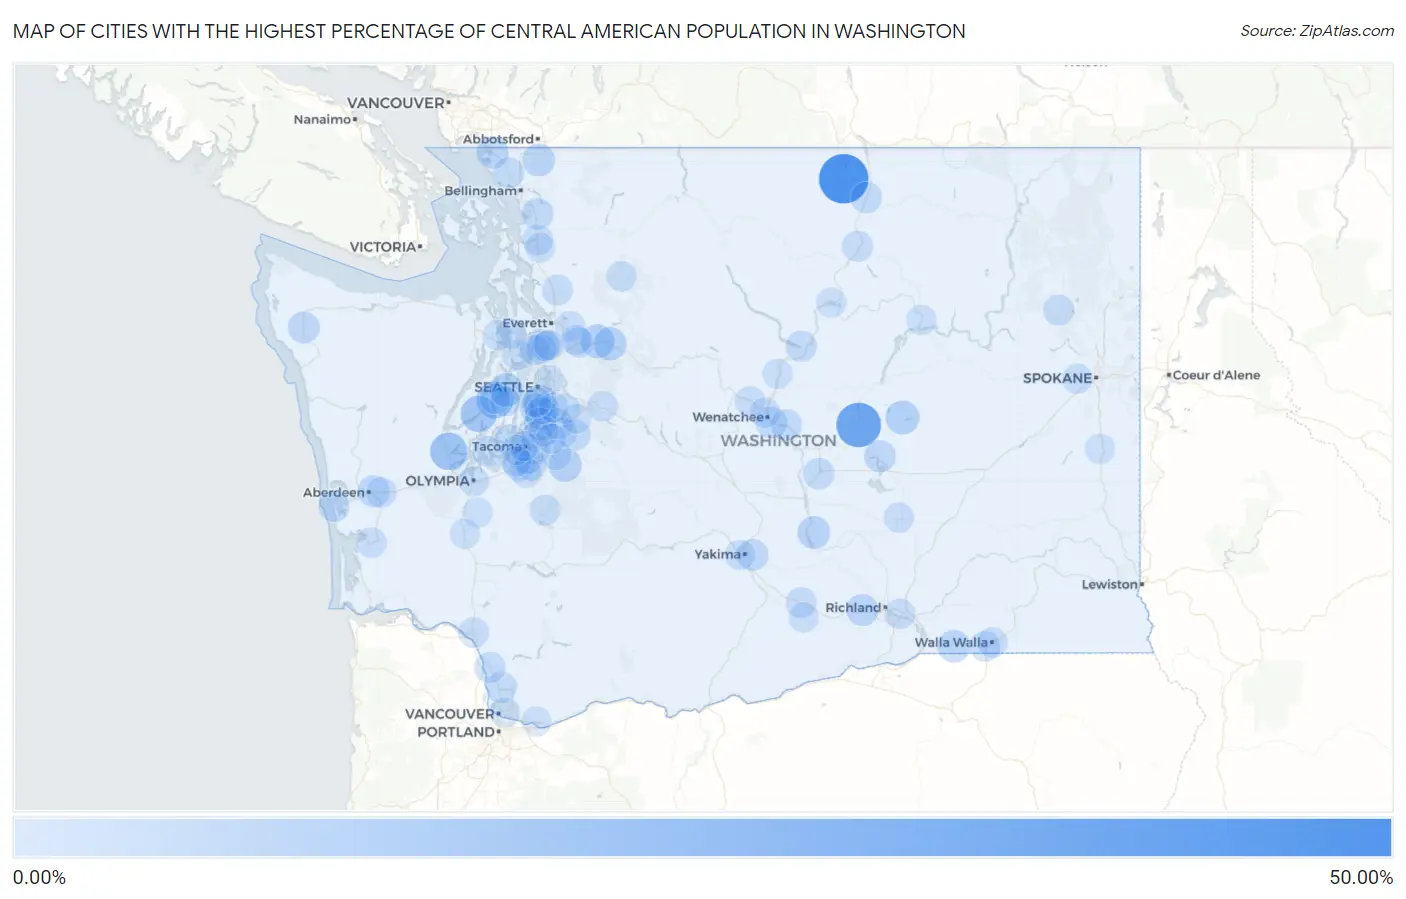
Cities with the Highest Percentage of Central American Population in Washington
RELATED REPORTS & OPTIONS
Central American
Washington
Compare Cities
Map of Cities with the Highest Percentage of Central American Population in Washington
0.00%
50.00%
Cities with the Highest Percentage of Central American Population in Washington
| City | Central American | vs State | vs National | |
| 1. | Loomis | 42.86% | 0.95%(+41.9)#1 | 1.81%(+41.0)#16 |
| 2. | Lakeview | 32.08% | 0.95%(+31.1)#2 | 1.81%(+30.3)#53 |
| 3. | Shelton | 16.05% | 0.95%(+15.1)#3 | 1.81%(+14.2)#211 |
| 4. | Gorst | 15.15% | 0.95%(+14.2)#4 | 1.81%(+13.3)#240 |
| 5. | Belfair | 13.99% | 0.95%(+13.0)#5 | 1.81%(+12.2)#274 |
| 6. | Beverly | 12.99% | 0.95%(+12.0)#6 | 1.81%(+11.2)#305 |
| 7. | Enetai | 8.77% | 0.95%(+7.82)#7 | 1.81%(+6.96)#520 |
| 8. | Wilson Creek | 8.62% | 0.95%(+7.67)#8 | 1.81%(+6.81)#530 |
| 9. | Sultan | 8.50% | 0.95%(+7.54)#9 | 1.81%(+6.68)#544 |
| 10. | Gold Bar | 7.74% | 0.95%(+6.79)#10 | 1.81%(+5.93)#624 |
| 11. | South Prairie | 7.65% | 0.95%(+6.70)#11 | 1.81%(+5.84)#634 |
| 12. | Mattawa | 6.47% | 0.95%(+5.52)#12 | 1.81%(+4.66)#811 |
| 13. | Boulevard Park | 6.33% | 0.95%(+5.37)#13 | 1.81%(+4.51)#834 |
| 14. | Nooksack | 6.14% | 0.95%(+5.19)#14 | 1.81%(+4.33)#865 |
| 15. | Touchet | 5.77% | 0.95%(+4.82)#15 | 1.81%(+3.96)#936 |
| 16. | Seatac | 5.48% | 0.95%(+4.52)#16 | 1.81%(+3.66)#1,008 |
| 17. | Blaine | 5.27% | 0.95%(+4.32)#17 | 1.81%(+3.46)#1,062 |
| 18. | Benton City | 5.17% | 0.95%(+4.22)#18 | 1.81%(+3.36)#1,088 |
| 19. | Burien | 5.15% | 0.95%(+4.20)#19 | 1.81%(+3.34)#1,092 |
| 20. | Aberdeen | 4.93% | 0.95%(+3.97)#20 | 1.81%(+3.11)#1,136 |
| 21. | Moses Lake North | 4.92% | 0.95%(+3.97)#21 | 1.81%(+3.11)#1,137 |
| 22. | Des Moines | 4.84% | 0.95%(+3.88)#22 | 1.81%(+3.02)#1,158 |
| 23. | Forks | 4.70% | 0.95%(+3.75)#23 | 1.81%(+2.89)#1,192 |
| 24. | Terrace Heights | 4.41% | 0.95%(+3.45)#24 | 1.81%(+2.59)#1,279 |
| 25. | Alger | 4.12% | 0.95%(+3.17)#25 | 1.81%(+2.31)#1,385 |
| 26. | South Wenatchee | 4.10% | 0.95%(+3.15)#26 | 1.81%(+2.29)#1,389 |
| 27. | North Lynnwood | 4.00% | 0.95%(+3.05)#27 | 1.81%(+2.19)#1,426 |
| 28. | George | 3.81% | 0.95%(+2.86)#28 | 1.81%(+2.00)#1,490 |
| 29. | Tonasket | 3.73% | 0.95%(+2.78)#29 | 1.81%(+1.92)#1,516 |
| 30. | Mcchord Afb | 3.73% | 0.95%(+2.77)#30 | 1.81%(+1.91)#1,519 |
| 31. | Rock Island | 3.65% | 0.95%(+2.70)#31 | 1.81%(+1.84)#1,549 |
| 32. | Duluth | 3.54% | 0.95%(+2.58)#32 | 1.81%(+1.72)#1,601 |
| 33. | Fife | 3.43% | 0.95%(+2.47)#33 | 1.81%(+1.61)#1,662 |
| 34. | Black Diamond | 3.42% | 0.95%(+2.47)#34 | 1.81%(+1.61)#1,663 |
| 35. | Chelan | 3.37% | 0.95%(+2.42)#35 | 1.81%(+1.56)#1,687 |
| 36. | Wollochet | 3.24% | 0.95%(+2.29)#36 | 1.81%(+1.43)#1,757 |
| 37. | Westport | 3.08% | 0.95%(+2.13)#37 | 1.81%(+1.27)#1,839 |
| 38. | Woodland | 3.08% | 0.95%(+2.13)#38 | 1.81%(+1.27)#1,840 |
| 39. | Ferndale | 2.93% | 0.95%(+1.97)#39 | 1.81%(+1.12)#1,923 |
| 40. | Clover Creek | 2.86% | 0.95%(+1.90)#40 | 1.81%(+1.04)#1,967 |
| 41. | Arlington | 2.84% | 0.95%(+1.88)#41 | 1.81%(+1.02)#1,980 |
| 42. | Omak | 2.83% | 0.95%(+1.88)#42 | 1.81%(+1.02)#1,986 |
| 43. | Midland | 2.81% | 0.95%(+1.86)#43 | 1.81%(+0.995)#2,002 |
| 44. | Federal Way | 2.75% | 0.95%(+1.80)#44 | 1.81%(+0.939)#2,038 |
| 45. | Sunnyside | 2.65% | 0.95%(+1.70)#45 | 1.81%(+0.839)#2,110 |
| 46. | Springdale | 2.53% | 0.95%(+1.58)#46 | 1.81%(+0.721)#2,197 |
| 47. | Burlington | 2.51% | 0.95%(+1.56)#47 | 1.81%(+0.697)#2,215 |
| 48. | College Place | 2.40% | 0.95%(+1.45)#48 | 1.81%(+0.586)#2,304 |
| 49. | Eatonville | 2.39% | 0.95%(+1.44)#49 | 1.81%(+0.577)#2,311 |
| 50. | Kingston | 2.27% | 0.95%(+1.31)#50 | 1.81%(+0.454)#2,399 |
| 51. | Central Park | 2.17% | 0.95%(+1.21)#51 | 1.81%(+0.353)#2,492 |
| 52. | North Bend | 2.12% | 0.95%(+1.17)#52 | 1.81%(+0.307)#2,530 |
| 53. | South Bend | 2.10% | 0.95%(+1.14)#53 | 1.81%(+0.285)#2,549 |
| 54. | Tukwila | 2.10% | 0.95%(+1.14)#54 | 1.81%(+0.283)#2,552 |
| 55. | Kelso | 2.09% | 0.95%(+1.14)#55 | 1.81%(+0.280)#2,558 |
| 56. | Everett | 2.07% | 0.95%(+1.12)#56 | 1.81%(+0.261)#2,575 |
| 57. | Cashmere | 2.03% | 0.95%(+1.08)#57 | 1.81%(+0.222)#2,620 |
| 58. | Pasco | 2.02% | 0.95%(+1.06)#58 | 1.81%(+0.205)#2,641 |
| 59. | Kent | 1.99% | 0.95%(+1.03)#59 | 1.81%(+0.174)#2,670 |
| 60. | Bremerton | 1.84% | 0.95%(+0.891)#60 | 1.81%(+0.031)#2,847 |
| 61. | Spanaway | 1.76% | 0.95%(+0.802)#61 | 1.81%(-0.058)#2,956 |
| 62. | Monroe | 1.75% | 0.95%(+0.794)#62 | 1.81%(-0.066)#2,962 |
| 63. | Yakima | 1.74% | 0.95%(+0.786)#63 | 1.81%(-0.074)#2,973 |
| 64. | Lynnwood | 1.70% | 0.95%(+0.750)#64 | 1.81%(-0.110)#3,019 |
| 65. | Darrington | 1.70% | 0.95%(+0.750)#65 | 1.81%(-0.110)#3,020 |
| 66. | Longbranch | 1.69% | 0.95%(+0.738)#66 | 1.81%(-0.122)#3,030 |
| 67. | Wenatchee | 1.67% | 0.95%(+0.721)#67 | 1.81%(-0.139)#3,053 |
| 68. | Othello | 1.67% | 0.95%(+0.713)#68 | 1.81%(-0.147)#3,069 |
| 69. | Monroe North | 1.65% | 0.95%(+0.696)#69 | 1.81%(-0.164)#3,097 |
| 70. | Lake Morton Berrydale | 1.64% | 0.95%(+0.692)#70 | 1.81%(-0.168)#3,101 |
| 71. | Olympia | 1.59% | 0.95%(+0.641)#71 | 1.81%(-0.219)#3,183 |
| 72. | Fircrest | 1.59% | 0.95%(+0.639)#72 | 1.81%(-0.221)#3,187 |
| 73. | Lakewood | 1.59% | 0.95%(+0.632)#73 | 1.81%(-0.228)#3,199 |
| 74. | Edmonds | 1.58% | 0.95%(+0.630)#74 | 1.81%(-0.230)#3,203 |
| 75. | Walla Walla | 1.57% | 0.95%(+0.613)#75 | 1.81%(-0.247)#3,219 |
| 76. | Hunts Point | 1.55% | 0.95%(+0.595)#76 | 1.81%(-0.265)#3,243 |
| 77. | Airway Heights | 1.54% | 0.95%(+0.589)#77 | 1.81%(-0.271)#3,252 |
| 78. | Lakeland North | 1.52% | 0.95%(+0.571)#78 | 1.81%(-0.289)#3,281 |
| 79. | Hansville | 1.48% | 0.95%(+0.526)#79 | 1.81%(-0.334)#3,349 |
| 80. | Brewster | 1.47% | 0.95%(+0.520)#80 | 1.81%(-0.340)#3,359 |
| 81. | Elmer City | 1.45% | 0.95%(+0.496)#81 | 1.81%(-0.364)#3,409 |
| 82. | Vancouver | 1.44% | 0.95%(+0.486)#82 | 1.81%(-0.374)#3,427 |
| 83. | East Renton Highlands | 1.42% | 0.95%(+0.471)#83 | 1.81%(-0.389)#3,454 |
| 84. | Bonney Lake | 1.42% | 0.95%(+0.468)#84 | 1.81%(-0.392)#3,461 |
| 85. | Hobart | 1.41% | 0.95%(+0.459)#85 | 1.81%(-0.401)#3,481 |
| 86. | East Port Orchard | 1.36% | 0.95%(+0.410)#86 | 1.81%(-0.450)#3,569 |
| 87. | Renton | 1.35% | 0.95%(+0.401)#87 | 1.81%(-0.458)#3,588 |
| 88. | Entiat | 1.35% | 0.95%(+0.396)#88 | 1.81%(-0.464)#3,597 |
| 89. | Larch Way | 1.34% | 0.95%(+0.388)#89 | 1.81%(-0.472)#3,613 |
| 90. | Tenino | 1.32% | 0.95%(+0.367)#90 | 1.81%(-0.493)#3,646 |
| 91. | White Center | 1.27% | 0.95%(+0.320)#91 | 1.81%(-0.540)#3,755 |
| 92. | Centralia | 1.27% | 0.95%(+0.314)#92 | 1.81%(-0.546)#3,766 |
| 93. | Auburn | 1.25% | 0.95%(+0.295)#93 | 1.81%(-0.564)#3,798 |
| 94. | Tacoma | 1.22% | 0.95%(+0.268)#94 | 1.81%(-0.592)#3,843 |
| 95. | Mount Vernon | 1.21% | 0.95%(+0.257)#95 | 1.81%(-0.603)#3,856 |
| 96. | Mabton | 1.21% | 0.95%(+0.257)#96 | 1.81%(-0.603)#3,857 |
| 97. | Martha Lake | 1.20% | 0.95%(+0.242)#97 | 1.81%(-0.618)#3,877 |
| 98. | Washougal | 1.17% | 0.95%(+0.218)#98 | 1.81%(-0.642)#3,938 |
| 99. | Rosalia | 1.17% | 0.95%(+0.216)#99 | 1.81%(-0.644)#3,944 |
| 100. | Port Ludlow | 1.16% | 0.95%(+0.210)#100 | 1.81%(-0.650)#3,954 |
Common Questions
What are the Top 10 Cities with the Highest Percentage of Central American Population in Washington?
Top 10 Cities with the Highest Percentage of Central American Population in Washington are:
#1
42.86%
#2
32.08%
#3
16.05%
#4
15.15%
#5
13.99%
#6
8.77%
#7
8.62%
#8
8.50%
#9
7.74%
#10
7.65%
What city has the Highest Percentage of Central American Population in Washington?
Loomis has the Highest Percentage of Central American Population in Washington with 42.86%.
What is the Percentage of Central American Population in the State of Washington?
Percentage of Central American Population in Washington is 0.95%.
What is the Percentage of Central American Population in the United States?
Percentage of Central American Population in the United States is 1.81%.