Cities with the Fewest Births per 1,000 Teenage Women Under the Age of 20 in Washington

RELATED REPORTS & OPTIONS

Lowest Birth Rate | Women 15-19
Population
Families and Households
Female Fertility
Female Fertility (Unmarried)
Race (Community Size)
Race (Percentage)
Ancestry (Community Size)
AfghanAfricanAlaska NativeAlaskan AthabascanAlbanianAleutAlsatianAmericanApacheArabArapahoArgentineanArmenianAssyrian / Chaldean / SyriacAustralianAustrianBahamianBangladeshiBarbadianBasqueBelgianBelizeanBermudanBhutaneseBlackfeetBolivianBrazilianBritishBritish West IndianBulgarianBurmeseCajunCambodianCanadianCape VerdeanCarpatho RusynCelticCentral AmericanCentral American IndianCherokeeCheyenneChickasawChileanChineseChippewaChoctawColombianColvilleComancheCosta RicanCreeCreekCroatianCrowCubanCypriotCzechCzechoslovakianDanishDelawareDominicanDutchDutch West IndianEastern EuropeanEcuadorianEgyptianEnglishEstonianEthiopianEuropeanFijianFilipinoFinnishFrenchFrench American IndianFrench CanadianGermanGerman RussianGhanaianGreekGuamanian / ChamorroGuatemalanGuyaneseHaitianHmongHonduranHopiHoumaHungarianIcelanderIndian (Asian)IndonesianInupiatIranianIraqiIrishIroquoisIsraeliItalianJamaicanJapaneseJordanianKenyanKiowaKoreanLaotianLatvianLebaneseLiberianLithuanianLumbeeLuxembourgerMacedonianMalaysianMalteseMarshalleseMenomineeMexicanMexican American IndianMongolianMoroccanNative HawaiianNavajoNepaleseNew ZealanderNicaraguanNigerianNorthern EuropeanNorwegianOkinawanOsageOttawaPaiutePakistaniPalestinianPanamanianParaguayanPennsylvania GermanPeruvianPimaPolishPortuguesePotawatomiPuebloPuerto RicanPuget Sound SalishRomanianRussianSalvadoranSamoanScandinavianScotch-IrishScottishSeminoleSenegaleseSerbianShoshoneSierra LeoneanSiouxSlavicSlovakSloveneSomaliSouth AfricanSouth AmericanSouth American IndianSoviet UnionSpaniardSpanishSpanish AmericanSpanish American IndianSri LankanSubsaharan AfricanSudaneseSwedishSwissSyrianTaiwaneseThaiTlingit-HaidaTohono O'OdhamTonganTrinidadian and TobagonianTsimshianTurkishU.S. Virgin IslanderUgandanUkrainianUruguayanUteVenezuelanVietnameseWelshWest IndianYakamaYaquiYugoslavianYumanYup'ikZimbabwean
Ancestry (Percentage)
AfghanAfricanAlaska NativeAlaskan AthabascanAlbanianAleutAlsatianAmericanApacheArabArapahoArgentineanArmenianAssyrian / Chaldean / SyriacAustralianAustrianBahamianBangladeshiBarbadianBasqueBelgianBelizeanBermudanBhutaneseBlackfeetBolivianBrazilianBritishBritish West IndianBulgarianBurmeseCajunCambodianCanadianCape VerdeanCarpatho RusynCelticCentral AmericanCentral American IndianCherokeeCheyenneChickasawChileanChineseChippewaChoctawColombianColvilleComancheCosta RicanCreeCreekCroatianCrowCubanCypriotCzechCzechoslovakianDanishDelawareDominicanDutchDutch West IndianEastern EuropeanEcuadorianEgyptianEnglishEstonianEthiopianEuropeanFijianFilipinoFinnishFrenchFrench American IndianFrench CanadianGermanGerman RussianGhanaianGreekGuamanian / ChamorroGuatemalanGuyaneseHaitianHmongHonduranHopiHoumaHungarianIcelanderIndian (Asian)IndonesianInupiatIranianIraqiIrishIroquoisIsraeliItalianJamaicanJapaneseJordanianKenyanKiowaKoreanLaotianLatvianLebaneseLiberianLithuanianLumbeeLuxembourgerMacedonianMalaysianMalteseMarshalleseMenomineeMexicanMexican American IndianMongolianMoroccanNative HawaiianNavajoNepaleseNew ZealanderNicaraguanNigerianNorthern EuropeanNorwegianOkinawanOsageOttawaPaiutePakistaniPalestinianPanamanianParaguayanPennsylvania GermanPeruvianPimaPolishPortuguesePotawatomiPuebloPuerto RicanPuget Sound SalishRomanianRussianSalvadoranSamoanScandinavianScotch-IrishScottishSeminoleSenegaleseSerbianShoshoneSierra LeoneanSiouxSlavicSlovakSloveneSomaliSouth AfricanSouth AmericanSouth American IndianSoviet UnionSpaniardSpanishSpanish AmericanSpanish American IndianSri LankanSubsaharan AfricanSudaneseSwedishSwissSyrianTaiwaneseThaiTlingit-HaidaTohono O'OdhamTonganTrinidadian and TobagonianTsimshianTurkishU.S. Virgin IslanderUgandanUkrainianUruguayanUteVenezuelanVietnameseWelshWest IndianYakamaYaquiYugoslavianYumanYup'ikZimbabwean
Immigrant Origin (Total)
AfghanistanAfricaAlbaniaArgentinaArmeniaAsiaAustraliaAustriaAzoresBahamasBangladeshBarbadosBelarusBelgiumBelizeBoliviaBosnia and HerzegovinaBrazilBulgariaBurma / MyanmarCabo VerdeCambodiaCameroonCanadaCaribbeanCentral AmericaChileChinaColombiaCongoCosta RicaCroatiaCubaCzechoslovakiaDenmarkDominicaDominican RepublicEastern AfricaEastern AsiaEastern EuropeEcuadorEgyptEl SalvadorEnglandEritreaEthiopiaEuropeFijiFranceGermanyGhanaGreeceGrenadaGuatemalaGuyanaHaitiHondurasHong KongHungaryIndiaIndonesiaIranIraqIrelandIsraelItalyJamaicaJapanJordanKazakhstanKenyaKoreaKuwaitLaosLatin AmericaLatviaLebanonLiberiaLithuaniaMalaysiaMexicoMicronesiaMiddle AfricaMoldovaMoroccoNepalNetherlandsNicaraguaNigeriaNorth MacedoniaNorthern AfricaNorthern EuropeNorwayOceaniaPakistanPanamaPeruPhilippinesPolandPortugalRomaniaRussiaSaudi ArabiaScotlandSenegalSerbiaSierra LeoneSingaporeSomaliaSouth AfricaSouth AmericaSouth Central AsiaSouth Eastern AsiaSouthern EuropeSpainSri LankaSt. Vincent and the GrenadinesSudanSwedenSwitzerlandSyriaTaiwanThailandTrinidad and TobagoTurkeyUgandaUkraineUruguayUzbekistanVenezuelaVietnamWest IndiesWestern AfricaWestern AsiaWestern EuropeYemenZaireZimbabwe
Immigrant Origin (Percentage)
AfghanistanAfricaAlbaniaArgentinaArmeniaAsiaAustraliaAustriaAzoresBahamasBangladeshBarbadosBelarusBelgiumBelizeBoliviaBosnia and HerzegovinaBrazilBulgariaBurma / MyanmarCabo VerdeCambodiaCameroonCanadaCaribbeanCentral AmericaChileChinaColombiaCongoCosta RicaCroatiaCubaCzechoslovakiaDenmarkDominicaDominican RepublicEastern AfricaEastern AsiaEastern EuropeEcuadorEgyptEl SalvadorEnglandEritreaEthiopiaEuropeFijiFranceGermanyGhanaGreeceGrenadaGuatemalaGuyanaHaitiHondurasHong KongHungaryIndiaIndonesiaIranIraqIrelandIsraelItalyJamaicaJapanJordanKazakhstanKenyaKoreaKuwaitLaosLatin AmericaLatviaLebanonLiberiaLithuaniaMalaysiaMexicoMicronesiaMiddle AfricaMoldovaMoroccoNepalNetherlandsNicaraguaNigeriaNorth MacedoniaNorthern AfricaNorthern EuropeNorwayOceaniaPakistanPanamaPeruPhilippinesPolandPortugalRomaniaRussiaSaudi ArabiaScotlandSenegalSerbiaSierra LeoneSingaporeSomaliaSouth AfricaSouth AmericaSouth Central AsiaSouth Eastern AsiaSouthern EuropeSpainSri LankaSt. Vincent and the GrenadinesSudanSwedenSwitzerlandSyriaTaiwanThailandTrinidad and TobagoTurkeyUgandaUkraineUruguayUzbekistanVenezuelaVietnamWest IndiesWestern AfricaWestern AsiaWestern EuropeYemenZaireZimbabwe
Income
Income (Families)
Income (Households)
Poverty
Poverty (Families)
Unemployment
Employment Occupations
Employment Industries
Employer Class
Commute Time
Commute Means
School Enrollment
Education by Degree Field
Occupancy
Finances
Physical Characteristics
Washington
Compare Cities
Comparison Subject

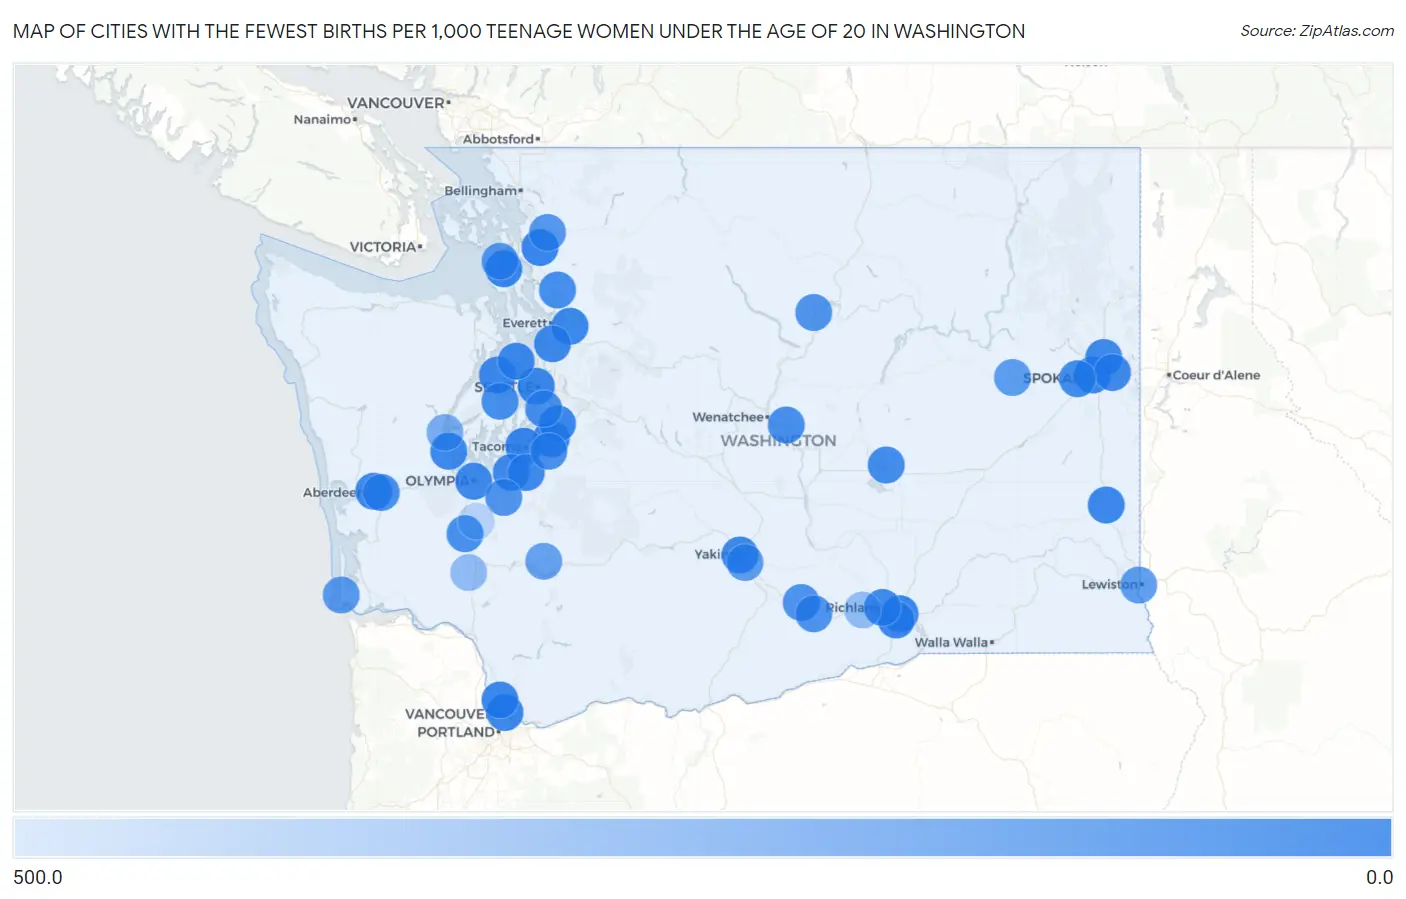
Map of Cities with the Fewest Births per 1,000 Teenage Women Under the Age of 20 in Washington

500.0
0.0
Cities with the Fewest Births per 1,000 Teenage Women Under the Age of 20 in Washington Map

Cities with the Fewest Births per 1,000 Teenage Women Under the Age of 20 in Washington

City Births / 1,000 Women vs State vs National
1.Auburn1.07.0(-6.00)#110.0(-9.00)#13
2.Mount Vernon1.07.0(-6.00)#210.0(-9.00)#19
3.Tacoma4.07.0(-3.00)#310.0(-6.00)#93
4.Oak Harbor4.07.0(-3.00)#410.0(-6.00)#136
5.Seattle6.07.0(-1.000)#510.0(-4.00)#182
6.Pasco6.07.0(-1.000)#610.0(-4.00)#197
7.Everett7.07.0(=0.000)#710.0(-3.00)#232
8.Vancouver9.07.0(+2.00)#810.0(-1.000)#309
9.Spokane11.07.0(+4.00)#910.0(+1.000)#380
10.Shelton13.07.0(+6.00)#1010.0(+3.00)#480
11.Kent14.07.0(+7.00)#1110.0(+4.00)#492
12.Silverdale14.07.0(+7.00)#1210.0(+4.00)#514
13.Mill Creek14.07.0(+7.00)#1310.0(+4.00)#515
14.Kennewick16.07.0(+9.00)#1410.0(+6.00)#572
15.Salmon Creek17.07.0(+10.00)#1510.0(+7.00)#611
16.Colfax17.07.0(+10.00)#1610.0(+7.00)#617
17.Indianola19.07.0(+12.0)#1710.0(+9.00)#674
18.Olympia20.07.0(+13.0)#1810.0(+10.00)#682
19.Yakima21.07.0(+14.0)#1910.0(+11.0)#700
20.Fairwood Cdp King County23.07.0(+16.0)#2010.0(+13.0)#764
21.Mead23.07.0(+16.0)#2110.0(+13.0)#771
22.Aberdeen25.07.0(+18.0)#2210.0(+15.0)#811
23.Fort Lewis30.07.0(+23.0)#2310.0(+20.0)#923
24.Spanaway31.07.0(+24.0)#2410.0(+21.0)#935
25.Millwood31.07.0(+24.0)#2510.0(+21.0)#945
26.Richland35.07.0(+28.0)#2610.0(+25.0)#996
27.Airway Heights36.07.0(+29.0)#2710.0(+26.0)#1,030
28.Moses Lake40.07.0(+33.0)#2810.0(+30.0)#1,081
29.Arlington44.07.0(+37.0)#2910.0(+34.0)#1,132
30.Port Orchard49.07.0(+42.0)#3010.0(+39.0)#1,197
31.Rock Island56.07.0(+49.0)#3110.0(+46.0)#1,269
32.Tukwila59.07.0(+52.0)#3210.0(+49.0)#1,290
33.Sumner60.07.0(+53.0)#3310.0(+50.0)#1,303
34.Central Park63.07.0(+56.0)#3410.0(+53.0)#1,331
35.Centralia67.07.0(+60.0)#3510.0(+57.0)#1,372
36.Sunnyside78.07.0(+71.0)#3610.0(+68.0)#1,449
37.Grandview80.07.0(+73.0)#3710.0(+70.0)#1,464
38.Pateros82.07.0(+75.0)#3810.0(+72.0)#1,485
39.Yelm85.07.0(+78.0)#3910.0(+75.0)#1,503
40.Whidbey Island Station97.07.0(+90.0)#4010.0(+87.0)#1,579
41.Suncrest101.07.0(+94.0)#4110.0(+91.0)#1,602
42.Sedro Woolley109.07.0(+102)#4210.0(+99.0)#1,648
43.Long Beach120.07.0(+113)#4310.0(+110)#1,714
44.Clarkston126.07.0(+119)#4410.0(+116)#1,740
45.Union Gap128.07.0(+121)#4510.0(+118)#1,745
46.Davenport132.07.0(+125)#4610.0(+122)#1,761
47.Morton167.07.0(+160)#4710.0(+157)#1,900
48.Skokomish231.07.0(+224)#4810.0(+221)#2,059
49.Winlock317.07.0(+310)#4910.0(+307)#2,165
50.Benton City324.07.0(+317)#5010.0(+314)#2,170
51.Bucoda455.07.0(+448)#5110.0(+445)#2,275

Common Questions

What are the Top 10 Cities with the Fewest Births per 1,000 Teenage Women Under the Age of 20 in Washington?
Top 10 Cities with the Fewest Births per 1,000 Teenage Women Under the Age of 20 in Washington are:
What city has the Fewest Births per 1,000 Teenage Women Under the Age of 20 in Washington?
Auburn has the Fewest Births per 1,000 Teenage Women Under the Age of 20 in Washington with 1.0.
What is the Number of Births per 1,000 Teenage Women Under the Age of 20 in the State of Washington?
Number of Births per 1,000 Teenage Women Under the Age of 20 in Washington is 7.0.
What is the Number of Births per 1,000 Teenage Women Under the Age of 20 in the United States?
Number of Births per 1,000 Teenage Women Under the Age of 20 in the United States is 10.0.