Cities with the Highest Percentage of Immigrants from South Central Asia in Washington
RELATED REPORTS & OPTIONS
South Central Asia
Washington
Compare Cities
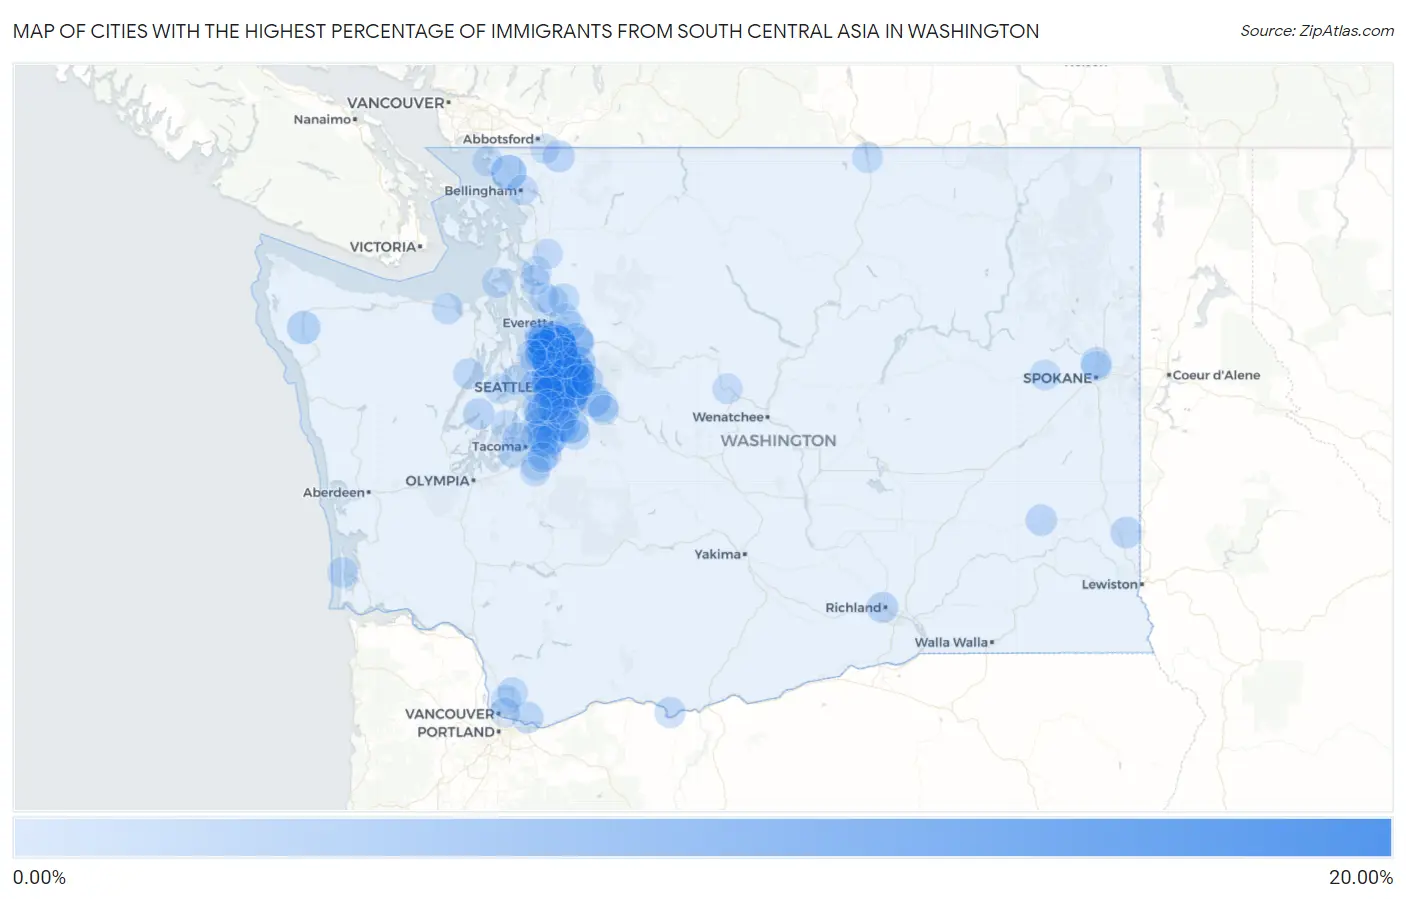
Map of Cities with the Highest Percentage of Immigrants from South Central Asia in Washington
0.00%
20.00%
Cities with the Highest Percentage of Immigrants from South Central Asia in Washington
| City | South Central Asia | vs State | vs National | |
| 1. | Bothell East | 19.77% | 1.78%(+18.0)#1 | 1.31%(+18.5)#36 |
| 2. | Redmond | 17.70% | 1.78%(+15.9)#2 | 1.31%(+16.4)#53 |
| 3. | Mill Creek East | 16.12% | 1.78%(+14.3)#3 | 1.31%(+14.8)#61 |
| 4. | Union Hill Novelty Hill | 13.03% | 1.78%(+11.3)#4 | 1.31%(+11.7)#106 |
| 5. | Sammamish | 12.61% | 1.78%(+10.8)#5 | 1.31%(+11.3)#116 |
| 6. | Bellevue | 11.71% | 1.78%(+9.94)#6 | 1.31%(+10.4)#135 |
| 7. | Clyde Hill | 10.55% | 1.78%(+8.78)#7 | 1.31%(+9.25)#163 |
| 8. | Lake Stickney | 8.00% | 1.78%(+6.23)#8 | 1.31%(+6.70)#251 |
| 9. | Issaquah | 7.52% | 1.78%(+5.74)#9 | 1.31%(+6.21)#273 |
| 10. | Bothell West | 7.28% | 1.78%(+5.51)#10 | 1.31%(+5.97)#284 |
| 11. | Newcastle | 6.19% | 1.78%(+4.42)#11 | 1.31%(+4.89)#370 |
| 12. | Kent | 6.18% | 1.78%(+4.41)#12 | 1.31%(+4.87)#371 |
| 13. | Bothell | 6.03% | 1.78%(+4.25)#13 | 1.31%(+4.72)#383 |
| 14. | Ferndale | 5.72% | 1.78%(+3.94)#14 | 1.31%(+4.41)#429 |
| 15. | Woodinville | 5.44% | 1.78%(+3.66)#15 | 1.31%(+4.13)#460 |
| 16. | Kirkland | 4.93% | 1.78%(+3.15)#16 | 1.31%(+3.62)#542 |
| 17. | Duvall | 4.85% | 1.78%(+3.07)#17 | 1.31%(+3.54)#554 |
| 18. | Maple Valley | 4.84% | 1.78%(+3.06)#18 | 1.31%(+3.53)#557 |
| 19. | Yarrow Point | 4.61% | 1.78%(+2.83)#19 | 1.31%(+3.30)#592 |
| 20. | Snoqualmie | 4.48% | 1.78%(+2.71)#20 | 1.31%(+3.18)#618 |
| 21. | Martha Lake | 4.44% | 1.78%(+2.67)#21 | 1.31%(+3.13)#627 |
| 22. | Ames Lake | 4.33% | 1.78%(+2.56)#22 | 1.31%(+3.02)#653 |
| 23. | Algona | 4.26% | 1.78%(+2.48)#23 | 1.31%(+2.95)#665 |
| 24. | Monroe North | 4.26% | 1.78%(+2.48)#24 | 1.31%(+2.95)#666 |
| 25. | Silver Firs | 3.82% | 1.78%(+2.05)#25 | 1.31%(+2.52)#772 |
| 26. | Forks | 3.76% | 1.78%(+1.98)#26 | 1.31%(+2.45)#790 |
| 27. | Mill Creek | 3.38% | 1.78%(+1.60)#27 | 1.31%(+2.07)#912 |
| 28. | Seatac | 3.34% | 1.78%(+1.56)#28 | 1.31%(+2.03)#922 |
| 29. | Lakeland North | 3.20% | 1.78%(+1.43)#29 | 1.31%(+1.89)#982 |
| 30. | Larch Way | 3.14% | 1.78%(+1.36)#30 | 1.31%(+1.83)#1,008 |
| 31. | North Puyallup | 2.98% | 1.78%(+1.20)#31 | 1.31%(+1.67)#1,079 |
| 32. | Lynnwood | 2.87% | 1.78%(+1.09)#32 | 1.31%(+1.56)#1,118 |
| 33. | Tukwila | 2.84% | 1.78%(+1.07)#33 | 1.31%(+1.53)#1,124 |
| 34. | Seattle | 2.64% | 1.78%(+0.866)#34 | 1.31%(+1.33)#1,225 |
| 35. | Peaceful Valley | 2.47% | 1.78%(+0.692)#35 | 1.31%(+1.16)#1,315 |
| 36. | Medina | 2.46% | 1.78%(+0.688)#36 | 1.31%(+1.16)#1,323 |
| 37. | Covington | 2.43% | 1.78%(+0.651)#37 | 1.31%(+1.12)#1,348 |
| 38. | Renton | 2.41% | 1.78%(+0.638)#38 | 1.31%(+1.11)#1,351 |
| 39. | Mercer Island | 2.38% | 1.78%(+0.600)#39 | 1.31%(+1.07)#1,374 |
| 40. | Des Moines | 2.32% | 1.78%(+0.542)#40 | 1.31%(+1.01)#1,403 |
| 41. | Camas | 2.19% | 1.78%(+0.411)#41 | 1.31%(+0.879)#1,485 |
| 42. | Carnation | 2.15% | 1.78%(+0.372)#42 | 1.31%(+0.839)#1,521 |
| 43. | Cottage Lake | 2.11% | 1.78%(+0.338)#43 | 1.31%(+0.805)#1,552 |
| 44. | Pullman | 2.10% | 1.78%(+0.329)#44 | 1.31%(+0.797)#1,561 |
| 45. | Belfair | 1.99% | 1.78%(+0.212)#45 | 1.31%(+0.680)#1,651 |
| 46. | Federal Way | 1.98% | 1.78%(+0.203)#46 | 1.31%(+0.671)#1,661 |
| 47. | North Lynnwood | 1.96% | 1.78%(+0.184)#47 | 1.31%(+0.652)#1,676 |
| 48. | Auburn | 1.94% | 1.78%(+0.168)#48 | 1.31%(+0.635)#1,692 |
| 49. | Monroe | 1.93% | 1.78%(+0.155)#49 | 1.31%(+0.622)#1,702 |
| 50. | Lacrosse | 1.92% | 1.78%(+0.143)#50 | 1.31%(+0.610)#1,711 |
| 51. | Richland | 1.86% | 1.78%(+0.081)#51 | 1.31%(+0.548)#1,765 |
| 52. | Picnic Point | 1.77% | 1.78%(-0.007)#52 | 1.31%(+0.461)#1,844 |
| 53. | River Road | 1.75% | 1.78%(-0.026)#53 | 1.31%(+0.442)#1,862 |
| 54. | University Place | 1.74% | 1.78%(-0.032)#54 | 1.31%(+0.436)#1,874 |
| 55. | Shoreline | 1.72% | 1.78%(-0.056)#55 | 1.31%(+0.412)#1,898 |
| 56. | Country Homes | 1.70% | 1.78%(-0.079)#56 | 1.31%(+0.388)#1,922 |
| 57. | Fairwood Cdp King County | 1.64% | 1.78%(-0.131)#57 | 1.31%(+0.336)#1,979 |
| 58. | Kenmore | 1.63% | 1.78%(-0.141)#58 | 1.31%(+0.327)#1,990 |
| 59. | Eastmont | 1.60% | 1.78%(-0.175)#59 | 1.31%(+0.293)#2,040 |
| 60. | Marysville | 1.59% | 1.78%(-0.188)#60 | 1.31%(+0.280)#2,055 |
| 61. | Maple Heights Lake Desire | 1.57% | 1.78%(-0.204)#61 | 1.31%(+0.264)#2,078 |
| 62. | Dallesport | 1.54% | 1.78%(-0.233)#62 | 1.31%(+0.235)#2,108 |
| 63. | North Bend | 1.54% | 1.78%(-0.239)#63 | 1.31%(+0.229)#2,117 |
| 64. | Brinnon | 1.49% | 1.78%(-0.288)#64 | 1.31%(+0.179)#2,179 |
| 65. | Oroville | 1.48% | 1.78%(-0.292)#65 | 1.31%(+0.175)#2,188 |
| 66. | Ocean Park | 1.47% | 1.78%(-0.307)#66 | 1.31%(+0.161)#2,204 |
| 67. | Sisco Heights | 1.41% | 1.78%(-0.362)#67 | 1.31%(+0.105)#2,281 |
| 68. | Mukilteo | 1.41% | 1.78%(-0.367)#68 | 1.31%(+0.101)#2,288 |
| 69. | Mountlake Terrace | 1.37% | 1.78%(-0.403)#69 | 1.31%(+0.064)#2,342 |
| 70. | Lakeland South | 1.37% | 1.78%(-0.403)#70 | 1.31%(+0.064)#2,343 |
| 71. | Rocky Point | 1.36% | 1.78%(-0.417)#71 | 1.31%(+0.050)#2,361 |
| 72. | Coupeville | 1.32% | 1.78%(-0.452)#72 | 1.31%(+0.015)#2,392 |
| 73. | Reardan | 1.31% | 1.78%(-0.466)#73 | 1.31%(+0.001)#2,414 |
| 74. | Bryn Mawr Skyway | 1.29% | 1.78%(-0.483)#74 | 1.31%(-0.016)#2,434 |
| 75. | Fairwood Cdp Spokane County | 1.22% | 1.78%(-0.553)#75 | 1.31%(-0.086)#2,520 |
| 76. | Meadow Glade | 1.21% | 1.78%(-0.562)#76 | 1.31%(-0.095)#2,544 |
| 77. | Lake Stevens | 1.16% | 1.78%(-0.614)#77 | 1.31%(-0.146)#2,643 |
| 78. | Lake Goodwin | 1.11% | 1.78%(-0.665)#78 | 1.31%(-0.197)#2,730 |
| 79. | Summit View | 1.09% | 1.78%(-0.690)#79 | 1.31%(-0.222)#2,776 |
| 80. | Birch Bay | 1.02% | 1.78%(-0.752)#80 | 1.31%(-0.285)#2,899 |
| 81. | Barberton | 0.99% | 1.78%(-0.781)#81 | 1.31%(-0.314)#2,958 |
| 82. | Town And Country | 0.99% | 1.78%(-0.784)#82 | 1.31%(-0.316)#2,964 |
| 83. | Leavenworth | 0.95% | 1.78%(-0.821)#83 | 1.31%(-0.354)#3,029 |
| 84. | Everett | 0.95% | 1.78%(-0.828)#84 | 1.31%(-0.361)#3,049 |
| 85. | Canterwood | 0.94% | 1.78%(-0.839)#85 | 1.31%(-0.372)#3,073 |
| 86. | Riverbend | 0.93% | 1.78%(-0.845)#86 | 1.31%(-0.377)#3,080 |
| 87. | Lake Ketchum | 0.93% | 1.78%(-0.848)#87 | 1.31%(-0.381)#3,090 |
| 88. | Black Diamond | 0.92% | 1.78%(-0.853)#88 | 1.31%(-0.386)#3,106 |
| 89. | Bellingham | 0.92% | 1.78%(-0.859)#89 | 1.31%(-0.392)#3,118 |
| 90. | Burien | 0.89% | 1.78%(-0.890)#90 | 1.31%(-0.423)#3,186 |
| 91. | Big Lake | 0.88% | 1.78%(-0.893)#91 | 1.31%(-0.426)#3,192 |
| 92. | Bainbridge Island | 0.87% | 1.78%(-0.908)#92 | 1.31%(-0.441)#3,224 |
| 93. | Frederickson | 0.86% | 1.78%(-0.919)#93 | 1.31%(-0.451)#3,250 |
| 94. | Puyallup | 0.84% | 1.78%(-0.933)#94 | 1.31%(-0.466)#3,292 |
| 95. | Woodway | 0.81% | 1.78%(-0.971)#95 | 1.31%(-0.503)#3,373 |
| 96. | Maltby | 0.80% | 1.78%(-0.974)#96 | 1.31%(-0.506)#3,381 |
| 97. | Vancouver | 0.80% | 1.78%(-0.978)#97 | 1.31%(-0.510)#3,392 |
| 98. | Stanwood | 0.73% | 1.78%(-1.04)#98 | 1.31%(-0.575)#3,576 |
| 99. | Sumas | 0.72% | 1.78%(-1.06)#99 | 1.31%(-0.592)#3,626 |
| 100. | Ruston | 0.71% | 1.78%(-1.07)#100 | 1.31%(-0.599)#3,647 |
Common Questions
What are the Top 10 Cities with the Highest Percentage of Immigrants from South Central Asia in Washington?
Top 10 Cities with the Highest Percentage of Immigrants from South Central Asia in Washington are:
#1
19.77%
#2
17.70%
#3
16.12%
#4
13.03%
#5
12.61%
#6
11.71%
#7
10.55%
#8
8.00%
#9
7.52%
#10
7.28%
What city has the Highest Percentage of Immigrants from South Central Asia in Washington?
Bothell East has the Highest Percentage of Immigrants from South Central Asia in Washington with 19.77%.
What is the Percentage of Immigrants from South Central Asia in the State of Washington?
Percentage of Immigrants from South Central Asia in Washington is 1.78%.
What is the Percentage of Immigrants from South Central Asia in the United States?
Percentage of Immigrants from South Central Asia in the United States is 1.31%.