Cities with the Lowest Poverty Level Among Children Under the Age of 5 in Washington
RELATED REPORTS & OPTIONS
Lowest Poverty | Child 0-5
Washington
Compare Cities
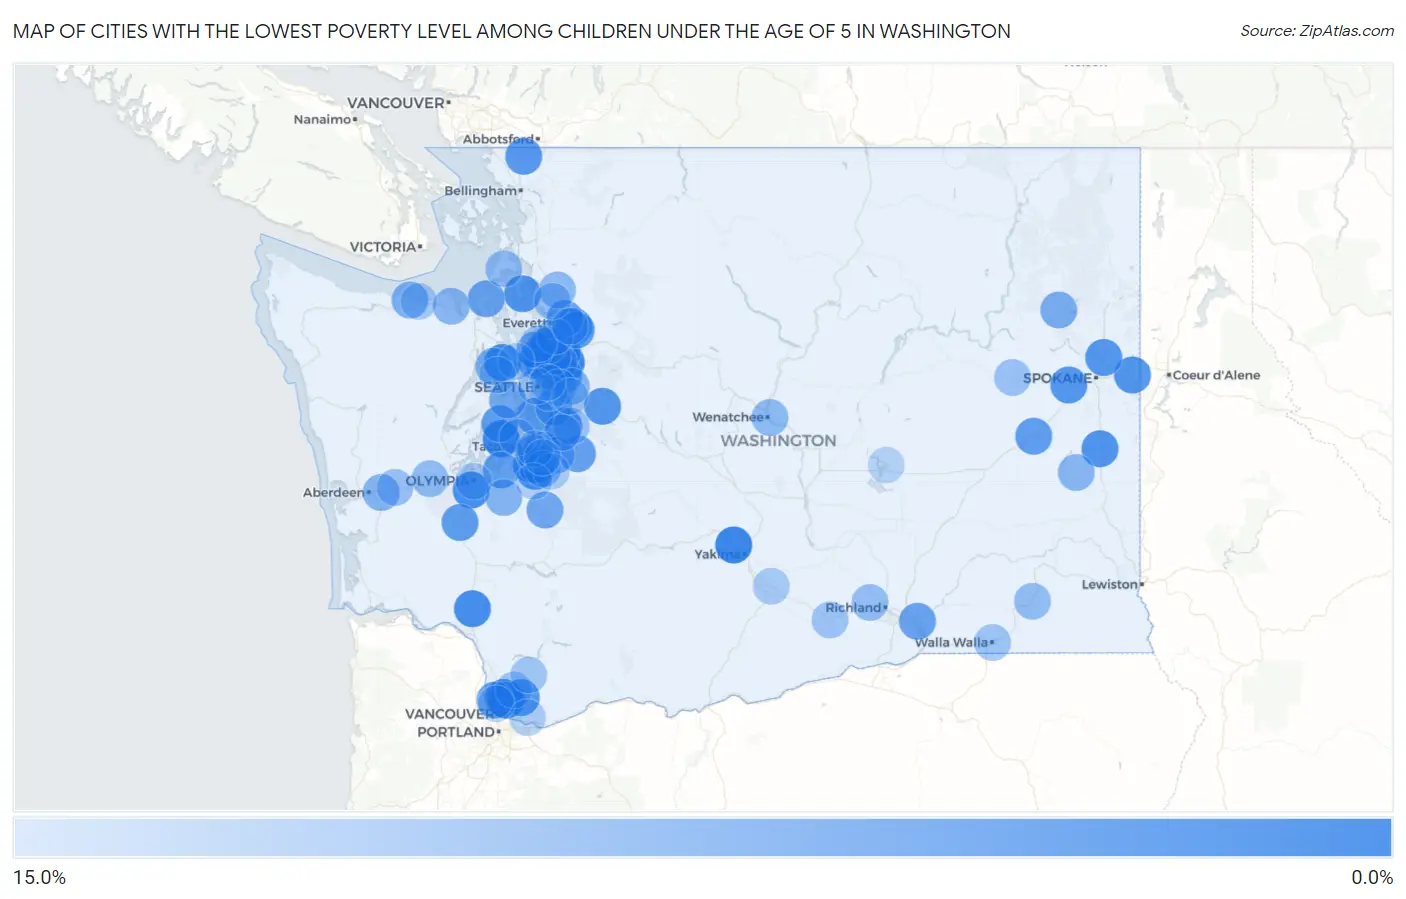
Map of Cities with the Lowest Poverty Level Among Children Under the Age of 5 in Washington
15.0%
0.0%
Cities with the Lowest Poverty Level Among Children Under the Age of 5 in Washington
| City | Child Poverty | vs State | vs National | |
| 1. | Cottage Lake | 0.74% | 12.6%(-11.9)#1 | 18.1%(-17.3)#53 |
| 2. | Gleed | 0.86% | 12.6%(-11.8)#2 | 18.1%(-17.2)#74 |
| 3. | Artondale | 0.93% | 12.6%(-11.7)#3 | 18.1%(-17.1)#88 |
| 4. | Lake Forest Park | 1.3% | 12.6%(-11.4)#4 | 18.1%(-16.8)#148 |
| 5. | Mount Vista | 1.6% | 12.6%(-11.0)#5 | 18.1%(-16.5)#220 |
| 6. | Tehaleh | 1.7% | 12.6%(-11.0)#6 | 18.1%(-16.4)#244 |
| 7. | Mill Creek East | 1.7% | 12.6%(-10.9)#7 | 18.1%(-16.4)#253 |
| 8. | Poulsbo | 1.7% | 12.6%(-10.9)#8 | 18.1%(-16.4)#256 |
| 9. | Alderwood Manor | 1.7% | 12.6%(-10.9)#9 | 18.1%(-16.3)#266 |
| 10. | Tumwater | 1.8% | 12.6%(-10.8)#10 | 18.1%(-16.3)#282 |
| 11. | Barberton | 1.9% | 12.6%(-10.7)#11 | 18.1%(-16.1)#317 |
| 12. | Castle Rock | 2.0% | 12.6%(-10.7)#12 | 18.1%(-16.1)#330 |
| 13. | Frederickson | 2.5% | 12.6%(-10.1)#13 | 18.1%(-15.5)#523 |
| 14. | Rosalia | 2.6% | 12.6%(-10.1)#14 | 18.1%(-15.5)#534 |
| 15. | Clover Creek | 2.6% | 12.6%(-10.0)#15 | 18.1%(-15.5)#546 |
| 16. | Summit View | 2.7% | 12.6%(-9.96)#16 | 18.1%(-15.4)#560 |
| 17. | Camano | 2.7% | 12.6%(-9.93)#17 | 18.1%(-15.4)#575 |
| 18. | Covington | 2.7% | 12.6%(-9.92)#18 | 18.1%(-15.4)#577 |
| 19. | Liberty Lake | 2.7% | 12.6%(-9.89)#19 | 18.1%(-15.3)#589 |
| 20. | Mead | 2.9% | 12.6%(-9.77)#20 | 18.1%(-15.2)#648 |
| 21. | North Bend | 2.9% | 12.6%(-9.76)#21 | 18.1%(-15.2)#657 |
| 22. | Fairchild Afb | 2.9% | 12.6%(-9.71)#22 | 18.1%(-15.2)#674 |
| 23. | Snohomish | 2.9% | 12.6%(-9.67)#23 | 18.1%(-15.1)#688 |
| 24. | Lynden | 3.2% | 12.6%(-9.43)#24 | 18.1%(-14.9)#783 |
| 25. | Hockinson | 3.2% | 12.6%(-9.41)#25 | 18.1%(-14.9)#791 |
| 26. | Maltby | 3.4% | 12.6%(-9.22)#26 | 18.1%(-14.7)#872 |
| 27. | Bothell East | 3.4% | 12.6%(-9.22)#27 | 18.1%(-14.7)#873 |
| 28. | Normandy Park | 3.4% | 12.6%(-9.20)#28 | 18.1%(-14.6)#883 |
| 29. | Kirkland | 3.5% | 12.6%(-9.11)#29 | 18.1%(-14.5)#918 |
| 30. | Three Lakes | 3.5% | 12.6%(-9.10)#30 | 18.1%(-14.5)#919 |
| 31. | Wauna | 3.6% | 12.6%(-9.05)#31 | 18.1%(-14.5)#942 |
| 32. | Grand Mound | 3.7% | 12.6%(-8.88)#32 | 18.1%(-14.3)#1,021 |
| 33. | Kenmore | 3.8% | 12.6%(-8.85)#33 | 18.1%(-14.3)#1,032 |
| 34. | Sprague | 3.8% | 12.6%(-8.77)#34 | 18.1%(-14.2)#1,060 |
| 35. | Dupont | 4.0% | 12.6%(-8.61)#35 | 18.1%(-14.1)#1,139 |
| 36. | Enumclaw | 4.2% | 12.6%(-8.46)#36 | 18.1%(-13.9)#1,182 |
| 37. | Felida | 4.3% | 12.6%(-8.29)#37 | 18.1%(-13.7)#1,261 |
| 38. | Burbank | 4.4% | 12.6%(-8.17)#38 | 18.1%(-13.6)#1,311 |
| 39. | Port Townsend | 4.5% | 12.6%(-8.16)#39 | 18.1%(-13.6)#1,318 |
| 40. | Brier | 4.5% | 12.6%(-8.07)#40 | 18.1%(-13.5)#1,344 |
| 41. | Mountlake Terrace | 4.6% | 12.6%(-8.06)#41 | 18.1%(-13.5)#1,372 |
| 42. | Edgewood | 4.6% | 12.6%(-8.02)#42 | 18.1%(-13.5)#1,380 |
| 43. | Lake Stevens | 4.7% | 12.6%(-7.97)#43 | 18.1%(-13.4)#1,404 |
| 44. | Redmond | 4.8% | 12.6%(-7.84)#44 | 18.1%(-13.3)#1,474 |
| 45. | Shoreline | 5.1% | 12.6%(-7.56)#45 | 18.1%(-13.0)#1,596 |
| 46. | Eatonville | 5.1% | 12.6%(-7.55)#46 | 18.1%(-13.0)#1,603 |
| 47. | Parkwood | 5.1% | 12.6%(-7.53)#47 | 18.1%(-13.0)#1,613 |
| 48. | Waller | 5.3% | 12.6%(-7.32)#48 | 18.1%(-12.8)#1,707 |
| 49. | Renton | 5.5% | 12.6%(-7.15)#49 | 18.1%(-12.6)#1,776 |
| 50. | Springdale | 5.8% | 12.6%(-6.82)#50 | 18.1%(-12.3)#1,911 |
| 51. | Woodinville | 5.9% | 12.6%(-6.68)#51 | 18.1%(-12.1)#1,964 |
| 52. | Port Angeles | 6.0% | 12.6%(-6.65)#52 | 18.1%(-12.1)#1,974 |
| 53. | Bangor Base | 6.0% | 12.6%(-6.65)#53 | 18.1%(-12.1)#1,975 |
| 54. | Larch Way | 6.2% | 12.6%(-6.37)#54 | 18.1%(-11.8)#2,085 |
| 55. | Bonney Lake | 6.3% | 12.6%(-6.31)#55 | 18.1%(-11.8)#2,129 |
| 56. | Central Park | 6.4% | 12.6%(-6.19)#56 | 18.1%(-11.6)#2,164 |
| 57. | Martha Lake | 6.4% | 12.6%(-6.19)#57 | 18.1%(-11.6)#2,165 |
| 58. | Sammamish | 6.6% | 12.6%(-6.06)#58 | 18.1%(-11.5)#2,211 |
| 59. | Bothell | 6.6% | 12.6%(-6.04)#59 | 18.1%(-11.5)#2,227 |
| 60. | Yelm | 6.7% | 12.6%(-5.89)#60 | 18.1%(-11.3)#2,296 |
| 61. | Edmonds | 6.8% | 12.6%(-5.78)#61 | 18.1%(-11.2)#2,344 |
| 62. | St John | 6.9% | 12.6%(-5.72)#62 | 18.1%(-11.2)#2,372 |
| 63. | South Hill | 6.9% | 12.6%(-5.68)#63 | 18.1%(-11.1)#2,395 |
| 64. | Sequim | 7.0% | 12.6%(-5.64)#64 | 18.1%(-11.1)#2,410 |
| 65. | East Wenatchee | 7.3% | 12.6%(-5.36)#65 | 18.1%(-10.8)#2,533 |
| 66. | Arlington | 7.5% | 12.6%(-5.12)#66 | 18.1%(-10.6)#2,629 |
| 67. | Oak Harbor | 7.6% | 12.6%(-5.02)#67 | 18.1%(-10.5)#2,663 |
| 68. | Mccleary | 7.6% | 12.6%(-5.02)#68 | 18.1%(-10.5)#2,667 |
| 69. | Eastmont | 7.7% | 12.6%(-4.88)#69 | 18.1%(-10.3)#2,740 |
| 70. | Dayton | 7.8% | 12.6%(-4.85)#70 | 18.1%(-10.3)#2,748 |
| 71. | West Richland | 7.9% | 12.6%(-4.72)#71 | 18.1%(-10.2)#2,800 |
| 72. | Marysville | 7.9% | 12.6%(-4.67)#72 | 18.1%(-10.1)#2,808 |
| 73. | Meadowdale | 8.2% | 12.6%(-4.44)#73 | 18.1%(-9.88)#2,901 |
| 74. | Montesano | 8.2% | 12.6%(-4.42)#74 | 18.1%(-9.86)#2,908 |
| 75. | Maple Valley | 8.3% | 12.6%(-4.32)#75 | 18.1%(-9.76)#2,941 |
| 76. | Davenport | 8.5% | 12.6%(-4.13)#76 | 18.1%(-9.58)#3,031 |
| 77. | Ruston | 8.5% | 12.6%(-4.11)#77 | 18.1%(-9.55)#3,042 |
| 78. | Prosser | 8.5% | 12.6%(-4.08)#78 | 18.1%(-9.52)#3,065 |
| 79. | Battle Ground | 8.6% | 12.6%(-4.05)#79 | 18.1%(-9.50)#3,068 |
| 80. | Lake Morton Berrydale | 8.6% | 12.6%(-3.99)#80 | 18.1%(-9.43)#3,099 |
| 81. | Walla Walla | 8.6% | 12.6%(-3.98)#81 | 18.1%(-9.42)#3,103 |
| 82. | Bellevue | 8.8% | 12.6%(-3.80)#82 | 18.1%(-9.24)#3,175 |
| 83. | Mercer Island | 8.9% | 12.6%(-3.67)#83 | 18.1%(-9.12)#3,227 |
| 84. | Seattle | 9.0% | 12.6%(-3.60)#84 | 18.1%(-9.05)#3,247 |
| 85. | Issaquah | 9.0% | 12.6%(-3.58)#85 | 18.1%(-9.03)#3,253 |
| 86. | Yacolt | 9.1% | 12.6%(-3.53)#86 | 18.1%(-8.97)#3,276 |
| 87. | Indianola | 9.3% | 12.6%(-3.32)#87 | 18.1%(-8.76)#3,390 |
| 88. | Olympia | 9.3% | 12.6%(-3.30)#88 | 18.1%(-8.74)#3,399 |
| 89. | Port Angeles East | 9.4% | 12.6%(-3.24)#89 | 18.1%(-8.69)#3,414 |
| 90. | Everett | 9.4% | 12.6%(-3.20)#90 | 18.1%(-8.65)#3,429 |
| 91. | Zillah | 9.4% | 12.6%(-3.19)#91 | 18.1%(-8.64)#3,432 |
| 92. | Orting | 9.6% | 12.6%(-2.98)#92 | 18.1%(-8.43)#3,518 |
| 93. | Camas | 9.6% | 12.6%(-2.97)#93 | 18.1%(-8.42)#3,522 |
| 94. | Silverdale | 9.7% | 12.6%(-2.95)#94 | 18.1%(-8.40)#3,529 |
| 95. | Fife | 9.9% | 12.6%(-2.73)#95 | 18.1%(-8.18)#3,598 |
| 96. | Elk Plain | 10.1% | 12.6%(-2.53)#96 | 18.1%(-7.98)#3,697 |
| 97. | Puyallup | 10.1% | 12.6%(-2.50)#97 | 18.1%(-7.95)#3,710 |
| 98. | Moses Lake | 10.4% | 12.6%(-2.22)#98 | 18.1%(-7.66)#3,806 |
| 99. | Medina | 10.4% | 12.6%(-2.18)#99 | 18.1%(-7.63)#3,822 |
| 100. | Lake Shore | 10.5% | 12.6%(-2.09)#100 | 18.1%(-7.54)#3,854 |
Common Questions
What are the Top 10 Cities with the Lowest Poverty Level Among Children Under the Age of 5 in Washington?
Top 10 Cities with the Lowest Poverty Level Among Children Under the Age of 5 in Washington are:
#1
0.74%
#2
0.86%
#3
0.93%
#4
1.3%
#5
1.6%
#6
1.7%
#7
1.7%
#8
1.7%
#9
1.8%
#10
1.9%
What city has the Lowest Poverty Level Among Children Under the Age of 5 in Washington?
Cottage Lake has the Lowest Poverty Level Among Children Under the Age of 5 in Washington with 0.74%.
What is the Poverty Level Among Children Under the Age of 5 in the State of Washington?
Poverty Level Among Children Under the Age of 5 in Washington is 12.6%.
What is the Poverty Level Among Children Under the Age of 5 in the United States?
Poverty Level Among Children Under the Age of 5 in the United States is 18.1%.