Summitview, WA Map & Demographics
Summitview Map
Summitview Overview
$38,916
PER CAPITA INCOME
$82,311
AVG FAMILY INCOME
$82,382
AVG HOUSEHOLD INCOME
0.37
INEQUALITY / GINI INDEX
2,059
TOTAL POPULATION
1,019
MALE POPULATION
1,040
FEMALE POPULATION
97.98
MALES / 100 FEMALES
102.06
FEMALES / 100 MALES
42.0
MEDIAN AGE
3.4
AVG FAMILY SIZE
2.8
AVG HOUSEHOLD SIZE
1,105
LABOR FORCE [ PEOPLE ]
63.9%
PERCENT IN LABOR FORCE
1.3%
UNEMPLOYMENT RATE
Income in Summitview
Income Overview in Summitview
Per Capita Income in Summitview is $38,916, while median incomes of families and households are $82,311 and $82,382 respectively.
| Characteristic | Number | Measure |
| Per Capita Income | 2,059 | $38,916 |
| Median Family Income | 486 | $82,311 |
| Mean Family Income | 486 | $121,505 |
| Median Household Income | 725 | $82,382 |
| Mean Household Income | 725 | $108,480 |
| Income Deficit | 486 | $0 |
| Wage / Income Gap (%) | 2,059 | 0.00% |
| Wage / Income Gap ($) | 2,059 | 100.00¢ per $1 |
| Gini / Inequality Index | 2,059 | 0.37 |
Earnings by Sex in Summitview
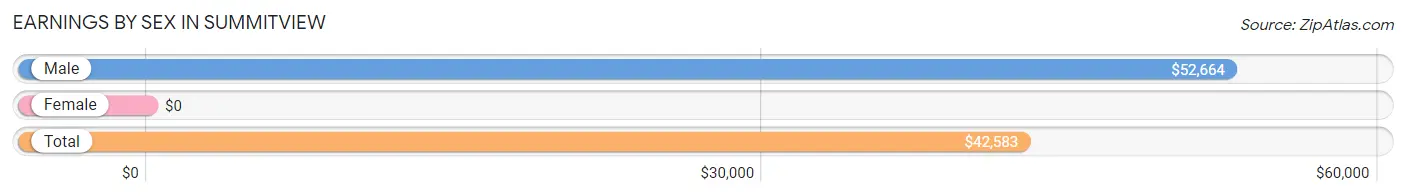
| Sex | Number | Average Earnings |
| Male | 535 (47.2%) | $52,664 |
| Female | 598 (52.8%) | $0 |
| Total | 1,133 (100.0%) | $42,583 |
Earnings by Sex by Income Bracket in Summitview
The most common earnings brackets in Summitview are $100,000+ for men (109 | 20.4%) and $10,000 to $12,499 for women (81 | 13.6%).
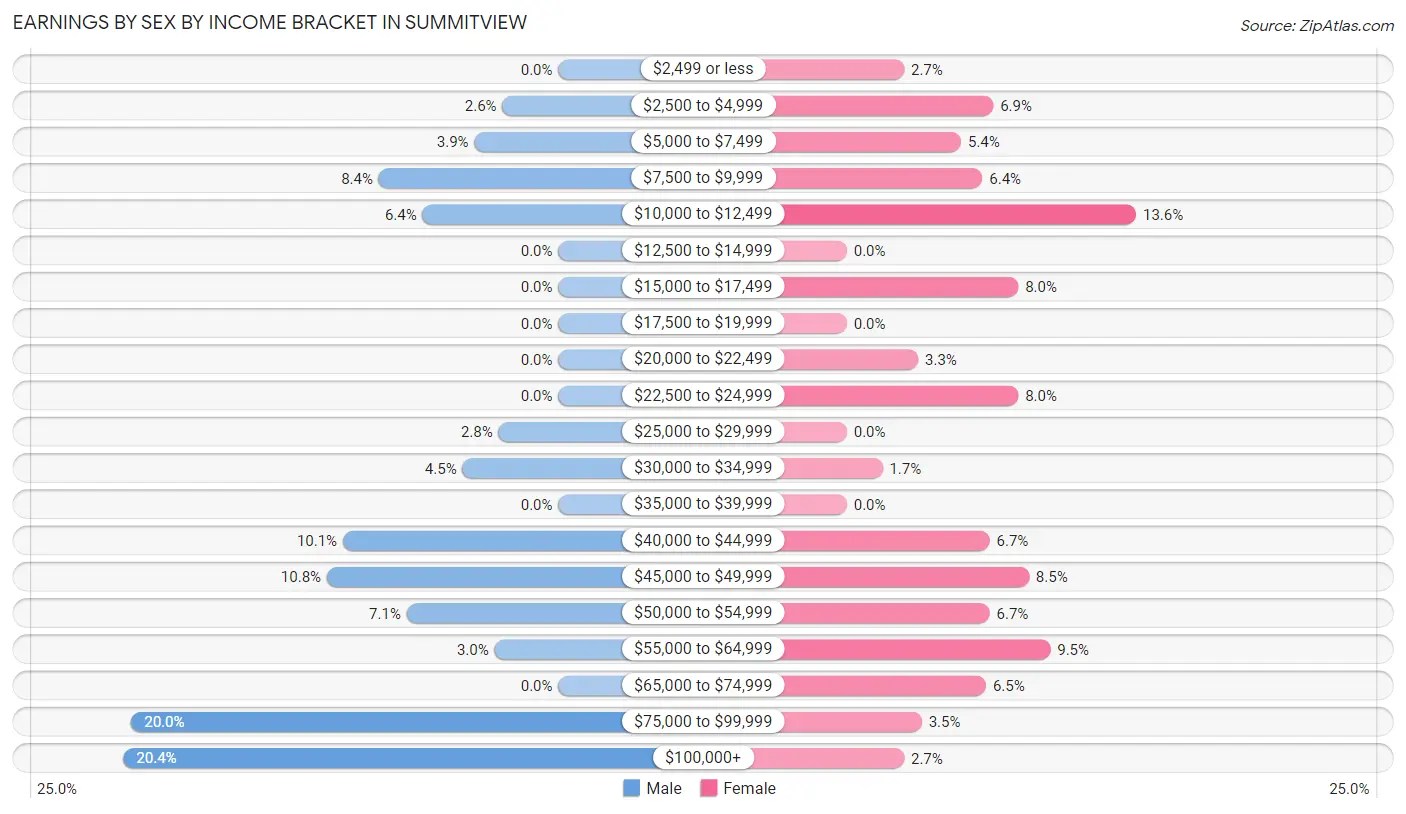
| Income | Male | Female |
| $2,499 or less | 0 (0.0%) | 16 (2.7%) |
| $2,500 to $4,999 | 14 (2.6%) | 41 (6.9%) |
| $5,000 to $7,499 | 21 (3.9%) | 32 (5.3%) |
| $7,500 to $9,999 | 45 (8.4%) | 38 (6.4%) |
| $10,000 to $12,499 | 34 (6.4%) | 81 (13.6%) |
| $12,500 to $14,999 | 0 (0.0%) | 0 (0.0%) |
| $15,000 to $17,499 | 0 (0.0%) | 48 (8.0%) |
| $17,500 to $19,999 | 0 (0.0%) | 0 (0.0%) |
| $20,000 to $22,499 | 0 (0.0%) | 20 (3.3%) |
| $22,500 to $24,999 | 0 (0.0%) | 48 (8.0%) |
| $25,000 to $29,999 | 15 (2.8%) | 0 (0.0%) |
| $30,000 to $34,999 | 24 (4.5%) | 10 (1.7%) |
| $35,000 to $39,999 | 0 (0.0%) | 0 (0.0%) |
| $40,000 to $44,999 | 54 (10.1%) | 40 (6.7%) |
| $45,000 to $49,999 | 58 (10.8%) | 51 (8.5%) |
| $50,000 to $54,999 | 38 (7.1%) | 40 (6.7%) |
| $55,000 to $64,999 | 16 (3.0%) | 57 (9.5%) |
| $65,000 to $74,999 | 0 (0.0%) | 39 (6.5%) |
| $75,000 to $99,999 | 107 (20.0%) | 21 (3.5%) |
| $100,000+ | 109 (20.4%) | 16 (2.7%) |
| Total | 535 (100.0%) | 598 (100.0%) |
Earnings by Sex by Educational Attainment in Summitview
Average earnings in Summitview are $54,079 for men and $45,855 for women, a difference of 15.2%. Men with an educational attainment of graduate degree enjoy the highest average annual earnings of $142,500, while those with high school diploma education earn the least with $46,487. Women with an educational attainment of college or associate's degree earn the most with the average annual earnings of $42,833, while those with college or associate's degree education have the smallest earnings of $42,833.
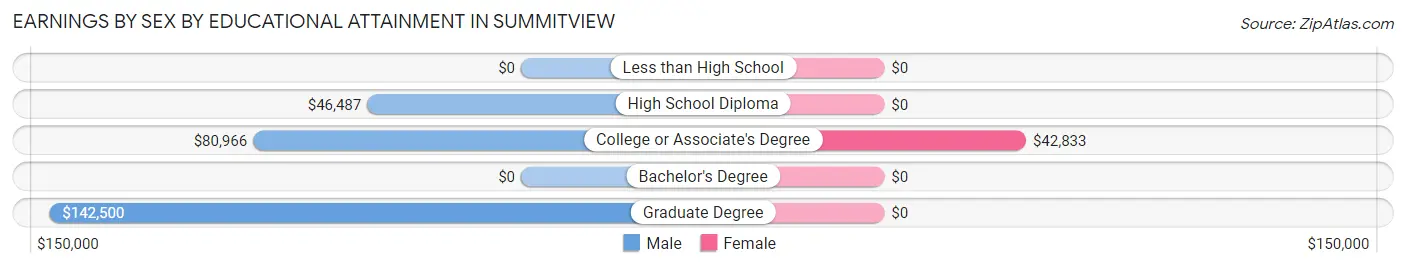
| Educational Attainment | Male Income | Female Income |
| Less than High School | - | - |
| High School Diploma | $46,487 | $0 |
| College or Associate's Degree | $80,966 | $42,833 |
| Bachelor's Degree | - | - |
| Graduate Degree | $142,500 | $0 |
| Total | $54,079 | $45,855 |
Family Income in Summitview
Family Income Brackets in Summitview
According to the Summitview family income data, there are 161 families falling into the $100,000 to $149,999 income range, which is the most common income bracket and makes up 33.1% of all families.
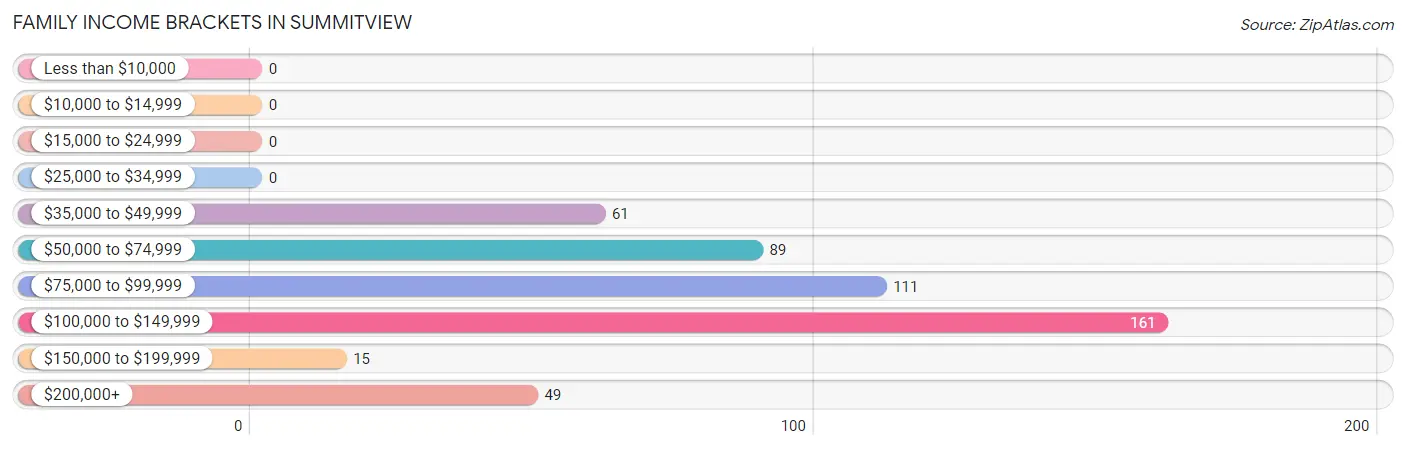
| Income Bracket | # Families | % Families |
| Less than $10,000 | 0 | 0.0% |
| $10,000 to $14,999 | 0 | 0.0% |
| $15,000 to $24,999 | 0 | 0.0% |
| $25,000 to $34,999 | 0 | 0.0% |
| $35,000 to $49,999 | 61 | 12.6% |
| $50,000 to $74,999 | 89 | 18.3% |
| $75,000 to $99,999 | 111 | 22.8% |
| $100,000 to $149,999 | 161 | 33.1% |
| $150,000 to $199,999 | 15 | 3.1% |
| $200,000+ | 49 | 10.1% |
Family Income by Famaliy Size in Summitview
3-person families (181 | 37.2%) account for the highest median family income in Summitview with $99,911 per family, while 2-person families (129 | 26.5%) have the highest median income of $33,854 per family member.
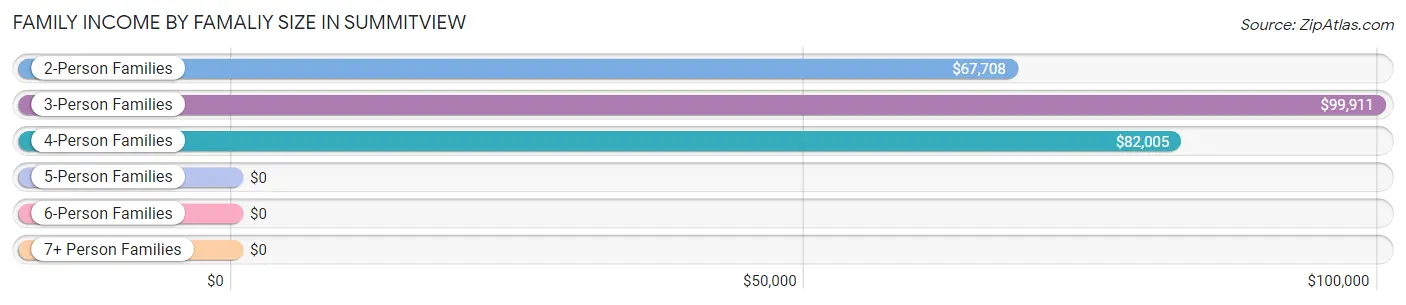
| Income Bracket | # Families | Median Income |
| 2-Person Families | 129 (26.5%) | $67,708 |
| 3-Person Families | 181 (37.2%) | $99,911 |
| 4-Person Families | 127 (26.1%) | $82,005 |
| 5-Person Families | 45 (9.3%) | $0 |
| 6-Person Families | 4 (0.8%) | $0 |
| 7+ Person Families | 0 (0.0%) | $0 |
| Total | 486 (100.0%) | $82,311 |
Family Income by Number of Earners in Summitview
The median family income in Summitview is $82,311, with families comprising 2 earners (148) having the highest median family income of $117,419, while families with no earners (105) have the lowest median family income of $56,750, accounting for 30.4% and 21.6% of families, respectively.
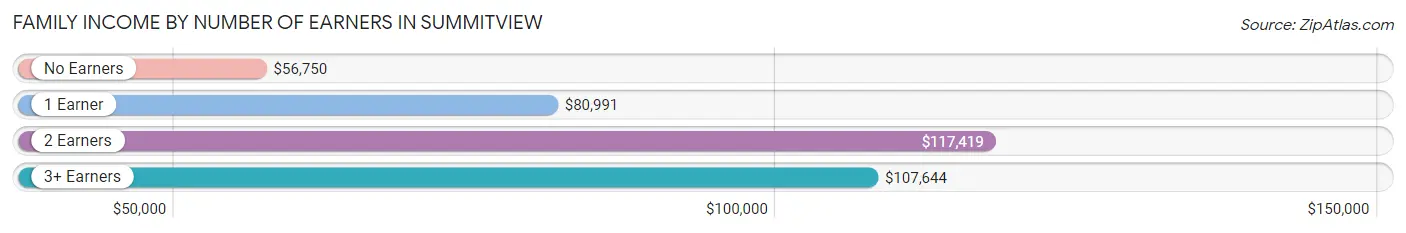
| Number of Earners | # Families | Median Income |
| No Earners | 105 (21.6%) | $56,750 |
| 1 Earner | 98 (20.2%) | $80,991 |
| 2 Earners | 148 (30.4%) | $117,419 |
| 3+ Earners | 135 (27.8%) | $107,644 |
| Total | 486 (100.0%) | $82,311 |
Household Income in Summitview
Household Income Brackets in Summitview
With 195 households falling in the category, the $50,000 to $74,999 income range is the most frequent in Summitview, accounting for 26.9% of all households.
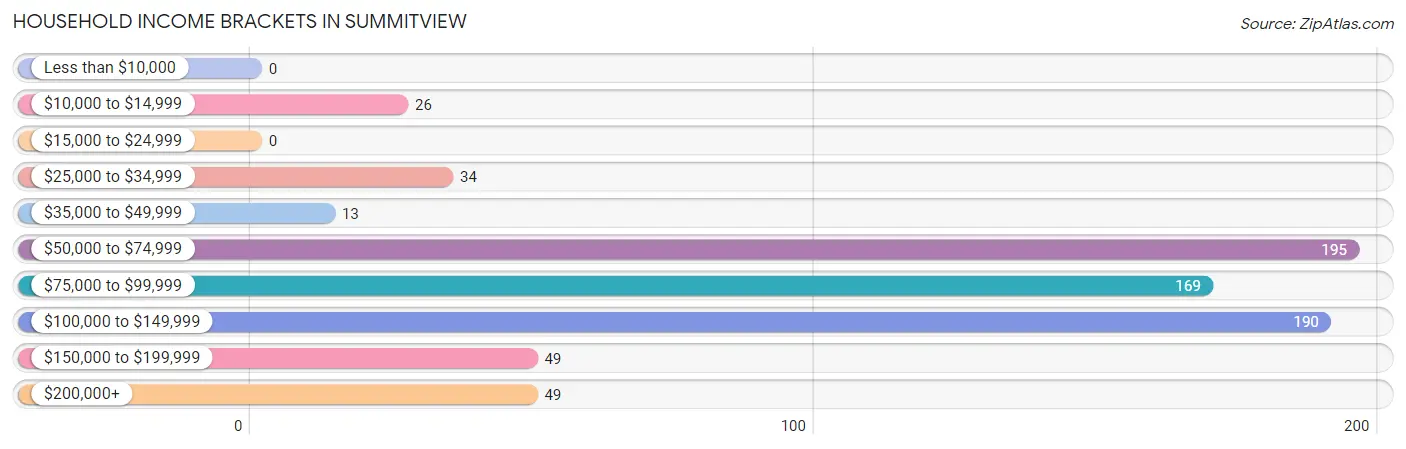
| Income Bracket | # Households | % Households |
| Less than $10,000 | 0 | 0.0% |
| $10,000 to $14,999 | 26 | 3.6% |
| $15,000 to $24,999 | 0 | 0.0% |
| $25,000 to $34,999 | 34 | 4.7% |
| $35,000 to $49,999 | 13 | 1.8% |
| $50,000 to $74,999 | 195 | 26.9% |
| $75,000 to $99,999 | 169 | 23.3% |
| $100,000 to $149,999 | 190 | 26.2% |
| $150,000 to $199,999 | 49 | 6.8% |
| $200,000+ | 49 | 6.8% |
Household Income by Householder Age in Summitview
The median household income in Summitview is $82,382, with the highest median household income of $108,606 found in the 25 to 44 years age bracket for the primary householder. A total of 173 households (23.9%) fall into this category.
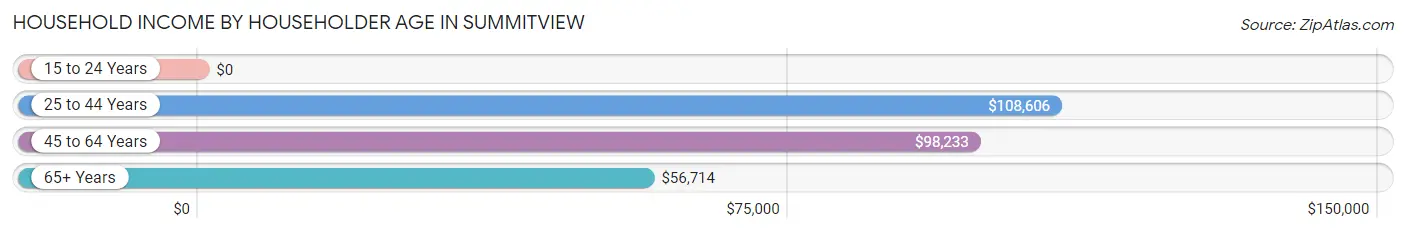
| Income Bracket | # Households | Median Income |
| 15 to 24 Years | 0 (0.0%) | $0 |
| 25 to 44 Years | 173 (23.9%) | $108,606 |
| 45 to 64 Years | 282 (38.9%) | $98,233 |
| 65+ Years | 270 (37.2%) | $56,714 |
| Total | 725 (100.0%) | $82,382 |
Poverty in Summitview
Income Below Poverty by Sex and Age in Summitview
With 8.9% poverty level for males and 2.5% for females among the residents of Summitview, 16 and 17 year old males and 75 year old and over females are the most vulnerable to poverty, with 54 males (68.3%) and 12 females (15.2%) in their respective age groups living below the poverty level.
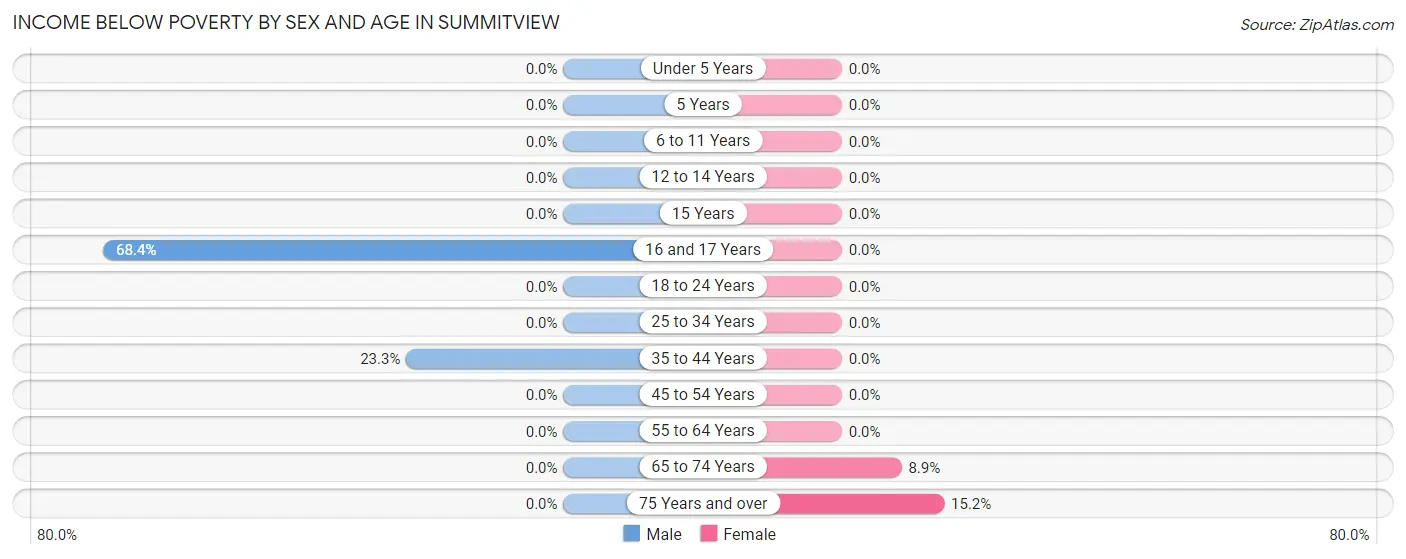
| Age Bracket | Male | Female |
| Under 5 Years | 0 (0.0%) | 0 (0.0%) |
| 5 Years | 0 (0.0%) | 0 (0.0%) |
| 6 to 11 Years | 0 (0.0%) | 0 (0.0%) |
| 12 to 14 Years | 0 (0.0%) | 0 (0.0%) |
| 15 Years | 0 (0.0%) | 0 (0.0%) |
| 16 and 17 Years | 54 (68.3%) | 0 (0.0%) |
| 18 to 24 Years | 0 (0.0%) | 0 (0.0%) |
| 25 to 34 Years | 0 (0.0%) | 0 (0.0%) |
| 35 to 44 Years | 35 (23.3%) | 0 (0.0%) |
| 45 to 54 Years | 0 (0.0%) | 0 (0.0%) |
| 55 to 64 Years | 0 (0.0%) | 0 (0.0%) |
| 65 to 74 Years | 0 (0.0%) | 14 (8.9%) |
| 75 Years and over | 0 (0.0%) | 12 (15.2%) |
| Total | 89 (8.9%) | 26 (2.5%) |
Income Above Poverty by Sex and Age in Summitview
According to the poverty statistics in Summitview, males aged under 5 years and females aged under 5 years are the age groups that are most secure financially, with 100.0% of males and 100.0% of females in these age groups living above the poverty line.
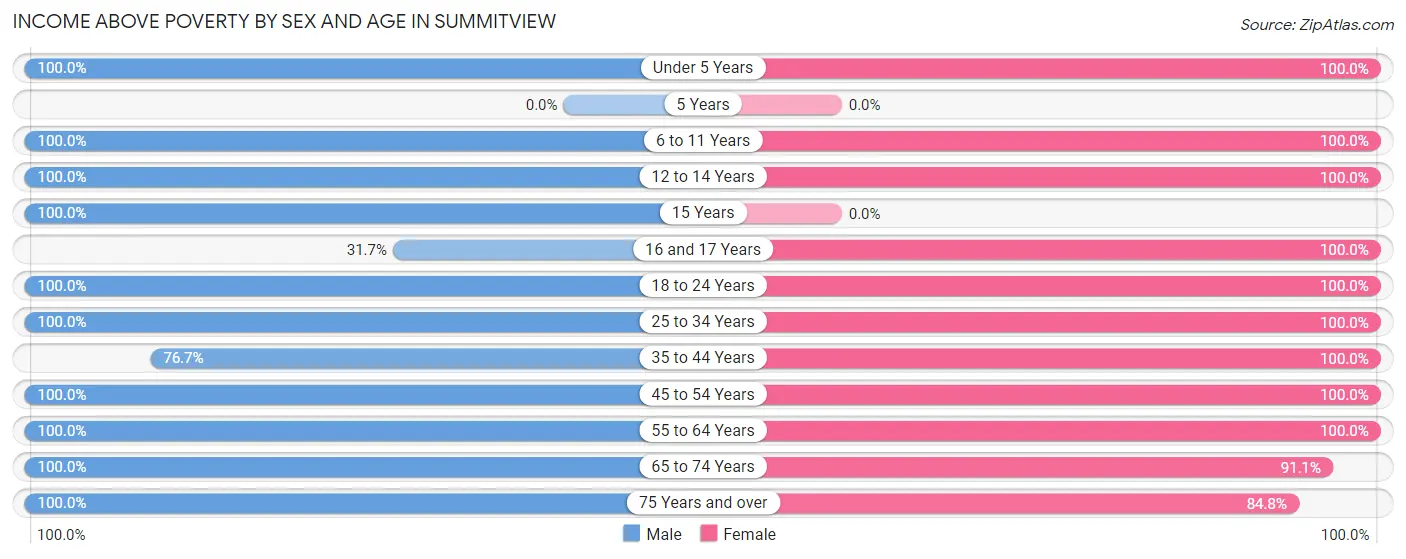
| Age Bracket | Male | Female |
| Under 5 Years | 12 (100.0%) | 14 (100.0%) |
| 5 Years | 0 (0.0%) | 0 (0.0%) |
| 6 to 11 Years | 136 (100.0%) | 33 (100.0%) |
| 12 to 14 Years | 20 (100.0%) | 72 (100.0%) |
| 15 Years | 21 (100.0%) | 0 (0.0%) |
| 16 and 17 Years | 25 (31.7%) | 30 (100.0%) |
| 18 to 24 Years | 43 (100.0%) | 161 (100.0%) |
| 25 to 34 Years | 33 (100.0%) | 103 (100.0%) |
| 35 to 44 Years | 115 (76.7%) | 135 (100.0%) |
| 45 to 54 Years | 188 (100.0%) | 153 (100.0%) |
| 55 to 64 Years | 122 (100.0%) | 102 (100.0%) |
| 65 to 74 Years | 155 (100.0%) | 144 (91.1%) |
| 75 Years and over | 38 (100.0%) | 67 (84.8%) |
| Total | 908 (91.1%) | 1,014 (97.5%) |
Income Below Poverty Among Married-Couple Families in Summitview
| Children | Above Poverty | Below Poverty |
| No Children | 204 (100.0%) | 0 (0.0%) |
| 1 or 2 Children | 192 (100.0%) | 0 (0.0%) |
| 3 or 4 Children | 14 (100.0%) | 0 (0.0%) |
| 5 or more Children | 0 (0.0%) | 0 (0.0%) |
| Total | 410 (100.0%) | 0 (0.0%) |
Income Below Poverty Among Single-Parent Households in Summitview
| Children | Single Father | Single Mother |
| No Children | 0 (0.0%) | 0 (0.0%) |
| 1 or 2 Children | 0 (0.0%) | 0 (0.0%) |
| 3 or 4 Children | 0 (0.0%) | 0 (0.0%) |
| 5 or more Children | 0 (0.0%) | 0 (0.0%) |
| Total | 0 (0.0%) | 0 (0.0%) |
Income Below Poverty Among Married-Couple vs Single-Parent Households in Summitview
| Children | Married-Couple Families | Single-Parent Households |
| No Children | 0 (0.0%) | 0 (0.0%) |
| 1 or 2 Children | 0 (0.0%) | 0 (0.0%) |
| 3 or 4 Children | 0 (0.0%) | 0 (0.0%) |
| 5 or more Children | 0 (0.0%) | 0 (0.0%) |
| Total | 0 (0.0%) | 0 (0.0%) |
Race in Summitview
The most populous races in Summitview are White / Caucasian (1,529 | 74.3%), Hispanic or Latino (469 | 22.8%), and Two or more Races (311 | 15.1%).
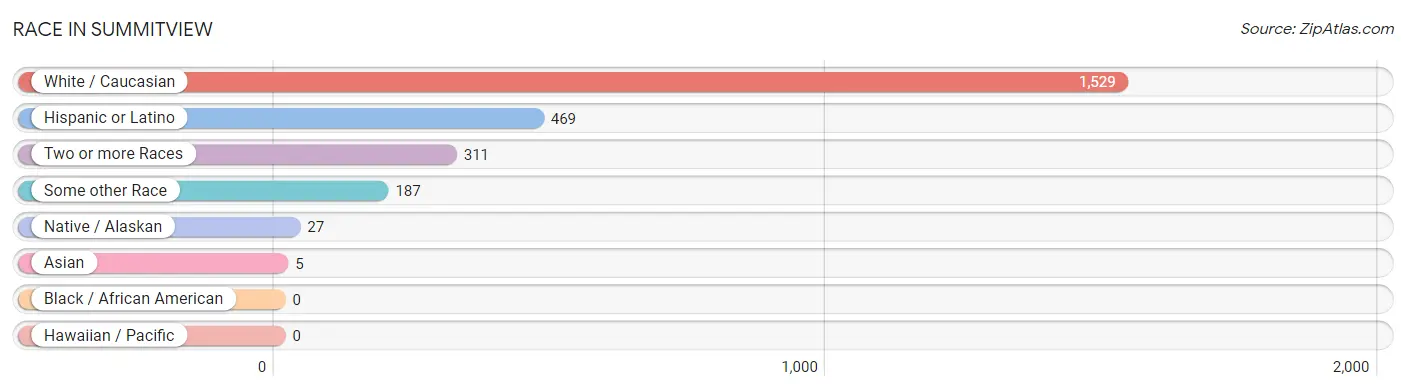
| Race | # Population | % Population |
| Asian | 5 | 0.2% |
| Black / African American | 0 | 0.0% |
| Hawaiian / Pacific | 0 | 0.0% |
| Hispanic or Latino | 469 | 22.8% |
| Native / Alaskan | 27 | 1.3% |
| White / Caucasian | 1,529 | 74.3% |
| Two or more Races | 311 | 15.1% |
| Some other Race | 187 | 9.1% |
| Total | 2,059 | 100.0% |
Ancestry in Summitview
The most populous ancestries reported in Summitview are Mexican (469 | 22.8%), German (253 | 12.3%), English (232 | 11.3%), French (171 | 8.3%), and Russian (102 | 5.0%), together accounting for 59.6% of all Summitview residents.
| Ancestry | # Population | % Population |
| American | 68 | 3.3% |
| Arab | 20 | 1.0% |
| Brazilian | 78 | 3.8% |
| Croatian | 36 | 1.8% |
| Czech | 15 | 0.7% |
| English | 232 | 11.3% |
| French | 171 | 8.3% |
| German | 253 | 12.3% |
| Indian (Asian) | 23 | 1.1% |
| Irish | 98 | 4.8% |
| Italian | 18 | 0.9% |
| Macedonian | 25 | 1.2% |
| Mexican | 469 | 22.8% |
| Northern European | 5 | 0.2% |
| Norwegian | 79 | 3.8% |
| Polish | 19 | 0.9% |
| Portuguese | 18 | 0.9% |
| Russian | 102 | 5.0% |
| Scottish | 11 | 0.5% |
| Swedish | 25 | 1.2% |
| Swiss | 12 | 0.6% |
| Tlingit-Haida | 27 | 1.3% |
| Welsh | 14 | 0.7% | View All 23 Rows |
Immigrants in Summitview
The most numerous immigrant groups reported in Summitview came from Brazil (20 | 1.0%), Latin America (20 | 1.0%), South America (20 | 1.0%), Europe (17 | 0.8%), and Germany (17 | 0.8%), together accounting for 4.6% of all Summitview residents.
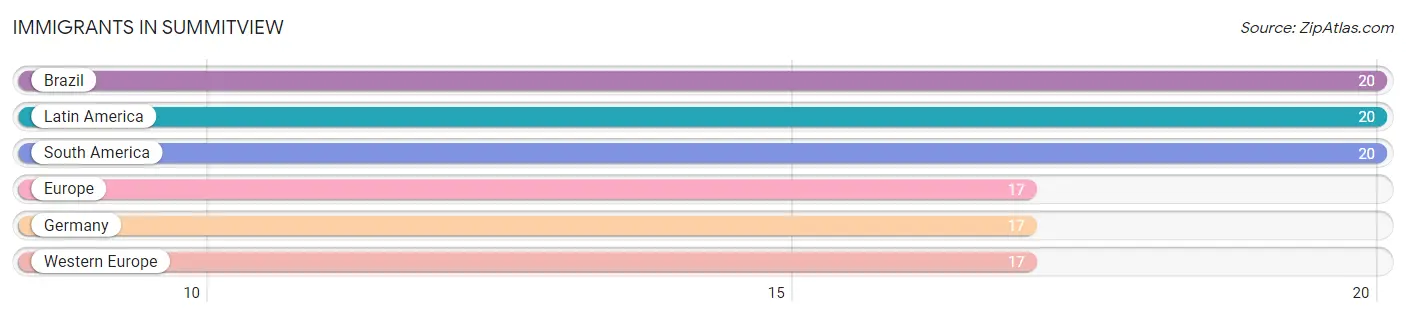
| Immigration Origin | # Population | % Population |
| Brazil | 20 | 1.0% |
| Europe | 17 | 0.8% |
| Germany | 17 | 0.8% |
| Latin America | 20 | 1.0% |
| South America | 20 | 1.0% |
| Western Europe | 17 | 0.8% | View All 6 Rows |
Sex and Age in Summitview
Sex and Age in Summitview
The most populous age groups in Summitview are 5 to 9 Years (118 | 11.6%) for men and 70 to 74 Years (129 | 12.4%) for women.

| Age Bracket | Male | Female |
| Under 5 Years | 12 (1.2%) | 14 (1.3%) |
| 5 to 9 Years | 118 (11.6%) | 21 (2.0%) |
| 10 to 14 Years | 60 (5.9%) | 84 (8.1%) |
| 15 to 19 Years | 100 (9.8%) | 100 (9.6%) |
| 20 to 24 Years | 43 (4.2%) | 91 (8.7%) |
| 25 to 29 Years | 33 (3.2%) | 15 (1.4%) |
| 30 to 34 Years | 0 (0.0%) | 88 (8.5%) |
| 35 to 39 Years | 92 (9.0%) | 71 (6.8%) |
| 40 to 44 Years | 58 (5.7%) | 64 (6.1%) |
| 45 to 49 Years | 71 (7.0%) | 55 (5.3%) |
| 50 to 54 Years | 117 (11.5%) | 98 (9.4%) |
| 55 to 59 Years | 70 (6.9%) | 35 (3.4%) |
| 60 to 64 Years | 52 (5.1%) | 67 (6.4%) |
| 65 to 69 Years | 102 (10.0%) | 29 (2.8%) |
| 70 to 74 Years | 53 (5.2%) | 129 (12.4%) |
| 75 to 79 Years | 21 (2.1%) | 24 (2.3%) |
| 80 to 84 Years | 17 (1.7%) | 38 (3.6%) |
| 85 Years and over | 0 (0.0%) | 17 (1.6%) |
| Total | 1,019 (100.0%) | 1,040 (100.0%) |
Families and Households in Summitview
Median Family Size in Summitview
The median family size in Summitview is 3.36 persons per family, with single female/mother families (58 | 11.9%) accounting for the largest median family size of 4.02 persons per family. On the other hand, single male/father families (18 | 3.7%) represent the smallest median family size with 3.06 persons per family.
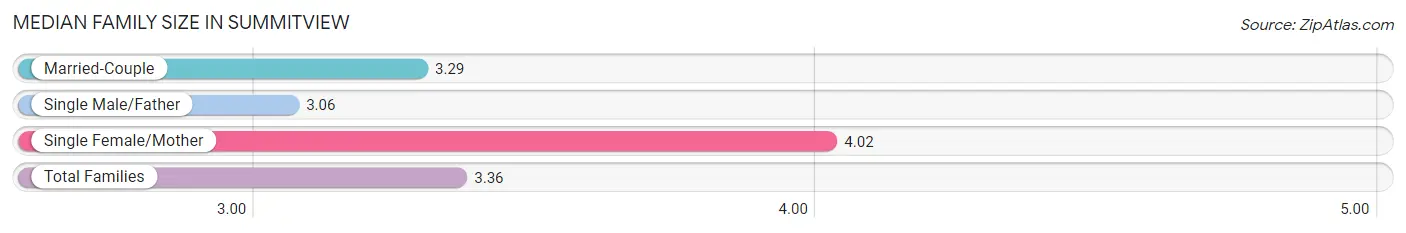
| Family Type | # Families | Family Size |
| Married-Couple | 410 (84.4%) | 3.29 |
| Single Male/Father | 18 (3.7%) | 3.06 |
| Single Female/Mother | 58 (11.9%) | 4.02 |
| Total Families | 486 (100.0%) | 3.36 |
Median Household Size in Summitview
The median household size in Summitview is 2.84 persons per household, with single female/mother households (58 | 8.0%) accounting for the largest median household size of 4.91 persons per household. non-family households (239 | 33.0%) represent the smallest median household size with 1.46 persons per household.
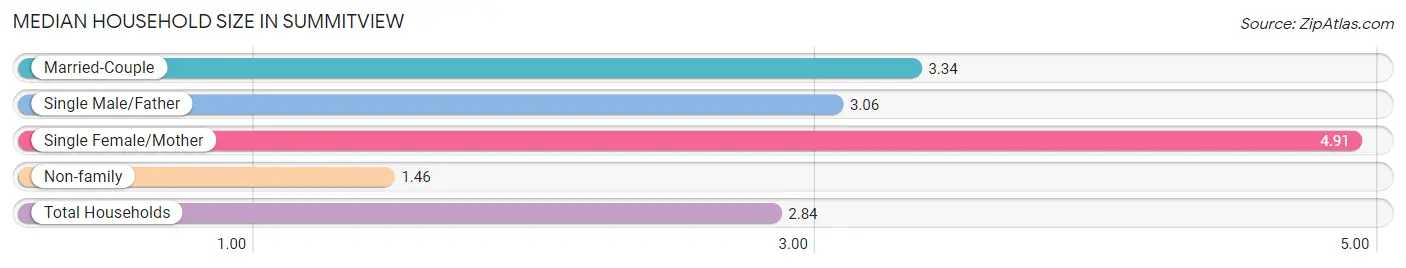
| Household Type | # Households | Household Size |
| Married-Couple | 410 (56.6%) | 3.34 |
| Single Male/Father | 18 (2.5%) | 3.06 |
| Single Female/Mother | 58 (8.0%) | 4.91 |
| Non-family | 239 (33.0%) | 1.46 |
| Total Households | 725 (100.0%) | 2.84 |
Household Size by Marriage Status in Summitview
Out of a total of 725 households in Summitview, 486 (67.0%) are family households, while 239 (33.0%) are nonfamily households. The most numerous type of family households are 3-person households, comprising 148, and the most common type of nonfamily households are 1-person households, comprising 162.
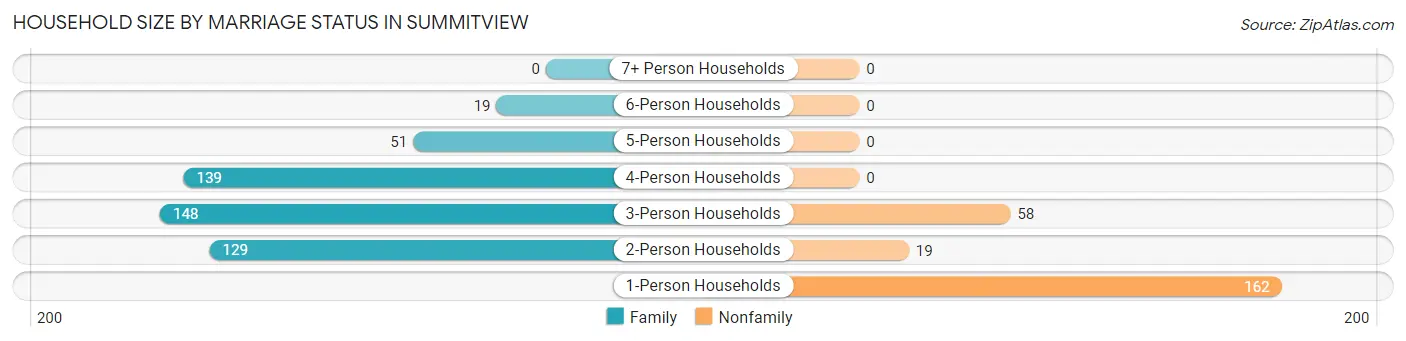
| Household Size | Family Households | Nonfamily Households |
| 1-Person Households | - | 162 (22.3%) |
| 2-Person Households | 129 (17.8%) | 19 (2.6%) |
| 3-Person Households | 148 (20.4%) | 58 (8.0%) |
| 4-Person Households | 139 (19.2%) | 0 (0.0%) |
| 5-Person Households | 51 (7.0%) | 0 (0.0%) |
| 6-Person Households | 19 (2.6%) | 0 (0.0%) |
| 7+ Person Households | 0 (0.0%) | 0 (0.0%) |
| Total | 486 (67.0%) | 239 (33.0%) |
Female Fertility in Summitview
Fertility by Age in Summitview
| Age Bracket | Women with Births | Births / 1,000 Women |
| 15 to 19 years | 0 (0.0%) | 0.0 |
| 20 to 34 years | 0 (0.0%) | 0.0 |
| 35 to 50 years | 0 (0.0%) | 0.0 |
| Total | 0 (0.0%) | 0.0 |
Fertility by Age by Marriage Status in Summitview
| Age Bracket | Married | Unmarried |
| 15 to 19 years | 0 (0.0%) | 0 (0.0%) |
| 20 to 34 years | 0 (0.0%) | 0 (0.0%) |
| 35 to 50 years | 0 (0.0%) | 0 (0.0%) |
| Total | 0 (0.0%) | 0 (0.0%) |
Fertility by Education in Summitview
| Educational Attainment | Women with Births | Births / 1,000 Women |
| Less than High School | 0 (0.0%) | 0.0 |
| High School Diploma | 0 (0.0%) | 0.0 |
| College or Associate's Degree | 0 (0.0%) | 0.0 |
| Bachelor's Degree | 0 (0.0%) | 0.0 |
| Graduate Degree | 0 (0.0%) | 0.0 |
| Total | 0 (0.0%) | 0.0 |
Fertility by Education by Marriage Status in Summitview
| Educational Attainment | Married | Unmarried |
| Less than High School | 0 (0.0%) | 0 (0.0%) |
| High School Diploma | 0 (0.0%) | 0 (0.0%) |
| College or Associate's Degree | 0 (0.0%) | 0 (0.0%) |
| Bachelor's Degree | 0 (0.0%) | 0 (0.0%) |
| Graduate Degree | 0 (0.0%) | 0 (0.0%) |
| Total | 0 (0.0%) | 0 (0.0%) |
Employment Characteristics in Summitview
Employment by Class of Employer in Summitview
Among the 1,058 employed individuals in Summitview, private company employees (710 | 67.1%), state government employees (152 | 14.4%), and not-for-profit organizations (69 | 6.5%) make up the most common classes of employment.
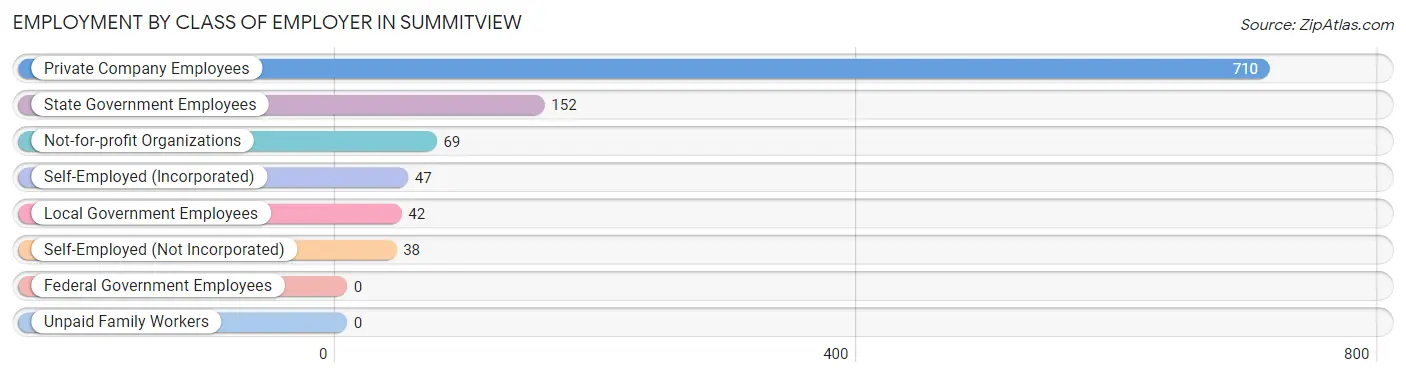
| Employer Class | # Employees | % Employees |
| Private Company Employees | 710 | 67.1% |
| Self-Employed (Incorporated) | 47 | 4.4% |
| Self-Employed (Not Incorporated) | 38 | 3.6% |
| Not-for-profit Organizations | 69 | 6.5% |
| Local Government Employees | 42 | 4.0% |
| State Government Employees | 152 | 14.4% |
| Federal Government Employees | 0 | 0.0% |
| Unpaid Family Workers | 0 | 0.0% |
| Total | 1,058 | 100.0% |
Employment Status by Age in Summitview
According to the labor force statistics for Summitview, out of the total population over 16 years of age (1,729), 63.9% or 1,105 individuals are in the labor force, with 1.3% or 14 of them unemployed. The age group with the highest labor force participation rate is 20 to 24 years, with 100.0% or 134 individuals in the labor force. Within the labor force, the 35 to 44 years age range has the highest percentage of unemployed individuals, with 4.9% or 14 of them being unemployed.
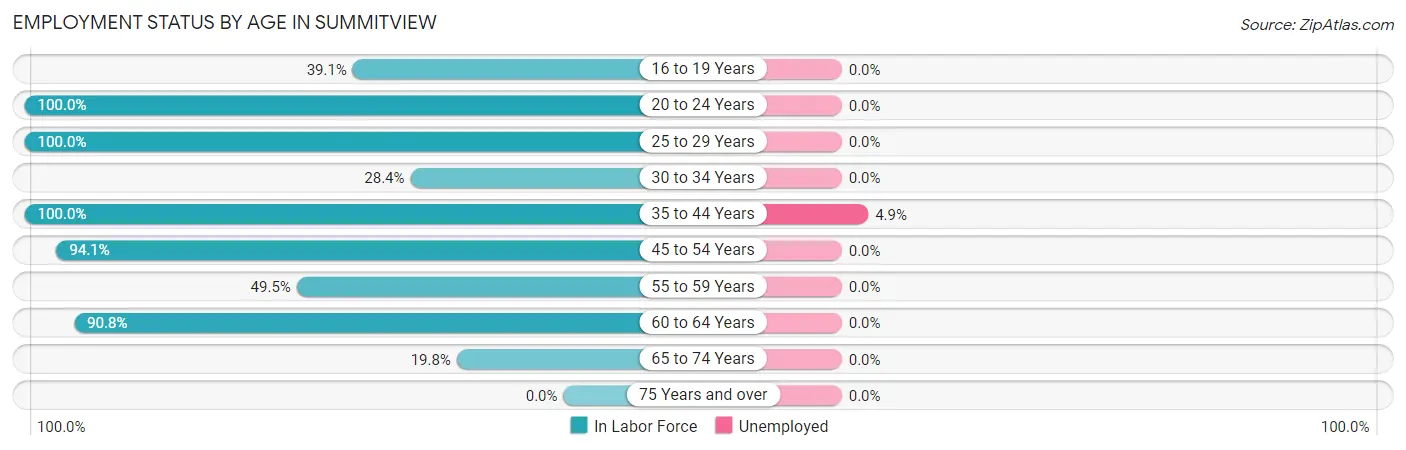
| Age Bracket | In Labor Force | Unemployed |
| 16 to 19 Years | 70 (39.1%) | 0 (0.0%) |
| 20 to 24 Years | 134 (100.0%) | 0 (0.0%) |
| 25 to 29 Years | 48 (100.0%) | 0 (0.0%) |
| 30 to 34 Years | 25 (28.4%) | 0 (0.0%) |
| 35 to 44 Years | 285 (100.0%) | 14 (4.9%) |
| 45 to 54 Years | 321 (94.1%) | 0 (0.0%) |
| 55 to 59 Years | 52 (49.5%) | 0 (0.0%) |
| 60 to 64 Years | 108 (90.8%) | 0 (0.0%) |
| 65 to 74 Years | 62 (19.8%) | 0 (0.0%) |
| 75 Years and over | 0 (0.0%) | 0 (0.0%) |
| Total | 1,105 (63.9%) | 14 (1.3%) |
Employment Status by Educational Attainment in Summitview
According to labor force statistics for Summitview, 85.1% of individuals (839) out of the total population between 25 and 64 years of age (986) are in the labor force, with 1.7% or 14 of them being unemployed. The group with the highest labor force participation rate are those with the educational attainment of high school diploma, with 100.0% or 261 individuals in the labor force. Within the labor force, individuals with bachelor's degree or higher education have the highest percentage of unemployment, with 5.9% or 14 of them being unemployed.
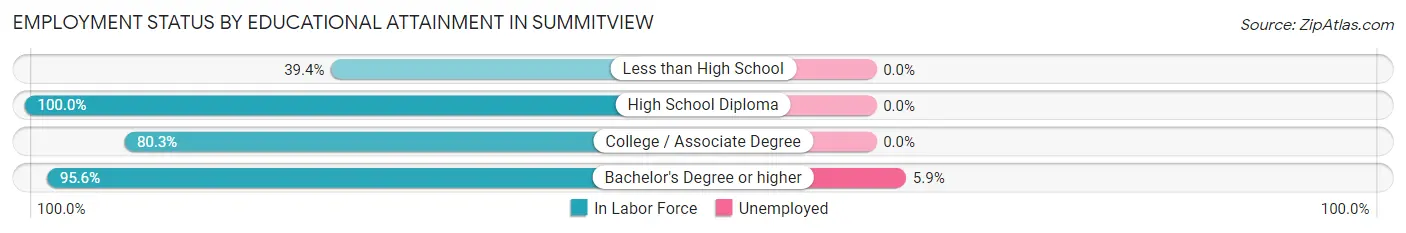
| Educational Attainment | In Labor Force | Unemployed |
| Less than High School | 41 (39.4%) | 0 (0.0%) |
| High School Diploma | 261 (100.0%) | 0 (0.0%) |
| College / Associate Degree | 298 (80.3%) | 0 (0.0%) |
| Bachelor's Degree or higher | 239 (95.6%) | 15 (5.9%) |
| Total | 839 (85.1%) | 17 (1.7%) |
Employment Occupations by Sex in Summitview
Management, Business, Science and Arts Occupations
The most common Management, Business, Science and Arts occupations in Summitview are Community & Social Service (138 | 12.7%), Management (124 | 11.4%), Health Diagnosing & Treating (69 | 6.3%), Health Technologists (64 | 5.9%), and Education Instruction & Library (50 | 4.6%).
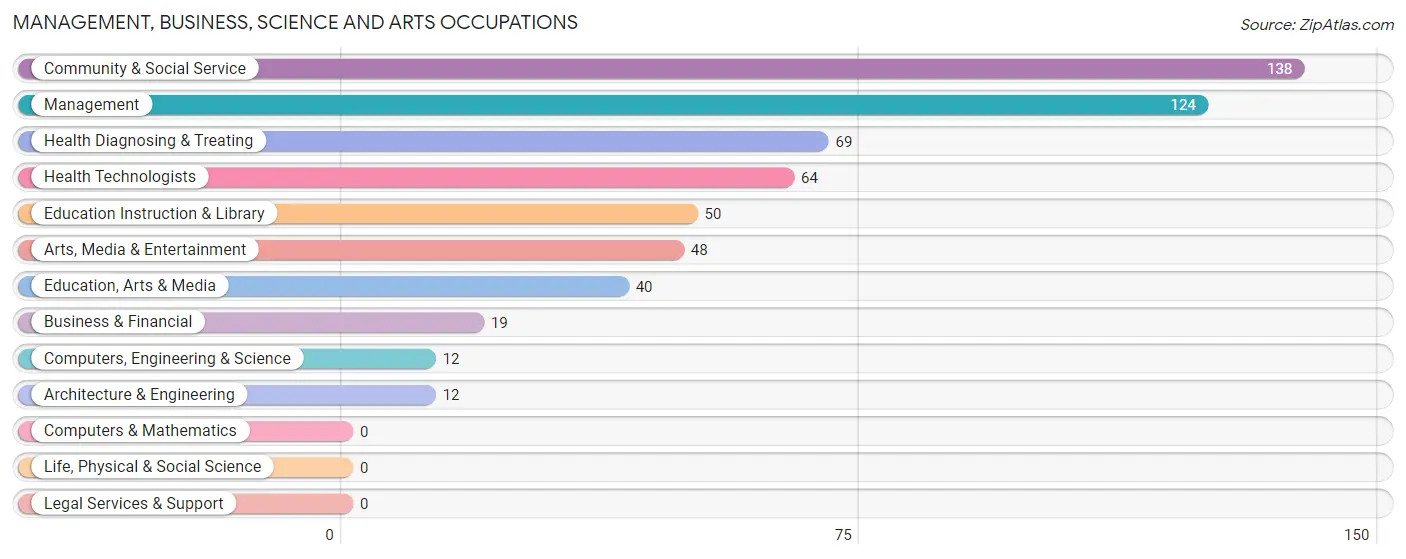
Management, Business, Science and Arts Occupations by Sex
Within the Management, Business, Science and Arts occupations in Summitview, the most male-oriented occupations are Business & Financial (100.0%), Computers, Engineering & Science (100.0%), and Architecture & Engineering (100.0%), while the most female-oriented occupations are Education, Arts & Media (100.0%), Arts, Media & Entertainment (100.0%), and Community & Social Service (89.1%).
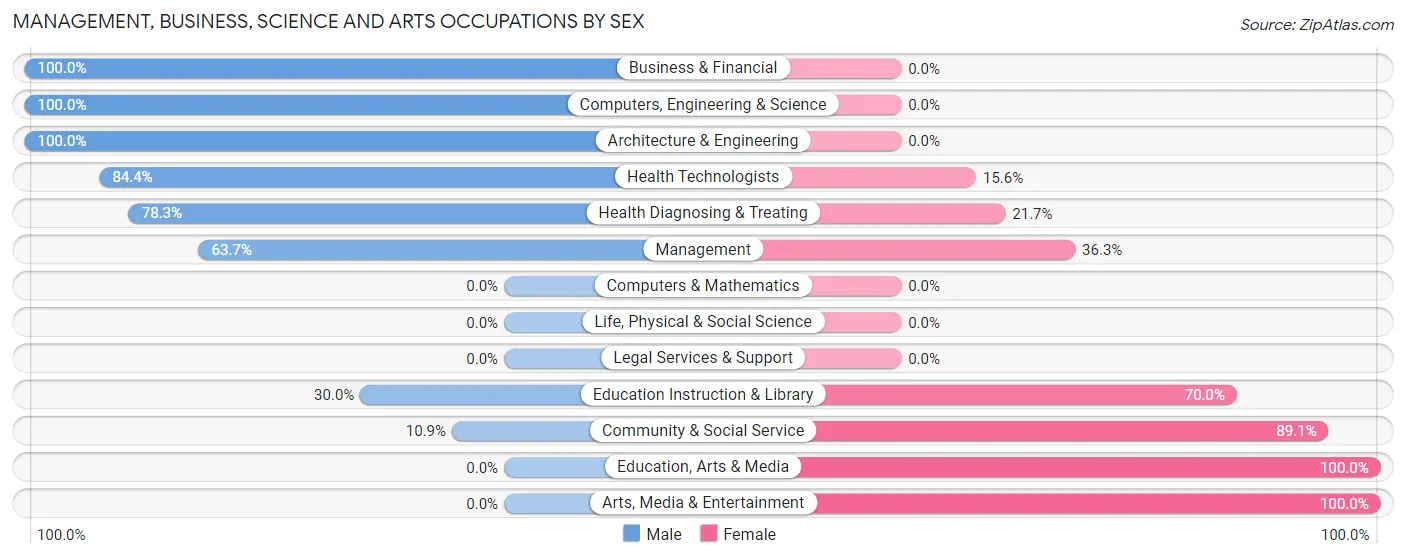
| Occupation | Male | Female |
| Management | 79 (63.7%) | 45 (36.3%) |
| Business & Financial | 19 (100.0%) | 0 (0.0%) |
| Computers, Engineering & Science | 12 (100.0%) | 0 (0.0%) |
| Computers & Mathematics | 0 (0.0%) | 0 (0.0%) |
| Architecture & Engineering | 12 (100.0%) | 0 (0.0%) |
| Life, Physical & Social Science | 0 (0.0%) | 0 (0.0%) |
| Community & Social Service | 15 (10.9%) | 123 (89.1%) |
| Education, Arts & Media | 0 (0.0%) | 40 (100.0%) |
| Legal Services & Support | 0 (0.0%) | 0 (0.0%) |
| Education Instruction & Library | 15 (30.0%) | 35 (70.0%) |
| Arts, Media & Entertainment | 0 (0.0%) | 48 (100.0%) |
| Health Diagnosing & Treating | 54 (78.3%) | 15 (21.7%) |
| Health Technologists | 54 (84.4%) | 10 (15.6%) |
| Total (Category) | 179 (49.4%) | 183 (50.5%) |
| Total (Overall) | 511 (46.8%) | 580 (53.2%) |
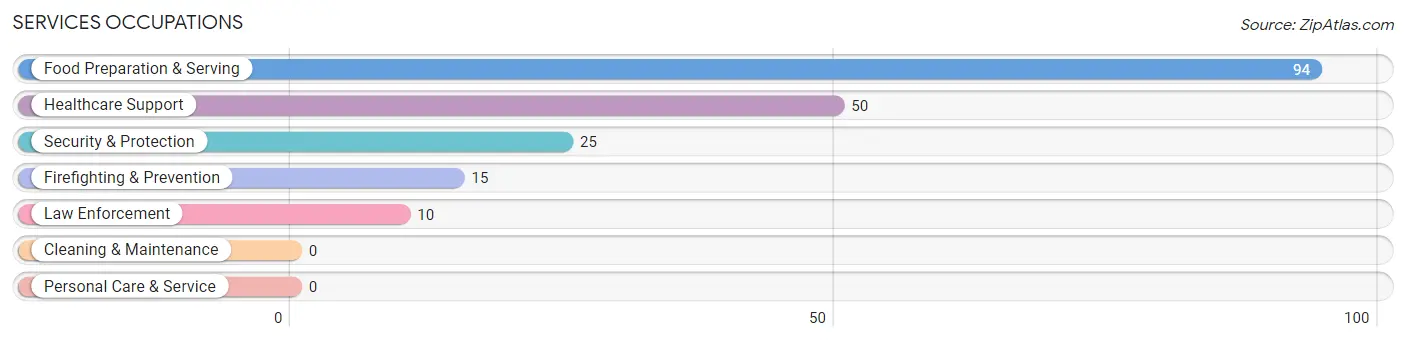
Services Occupations
The most common Services occupations in Summitview are Food Preparation & Serving (94 | 8.6%), Healthcare Support (50 | 4.6%), Security & Protection (25 | 2.3%), Firefighting & Prevention (15 | 1.4%), and Law Enforcement (10 | 0.9%).
Services Occupations by Sex
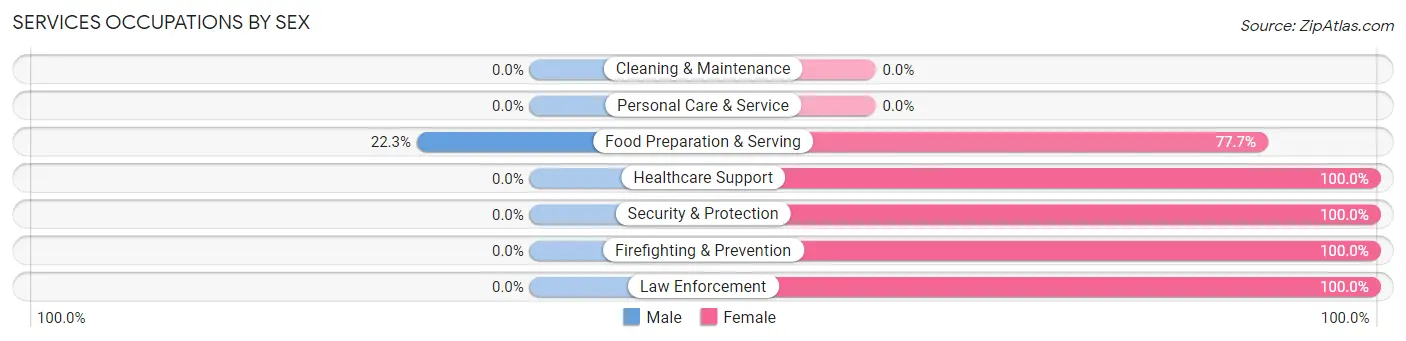
| Occupation | Male | Female |
| Healthcare Support | 0 (0.0%) | 50 (100.0%) |
| Security & Protection | 0 (0.0%) | 25 (100.0%) |
| Firefighting & Prevention | 0 (0.0%) | 15 (100.0%) |
| Law Enforcement | 0 (0.0%) | 10 (100.0%) |
| Food Preparation & Serving | 21 (22.3%) | 73 (77.7%) |
| Cleaning & Maintenance | 0 (0.0%) | 0 (0.0%) |
| Personal Care & Service | 0 (0.0%) | 0 (0.0%) |
| Total (Category) | 21 (12.4%) | 148 (87.6%) |
| Total (Overall) | 511 (46.8%) | 580 (53.2%) |
Sales and Office Occupations
The most common Sales and Office occupations in Summitview are Office & Administration (214 | 19.6%), and Sales & Related (39 | 3.6%).
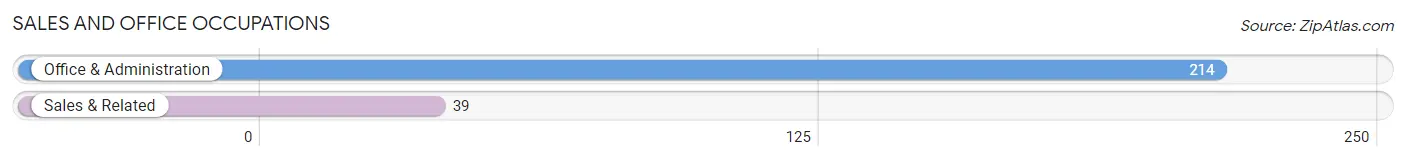
Sales and Office Occupations by Sex
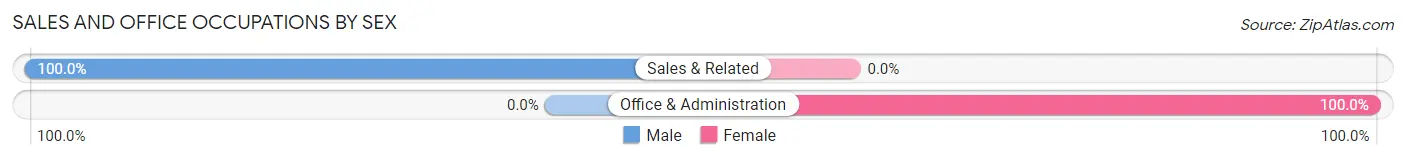
| Occupation | Male | Female |
| Sales & Related | 39 (100.0%) | 0 (0.0%) |
| Office & Administration | 0 (0.0%) | 214 (100.0%) |
| Total (Category) | 39 (15.4%) | 214 (84.6%) |
| Total (Overall) | 511 (46.8%) | 580 (53.2%) |
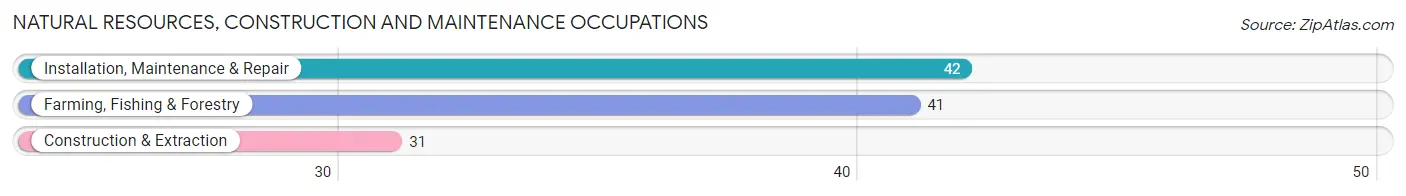
Natural Resources, Construction and Maintenance Occupations
The most common Natural Resources, Construction and Maintenance occupations in Summitview are Installation, Maintenance & Repair (42 | 3.8%), Farming, Fishing & Forestry (41 | 3.8%), and Construction & Extraction (31 | 2.8%).
Natural Resources, Construction and Maintenance Occupations by Sex
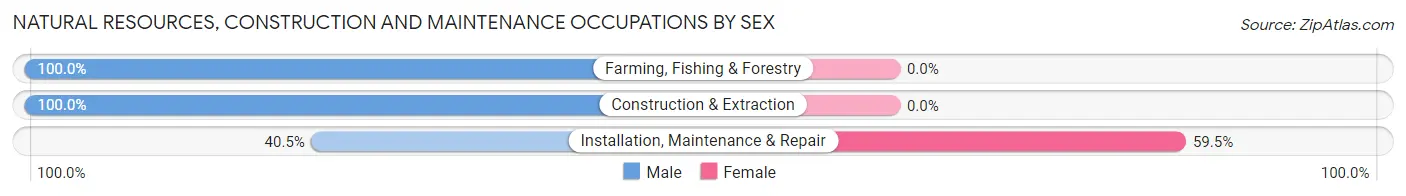
| Occupation | Male | Female |
| Farming, Fishing & Forestry | 41 (100.0%) | 0 (0.0%) |
| Construction & Extraction | 31 (100.0%) | 0 (0.0%) |
| Installation, Maintenance & Repair | 17 (40.5%) | 25 (59.5%) |
| Total (Category) | 89 (78.1%) | 25 (21.9%) |
| Total (Overall) | 511 (46.8%) | 580 (53.2%) |
Production, Transportation and Moving Occupations
The most common Production, Transportation and Moving occupations in Summitview are Production (123 | 11.3%), Material Moving (45 | 4.1%), and Transportation (25 | 2.3%).
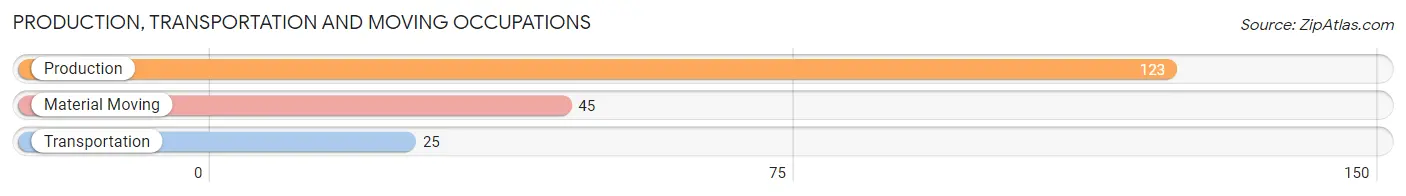
Production, Transportation and Moving Occupations by Sex
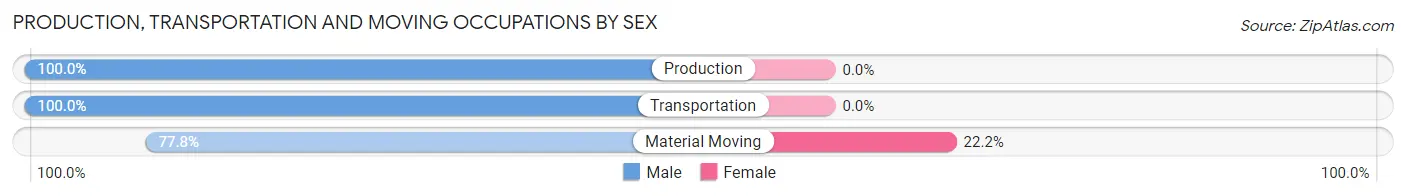
| Occupation | Male | Female |
| Production | 123 (100.0%) | 0 (0.0%) |
| Transportation | 25 (100.0%) | 0 (0.0%) |
| Material Moving | 35 (77.8%) | 10 (22.2%) |
| Total (Category) | 183 (94.8%) | 10 (5.2%) |
| Total (Overall) | 511 (46.8%) | 580 (53.2%) |
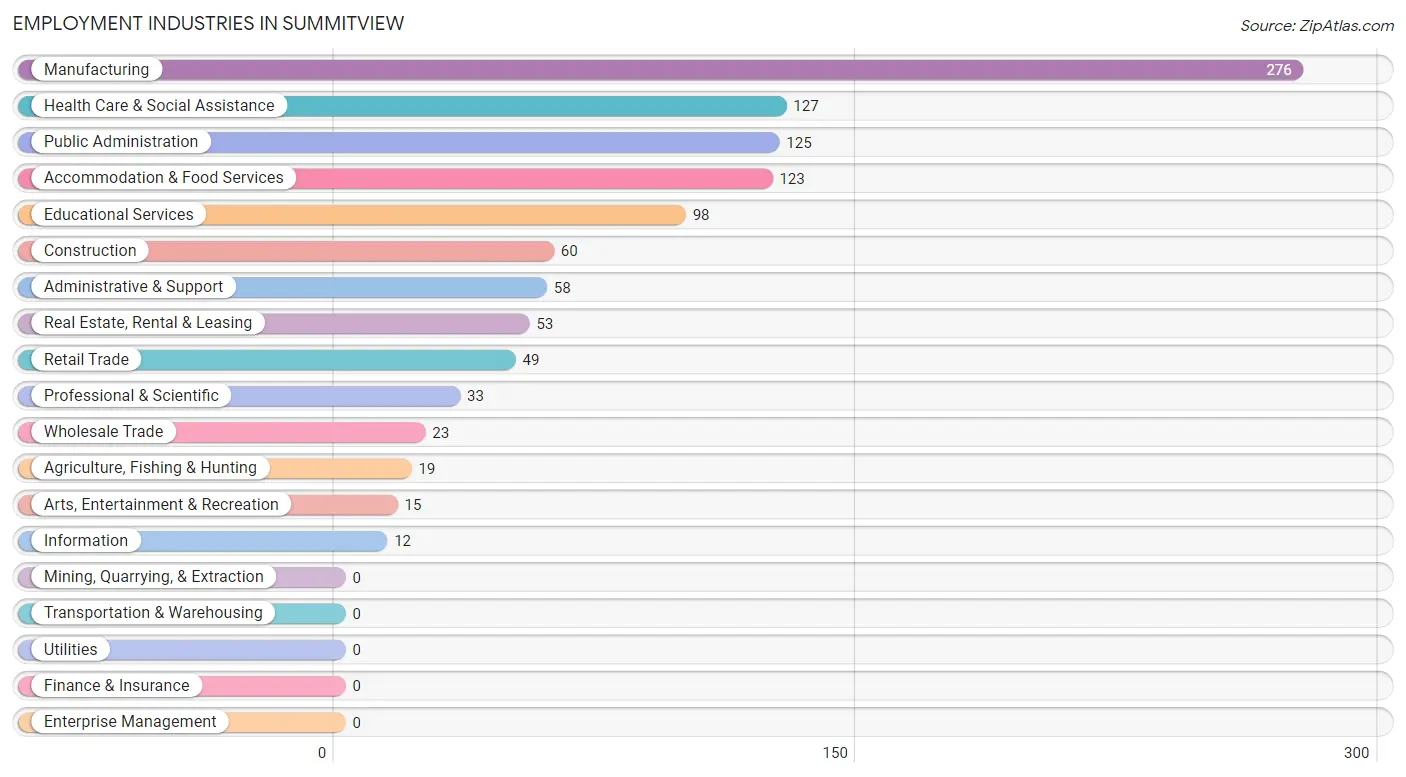
Employment Industries by Sex in Summitview
Employment Industries in Summitview
The major employment industries in Summitview include Manufacturing (276 | 25.3%), Health Care & Social Assistance (127 | 11.6%), Public Administration (125 | 11.5%), Accommodation & Food Services (123 | 11.3%), and Educational Services (98 | 9.0%).
Employment Industries by Sex in Summitview
The Summitview industries that see more men than women are Agriculture, Fishing & Hunting (100.0%), Construction (100.0%), and Wholesale Trade (100.0%), whereas the industries that tend to have a higher number of women are Information (100.0%), Real Estate, Rental & Leasing (100.0%), and Professional & Scientific (100.0%).
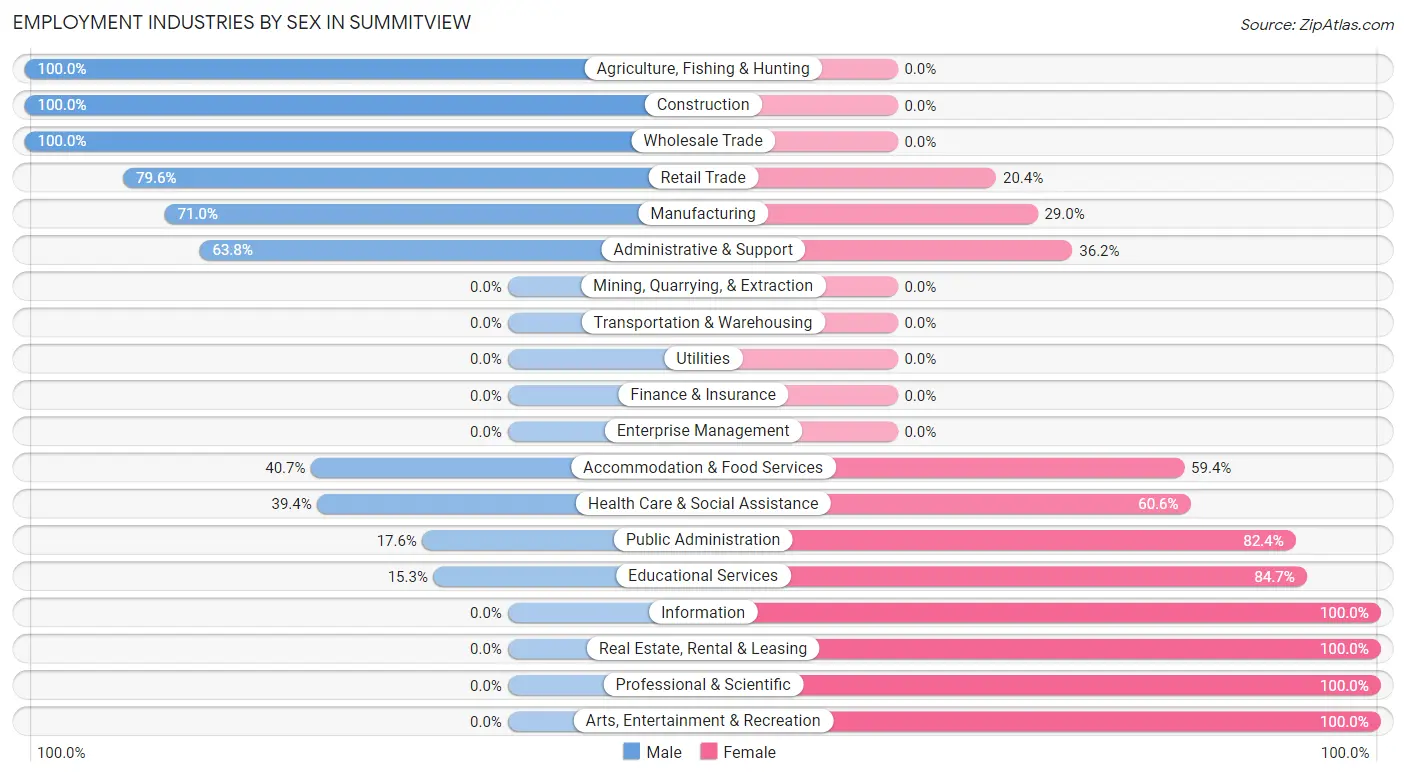
| Industry | Male | Female |
| Agriculture, Fishing & Hunting | 19 (100.0%) | 0 (0.0%) |
| Mining, Quarrying, & Extraction | 0 (0.0%) | 0 (0.0%) |
| Construction | 60 (100.0%) | 0 (0.0%) |
| Manufacturing | 196 (71.0%) | 80 (29.0%) |
| Wholesale Trade | 23 (100.0%) | 0 (0.0%) |
| Retail Trade | 39 (79.6%) | 10 (20.4%) |
| Transportation & Warehousing | 0 (0.0%) | 0 (0.0%) |
| Utilities | 0 (0.0%) | 0 (0.0%) |
| Information | 0 (0.0%) | 12 (100.0%) |
| Finance & Insurance | 0 (0.0%) | 0 (0.0%) |
| Real Estate, Rental & Leasing | 0 (0.0%) | 53 (100.0%) |
| Professional & Scientific | 0 (0.0%) | 33 (100.0%) |
| Enterprise Management | 0 (0.0%) | 0 (0.0%) |
| Administrative & Support | 37 (63.8%) | 21 (36.2%) |
| Educational Services | 15 (15.3%) | 83 (84.7%) |
| Health Care & Social Assistance | 50 (39.4%) | 77 (60.6%) |
| Arts, Entertainment & Recreation | 0 (0.0%) | 15 (100.0%) |
| Accommodation & Food Services | 50 (40.6%) | 73 (59.4%) |
| Public Administration | 22 (17.6%) | 103 (82.4%) |
| Total | 511 (46.8%) | 580 (53.2%) |
Education in Summitview
School Enrollment in Summitview
The most common levels of schooling among the 548 students in Summitview are high school (175 | 31.9%), elementary school (158 | 28.8%), and middle school (112 | 20.4%).
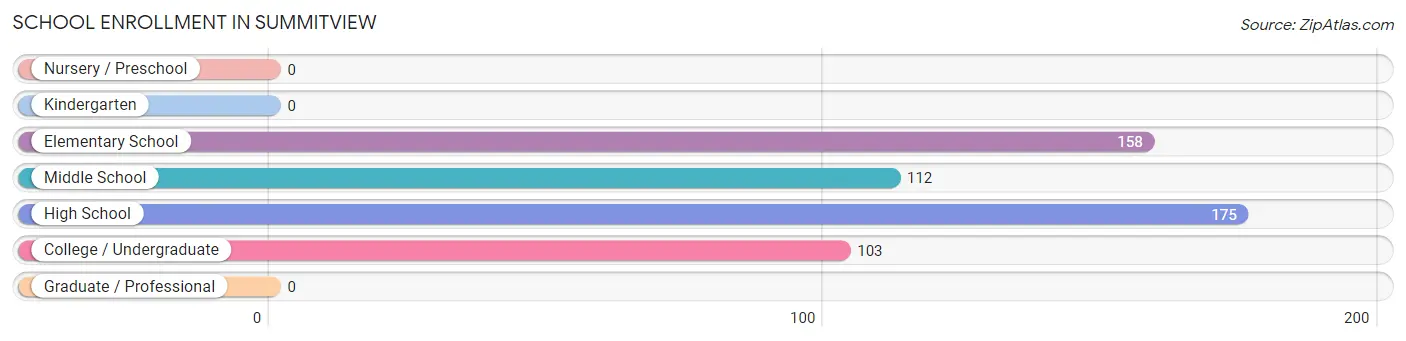
| School Level | # Students | % Students |
| Nursery / Preschool | 0 | 0.0% |
| Kindergarten | 0 | 0.0% |
| Elementary School | 158 | 28.8% |
| Middle School | 112 | 20.4% |
| High School | 175 | 31.9% |
| College / Undergraduate | 103 | 18.8% |
| Graduate / Professional | 0 | 0.0% |
| Total | 548 | 100.0% |
School Enrollment by Age by Funding Source in Summitview
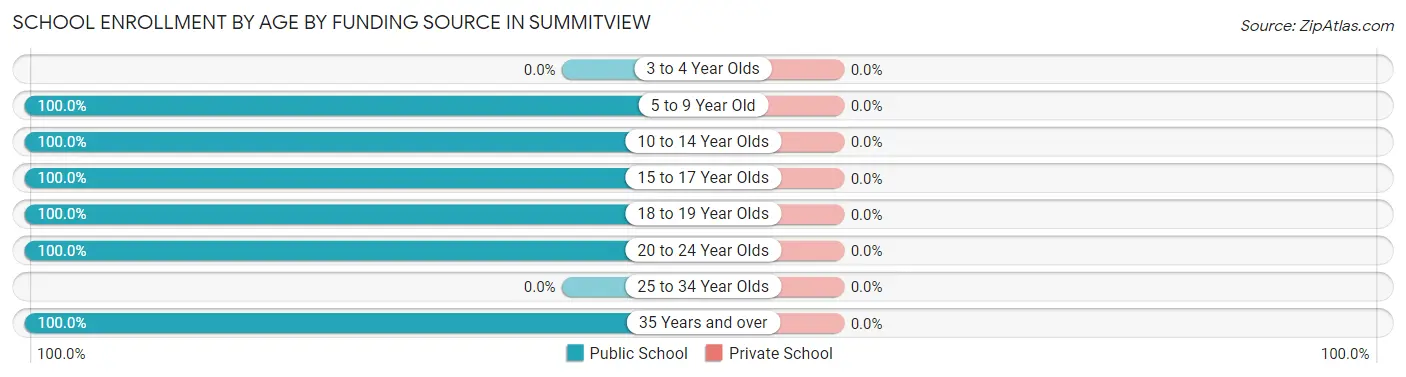
| Age Bracket | Public School | Private School |
| 3 to 4 Year Olds | 0 (0.0%) | 0 (0.0%) |
| 5 to 9 Year Old | 139 (100.0%) | 0 (0.0%) |
| 10 to 14 Year Olds | 144 (100.0%) | 0 (0.0%) |
| 15 to 17 Year Olds | 130 (100.0%) | 0 (0.0%) |
| 18 to 19 Year Olds | 32 (100.0%) | 0 (0.0%) |
| 20 to 24 Year Olds | 77 (100.0%) | 0 (0.0%) |
| 25 to 34 Year Olds | 0 (0.0%) | 0 (0.0%) |
| 35 Years and over | 26 (100.0%) | 0 (0.0%) |
| Total | 548 (100.0%) | 0 (0.0%) |
Educational Attainment by Field of Study in Summitview
Education (164 | 30.6%), science & technology (84 | 15.7%), business (78 | 14.6%), bio, nature & agricultural (56 | 10.5%), and social sciences (36 | 6.7%) are the most common fields of study among 535 individuals in Summitview who have obtained a bachelor's degree or higher.
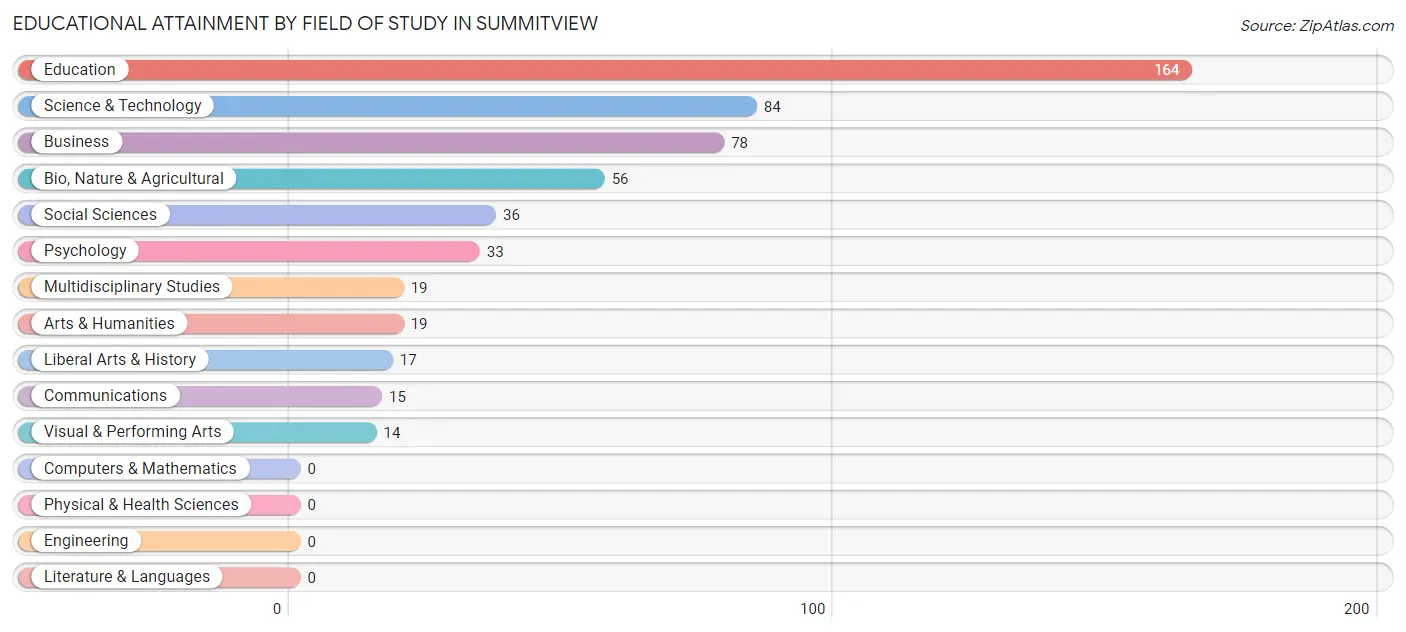
| Field of Study | # Graduates | % Graduates |
| Computers & Mathematics | 0 | 0.0% |
| Bio, Nature & Agricultural | 56 | 10.5% |
| Physical & Health Sciences | 0 | 0.0% |
| Psychology | 33 | 6.2% |
| Social Sciences | 36 | 6.7% |
| Engineering | 0 | 0.0% |
| Multidisciplinary Studies | 19 | 3.5% |
| Science & Technology | 84 | 15.7% |
| Business | 78 | 14.6% |
| Education | 164 | 30.6% |
| Literature & Languages | 0 | 0.0% |
| Liberal Arts & History | 17 | 3.2% |
| Visual & Performing Arts | 14 | 2.6% |
| Communications | 15 | 2.8% |
| Arts & Humanities | 19 | 3.5% |
| Total | 535 | 100.0% |
Transportation & Commute in Summitview
Vehicle Availability by Sex in Summitview
The most prevalent vehicle ownership categories in Summitview are males with 4 vehicles (205, accounting for 40.1%) and females with 4 vehicles (174, making up 37.5%).
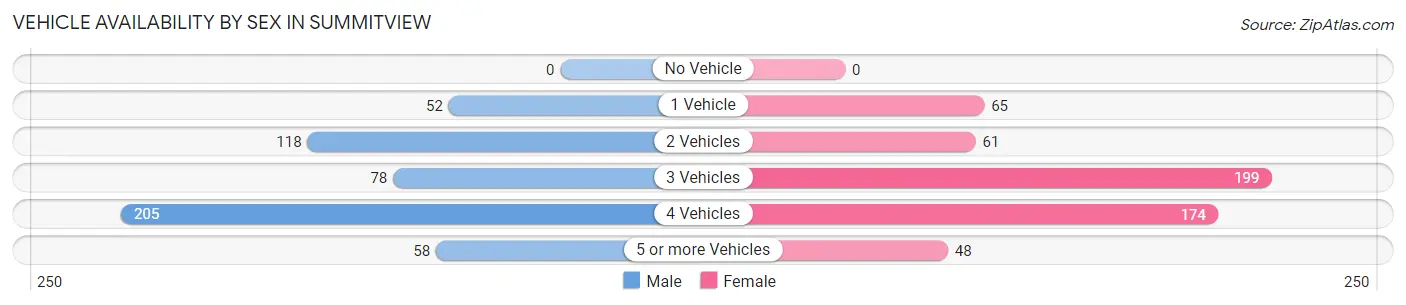
| Vehicles Available | Male | Female |
| No Vehicle | 0 (0.0%) | 0 (0.0%) |
| 1 Vehicle | 52 (10.2%) | 65 (11.9%) |
| 2 Vehicles | 118 (23.1%) | 61 (11.2%) |
| 3 Vehicles | 78 (15.3%) | 199 (36.4%) |
| 4 Vehicles | 205 (40.1%) | 174 (31.8%) |
| 5 or more Vehicles | 58 (11.4%) | 48 (8.8%) |
| Total | 511 (100.0%) | 547 (100.0%) |
Commute Time in Summitview
The most frequently occuring commute durations in Summitview are 20 to 24 minutes (379 commuters, 38.8%), 15 to 19 minutes (360 commuters, 36.8%), and 10 to 14 minutes (110 commuters, 11.3%).
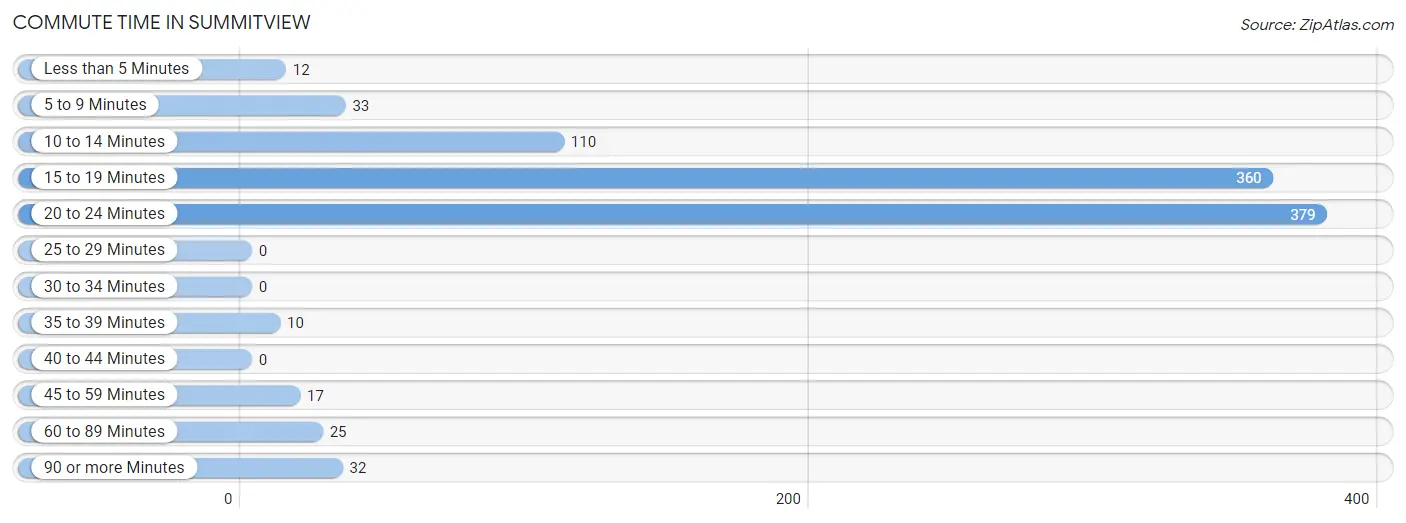
| Commute Time | # Commuters | % Commuters |
| Less than 5 Minutes | 12 | 1.2% |
| 5 to 9 Minutes | 33 | 3.4% |
| 10 to 14 Minutes | 110 | 11.3% |
| 15 to 19 Minutes | 360 | 36.8% |
| 20 to 24 Minutes | 379 | 38.8% |
| 25 to 29 Minutes | 0 | 0.0% |
| 30 to 34 Minutes | 0 | 0.0% |
| 35 to 39 Minutes | 10 | 1.0% |
| 40 to 44 Minutes | 0 | 0.0% |
| 45 to 59 Minutes | 17 | 1.7% |
| 60 to 89 Minutes | 25 | 2.6% |
| 90 or more Minutes | 32 | 3.3% |
Commute Time by Sex in Summitview
The most common commute times in Summitview are 15 to 19 minutes (199 commuters, 39.3%) for males and 20 to 24 minutes (207 commuters, 44.0%) for females.
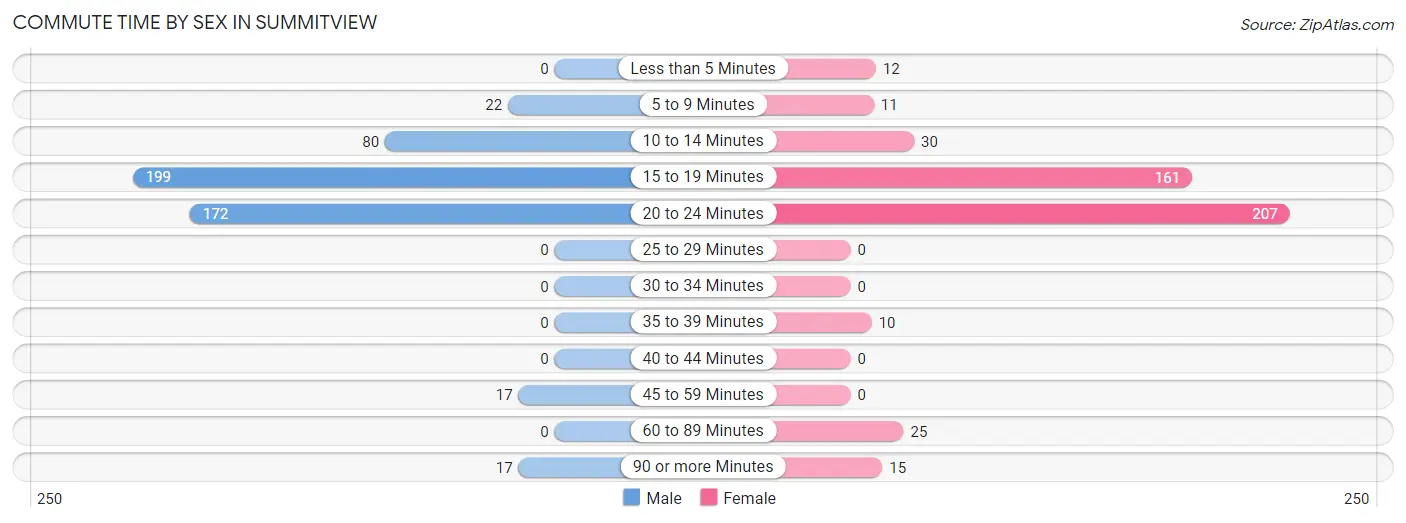
| Commute Time | Male | Female |
| Less than 5 Minutes | 0 (0.0%) | 12 (2.5%) |
| 5 to 9 Minutes | 22 (4.3%) | 11 (2.3%) |
| 10 to 14 Minutes | 80 (15.8%) | 30 (6.4%) |
| 15 to 19 Minutes | 199 (39.3%) | 161 (34.2%) |
| 20 to 24 Minutes | 172 (33.9%) | 207 (44.0%) |
| 25 to 29 Minutes | 0 (0.0%) | 0 (0.0%) |
| 30 to 34 Minutes | 0 (0.0%) | 0 (0.0%) |
| 35 to 39 Minutes | 0 (0.0%) | 10 (2.1%) |
| 40 to 44 Minutes | 0 (0.0%) | 0 (0.0%) |
| 45 to 59 Minutes | 17 (3.4%) | 0 (0.0%) |
| 60 to 89 Minutes | 0 (0.0%) | 25 (5.3%) |
| 90 or more Minutes | 17 (3.4%) | 15 (3.2%) |
Time of Departure to Work by Sex in Summitview
The most frequent times of departure to work in Summitview are 7:00 AM to 7:29 AM (105, 20.7%) for males and 7:00 AM to 7:29 AM (201, 42.7%) for females.
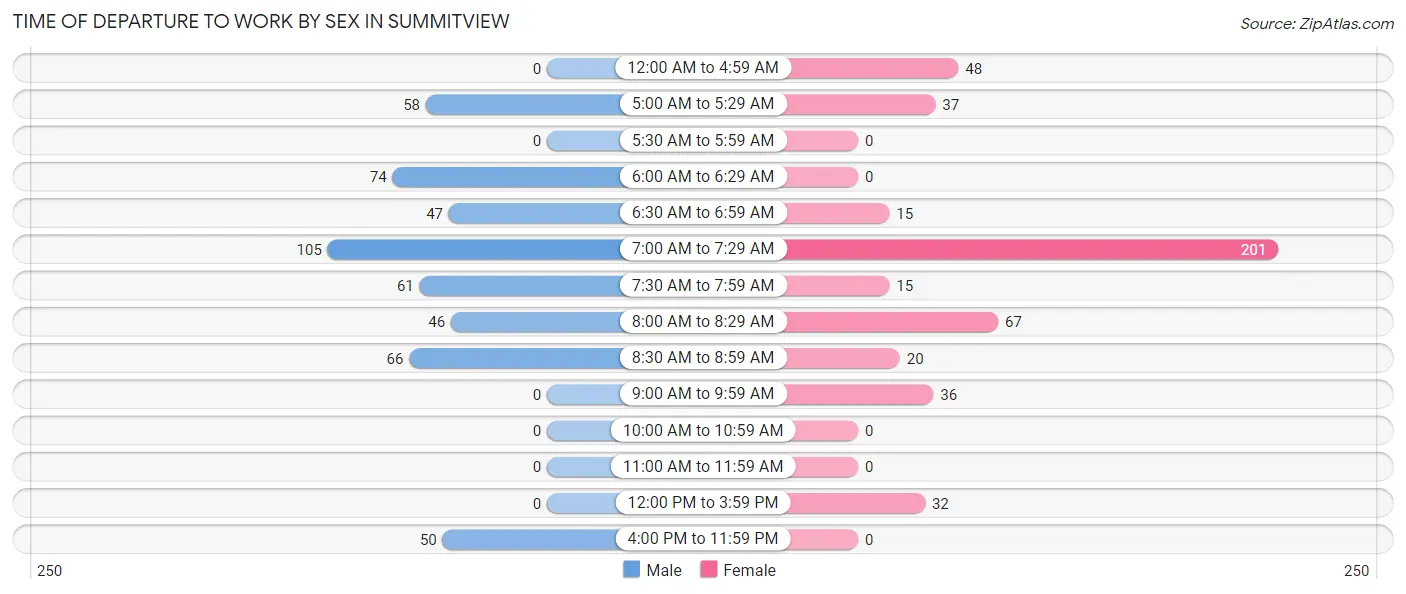
| Time of Departure | Male | Female |
| 12:00 AM to 4:59 AM | 0 (0.0%) | 48 (10.2%) |
| 5:00 AM to 5:29 AM | 58 (11.4%) | 37 (7.9%) |
| 5:30 AM to 5:59 AM | 0 (0.0%) | 0 (0.0%) |
| 6:00 AM to 6:29 AM | 74 (14.6%) | 0 (0.0%) |
| 6:30 AM to 6:59 AM | 47 (9.3%) | 15 (3.2%) |
| 7:00 AM to 7:29 AM | 105 (20.7%) | 201 (42.7%) |
| 7:30 AM to 7:59 AM | 61 (12.0%) | 15 (3.2%) |
| 8:00 AM to 8:29 AM | 46 (9.1%) | 67 (14.2%) |
| 8:30 AM to 8:59 AM | 66 (13.0%) | 20 (4.3%) |
| 9:00 AM to 9:59 AM | 0 (0.0%) | 36 (7.6%) |
| 10:00 AM to 10:59 AM | 0 (0.0%) | 0 (0.0%) |
| 11:00 AM to 11:59 AM | 0 (0.0%) | 0 (0.0%) |
| 12:00 PM to 3:59 PM | 0 (0.0%) | 32 (6.8%) |
| 4:00 PM to 11:59 PM | 50 (9.9%) | 0 (0.0%) |
| Total | 507 (100.0%) | 471 (100.0%) |
Housing Occupancy in Summitview
Occupancy by Ownership in Summitview
Of the total 725 dwellings in Summitview, owner-occupied units account for 653 (90.1%), while renter-occupied units make up 72 (9.9%).
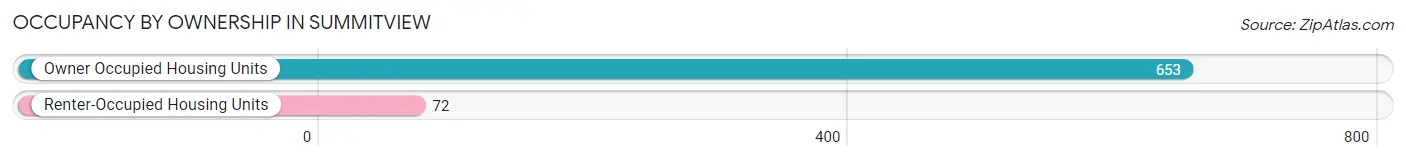
| Occupancy | # Housing Units | % Housing Units |
| Owner Occupied Housing Units | 653 | 90.1% |
| Renter-Occupied Housing Units | 72 | 9.9% |
| Total Occupied Housing Units | 725 | 100.0% |
Occupancy by Household Size in Summitview
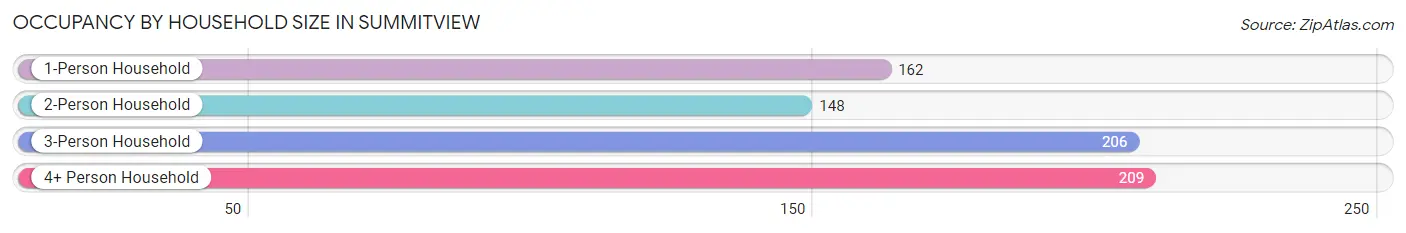
| Household Size | # Housing Units | % Housing Units |
| 1-Person Household | 162 | 22.3% |
| 2-Person Household | 148 | 20.4% |
| 3-Person Household | 206 | 28.4% |
| 4+ Person Household | 209 | 28.8% |
| Total Housing Units | 725 | 100.0% |
Occupancy by Ownership by Household Size in Summitview
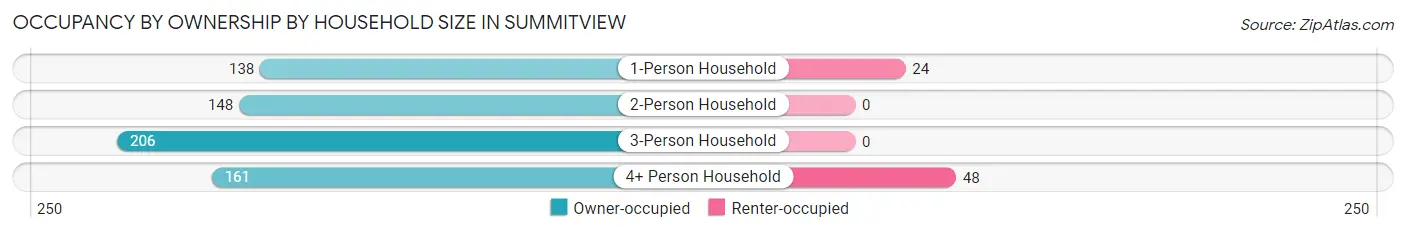
| Household Size | Owner-occupied | Renter-occupied |
| 1-Person Household | 138 (85.2%) | 24 (14.8%) |
| 2-Person Household | 148 (100.0%) | 0 (0.0%) |
| 3-Person Household | 206 (100.0%) | 0 (0.0%) |
| 4+ Person Household | 161 (77.0%) | 48 (23.0%) |
| Total Housing Units | 653 (90.1%) | 72 (9.9%) |
Occupancy by Educational Attainment in Summitview
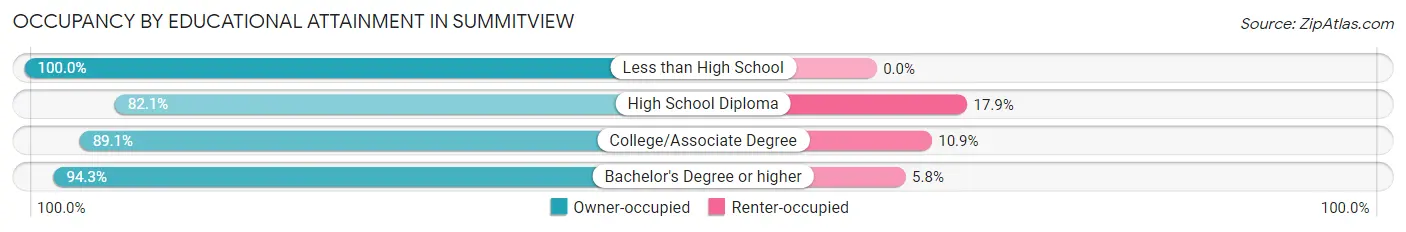
| Household Size | Owner-occupied | Renter-occupied |
| Less than High School | 28 (100.0%) | 0 (0.0%) |
| High School Diploma | 110 (82.1%) | 24 (17.9%) |
| College/Associate Degree | 269 (89.1%) | 33 (10.9%) |
| Bachelor's Degree or higher | 246 (94.3%) | 15 (5.8%) |
Occupancy by Age of Householder in Summitview
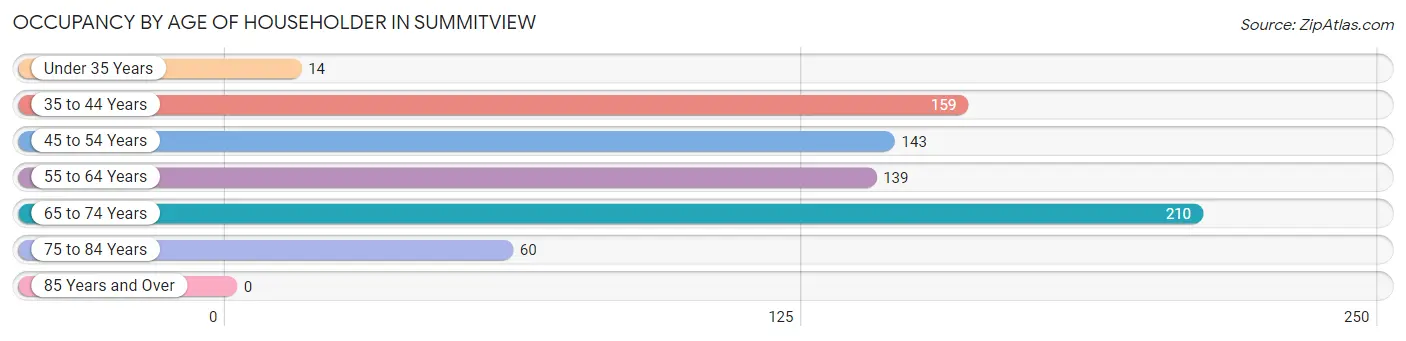
| Age Bracket | # Households | % Households |
| Under 35 Years | 14 | 1.9% |
| 35 to 44 Years | 159 | 21.9% |
| 45 to 54 Years | 143 | 19.7% |
| 55 to 64 Years | 139 | 19.2% |
| 65 to 74 Years | 210 | 29.0% |
| 75 to 84 Years | 60 | 8.3% |
| 85 Years and Over | 0 | 0.0% |
| Total | 725 | 100.0% |
Housing Finances in Summitview
Median Income by Occupancy in Summitview
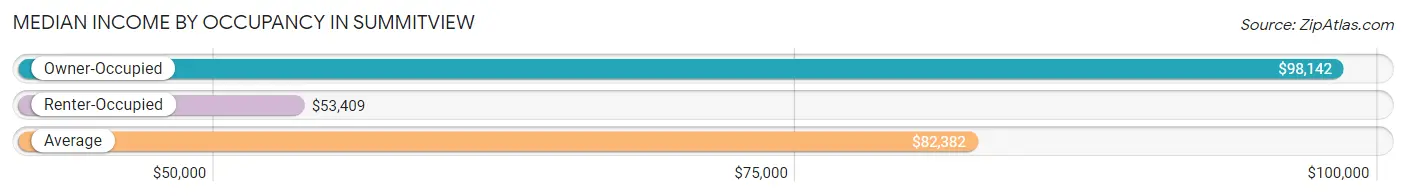
| Occupancy Type | # Households | Median Income |
| Owner-Occupied | 653 (90.1%) | $98,142 |
| Renter-Occupied | 72 (9.9%) | $53,409 |
| Average | 725 (100.0%) | $82,382 |
Occupancy by Householder Income Bracket in Summitview
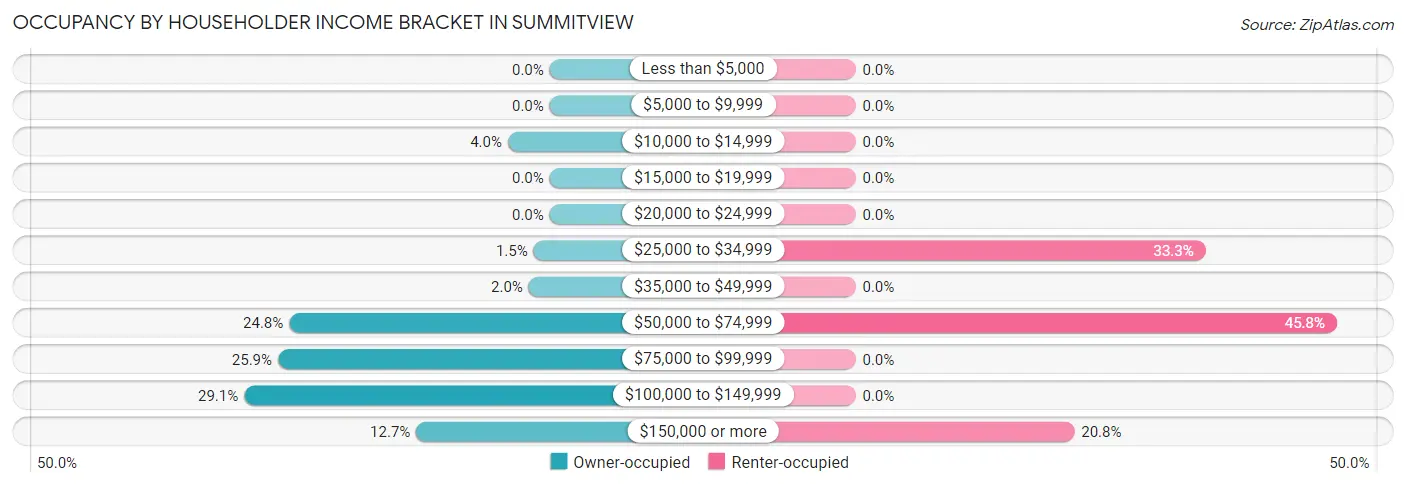
| Income Bracket | Owner-occupied | Renter-occupied |
| Less than $5,000 | 0 (0.0%) | 0 (0.0%) |
| $5,000 to $9,999 | 0 (0.0%) | 0 (0.0%) |
| $10,000 to $14,999 | 26 (4.0%) | 0 (0.0%) |
| $15,000 to $19,999 | 0 (0.0%) | 0 (0.0%) |
| $20,000 to $24,999 | 0 (0.0%) | 0 (0.0%) |
| $25,000 to $34,999 | 10 (1.5%) | 24 (33.3%) |
| $35,000 to $49,999 | 13 (2.0%) | 0 (0.0%) |
| $50,000 to $74,999 | 162 (24.8%) | 33 (45.8%) |
| $75,000 to $99,999 | 169 (25.9%) | 0 (0.0%) |
| $100,000 to $149,999 | 190 (29.1%) | 0 (0.0%) |
| $150,000 or more | 83 (12.7%) | 15 (20.8%) |
| Total | 653 (100.0%) | 72 (100.0%) |
Monthly Housing Cost Tiers in Summitview
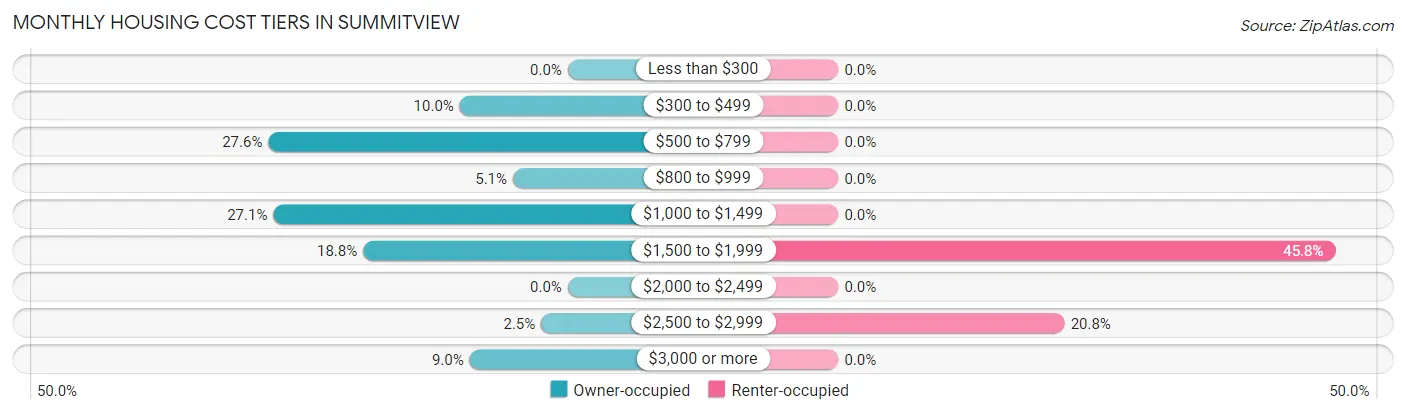
| Monthly Cost | Owner-occupied | Renter-occupied |
| Less than $300 | 0 (0.0%) | 0 (0.0%) |
| $300 to $499 | 65 (10.0%) | 0 (0.0%) |
| $500 to $799 | 180 (27.6%) | 0 (0.0%) |
| $800 to $999 | 33 (5.1%) | 0 (0.0%) |
| $1,000 to $1,499 | 177 (27.1%) | 0 (0.0%) |
| $1,500 to $1,999 | 123 (18.8%) | 33 (45.8%) |
| $2,000 to $2,499 | 0 (0.0%) | 0 (0.0%) |
| $2,500 to $2,999 | 16 (2.5%) | 15 (20.8%) |
| $3,000 or more | 59 (9.0%) | 0 (0.0%) |
| Total | 653 (100.0%) | 72 (100.0%) |
Physical Housing Characteristics in Summitview
Housing Structures in Summitview
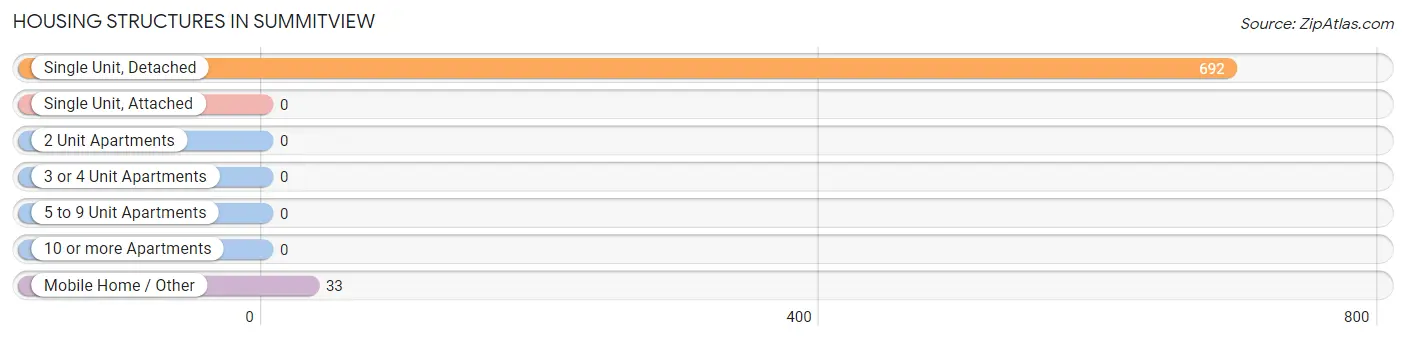
| Structure Type | # Housing Units | % Housing Units |
| Single Unit, Detached | 692 | 95.5% |
| Single Unit, Attached | 0 | 0.0% |
| 2 Unit Apartments | 0 | 0.0% |
| 3 or 4 Unit Apartments | 0 | 0.0% |
| 5 to 9 Unit Apartments | 0 | 0.0% |
| 10 or more Apartments | 0 | 0.0% |
| Mobile Home / Other | 33 | 4.5% |
| Total | 725 | 100.0% |
Housing Structures by Occupancy in Summitview
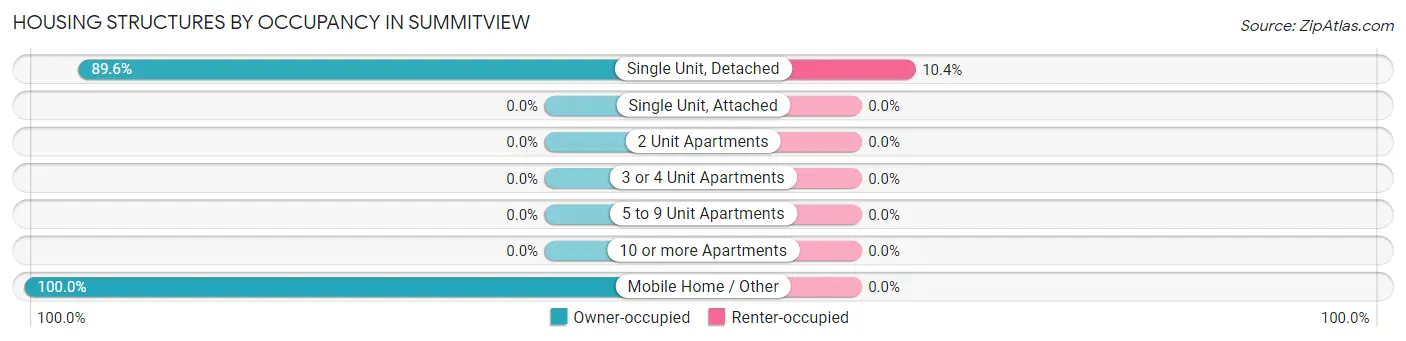
| Structure Type | Owner-occupied | Renter-occupied |
| Single Unit, Detached | 620 (89.6%) | 72 (10.4%) |
| Single Unit, Attached | 0 (0.0%) | 0 (0.0%) |
| 2 Unit Apartments | 0 (0.0%) | 0 (0.0%) |
| 3 or 4 Unit Apartments | 0 (0.0%) | 0 (0.0%) |
| 5 to 9 Unit Apartments | 0 (0.0%) | 0 (0.0%) |
| 10 or more Apartments | 0 (0.0%) | 0 (0.0%) |
| Mobile Home / Other | 33 (100.0%) | 0 (0.0%) |
| Total | 653 (90.1%) | 72 (9.9%) |
Housing Structures by Number of Rooms in Summitview
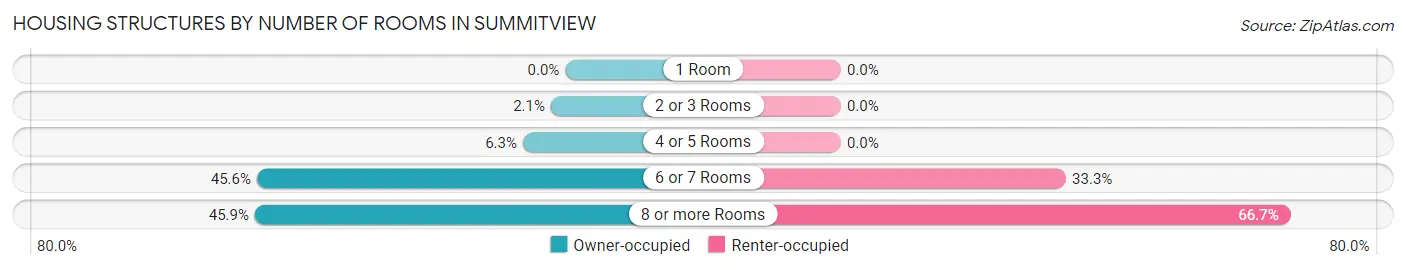
| Number of Rooms | Owner-occupied | Renter-occupied |
| 1 Room | 0 (0.0%) | 0 (0.0%) |
| 2 or 3 Rooms | 14 (2.1%) | 0 (0.0%) |
| 4 or 5 Rooms | 41 (6.3%) | 0 (0.0%) |
| 6 or 7 Rooms | 298 (45.6%) | 24 (33.3%) |
| 8 or more Rooms | 300 (45.9%) | 48 (66.7%) |
| Total | 653 (100.0%) | 72 (100.0%) |
Housing Structure by Heating Type in Summitview
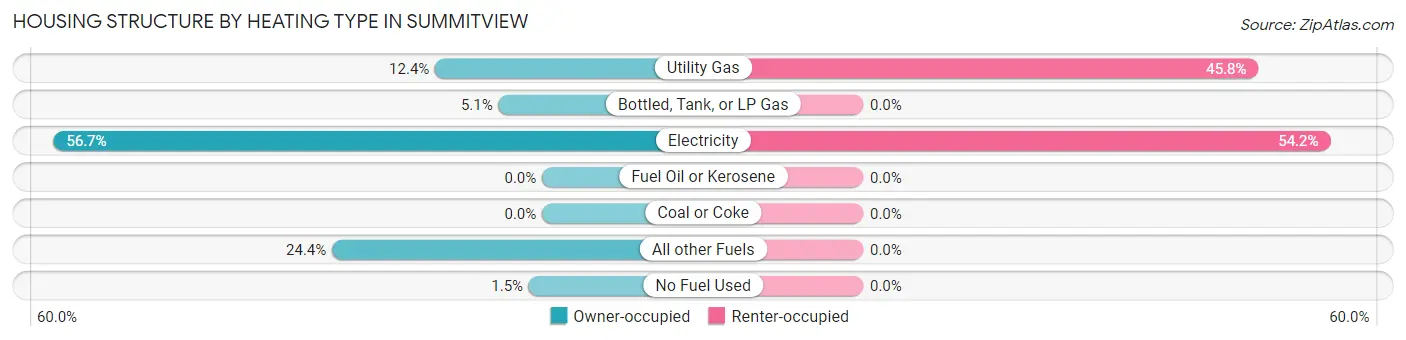
| Heating Type | Owner-occupied | Renter-occupied |
| Utility Gas | 81 (12.4%) | 33 (45.8%) |
| Bottled, Tank, or LP Gas | 33 (5.1%) | 0 (0.0%) |
| Electricity | 370 (56.7%) | 39 (54.2%) |
| Fuel Oil or Kerosene | 0 (0.0%) | 0 (0.0%) |
| Coal or Coke | 0 (0.0%) | 0 (0.0%) |
| All other Fuels | 159 (24.3%) | 0 (0.0%) |
| No Fuel Used | 10 (1.5%) | 0 (0.0%) |
| Total | 653 (100.0%) | 72 (100.0%) |
Household Vehicle Usage in Summitview
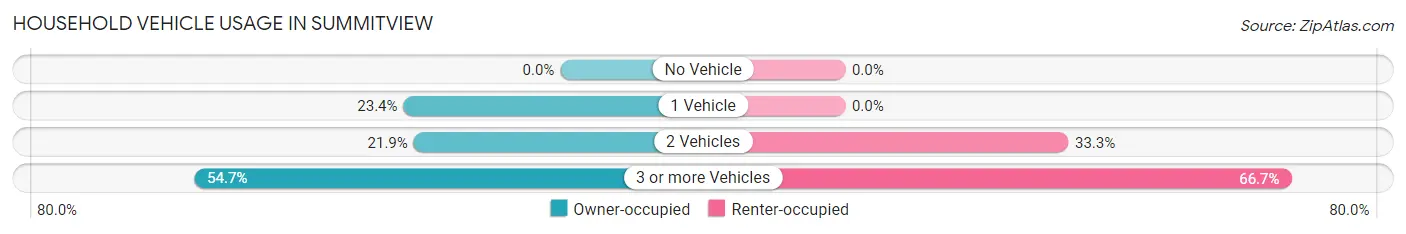
| Vehicles per Household | Owner-occupied | Renter-occupied |
| No Vehicle | 0 (0.0%) | 0 (0.0%) |
| 1 Vehicle | 153 (23.4%) | 0 (0.0%) |
| 2 Vehicles | 143 (21.9%) | 24 (33.3%) |
| 3 or more Vehicles | 357 (54.7%) | 48 (66.7%) |
| Total | 653 (100.0%) | 72 (100.0%) |
Real Estate & Mortgages in Summitview
Real Estate and Mortgage Overview in Summitview
| Characteristic | Without Mortgage | With Mortgage |
| Housing Units | 298 | 355 |
| Median Property Value | $409,500 | $317,300 |
| Median Household Income | $96,250 | $26 |
| Monthly Housing Costs | $568 | $59 |
| Real Estate Taxes | $3,540 | $0 |
Property Value by Mortgage Status in Summitview
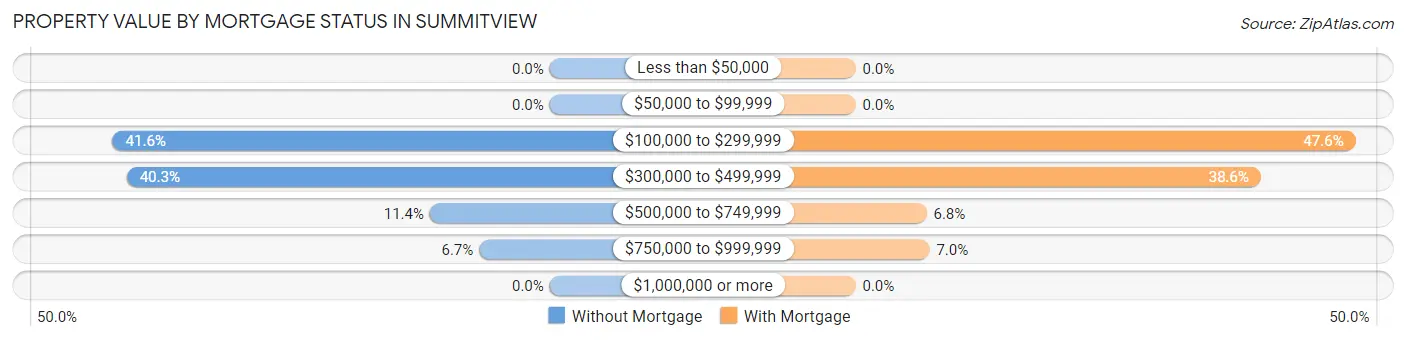
| Property Value | Without Mortgage | With Mortgage |
| Less than $50,000 | 0 (0.0%) | 0 (0.0%) |
| $50,000 to $99,999 | 0 (0.0%) | 0 (0.0%) |
| $100,000 to $299,999 | 124 (41.6%) | 169 (47.6%) |
| $300,000 to $499,999 | 120 (40.3%) | 137 (38.6%) |
| $500,000 to $749,999 | 34 (11.4%) | 24 (6.8%) |
| $750,000 to $999,999 | 20 (6.7%) | 25 (7.0%) |
| $1,000,000 or more | 0 (0.0%) | 0 (0.0%) |
| Total | 298 (100.0%) | 355 (100.0%) |
Household Income by Mortgage Status in Summitview
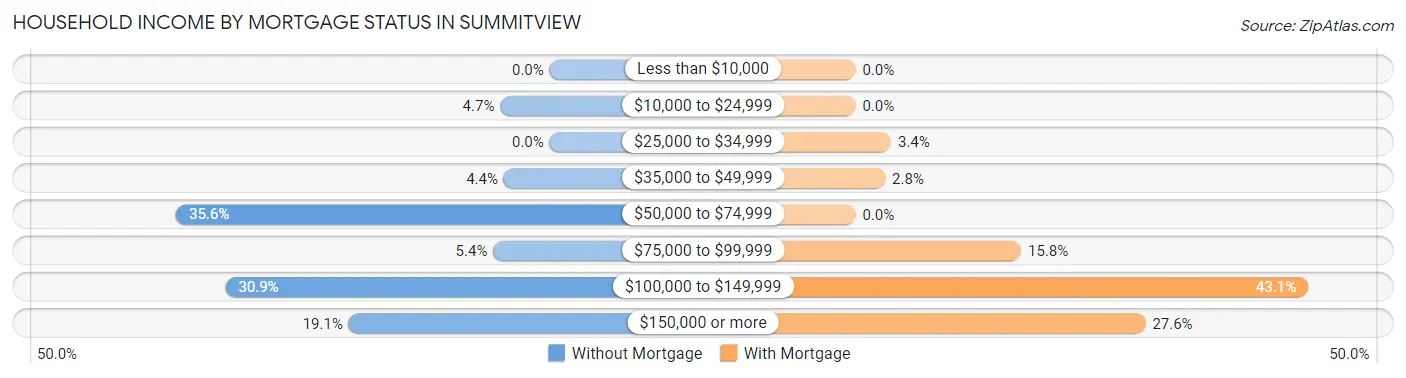
| Household Income | Without Mortgage | With Mortgage |
| Less than $10,000 | 0 (0.0%) | 0 (0.0%) |
| $10,000 to $24,999 | 14 (4.7%) | 0 (0.0%) |
| $25,000 to $34,999 | 0 (0.0%) | 12 (3.4%) |
| $35,000 to $49,999 | 13 (4.4%) | 10 (2.8%) |
| $50,000 to $74,999 | 106 (35.6%) | 0 (0.0%) |
| $75,000 to $99,999 | 16 (5.4%) | 56 (15.8%) |
| $100,000 to $149,999 | 92 (30.9%) | 153 (43.1%) |
| $150,000 or more | 57 (19.1%) | 98 (27.6%) |
| Total | 298 (100.0%) | 355 (100.0%) |
Property Value to Household Income Ratio in Summitview
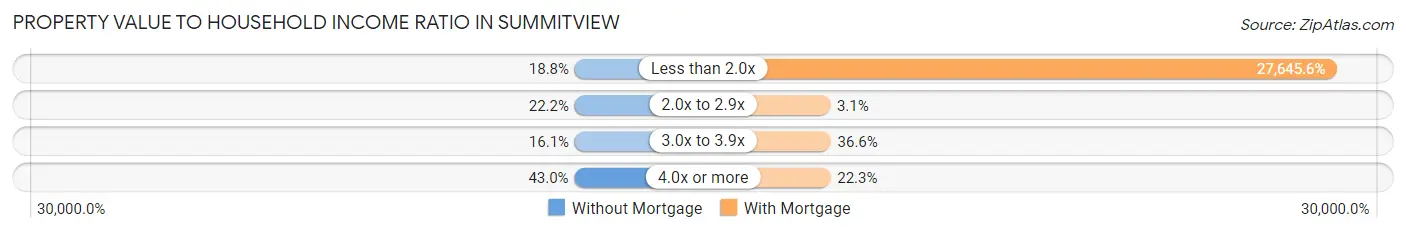
| Value-to-Income Ratio | Without Mortgage | With Mortgage |
| Less than 2.0x | 56 (18.8%) | 98,142 (27,645.6%) |
| 2.0x to 2.9x | 66 (22.2%) | 11 (3.1%) |
| 3.0x to 3.9x | 48 (16.1%) | 130 (36.6%) |
| 4.0x or more | 128 (42.9%) | 79 (22.3%) |
| Total | 298 (100.0%) | 355 (100.0%) |
Real Estate Taxes by Mortgage Status in Summitview
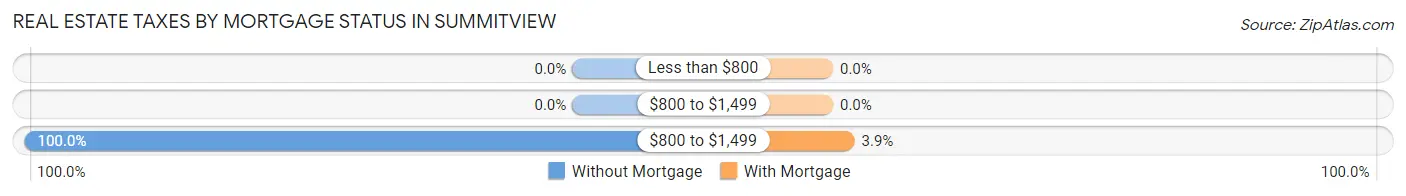
| Property Taxes | Without Mortgage | With Mortgage |
| Less than $800 | 0 (0.0%) | 0 (0.0%) |
| $800 to $1,499 | 0 (0.0%) | 0 (0.0%) |
| $800 to $1,499 | 298 (100.0%) | 14 (3.9%) |
| Total | 298 (100.0%) | 355 (100.0%) |
Health & Disability in Summitview
Health Insurance Coverage by Age in Summitview
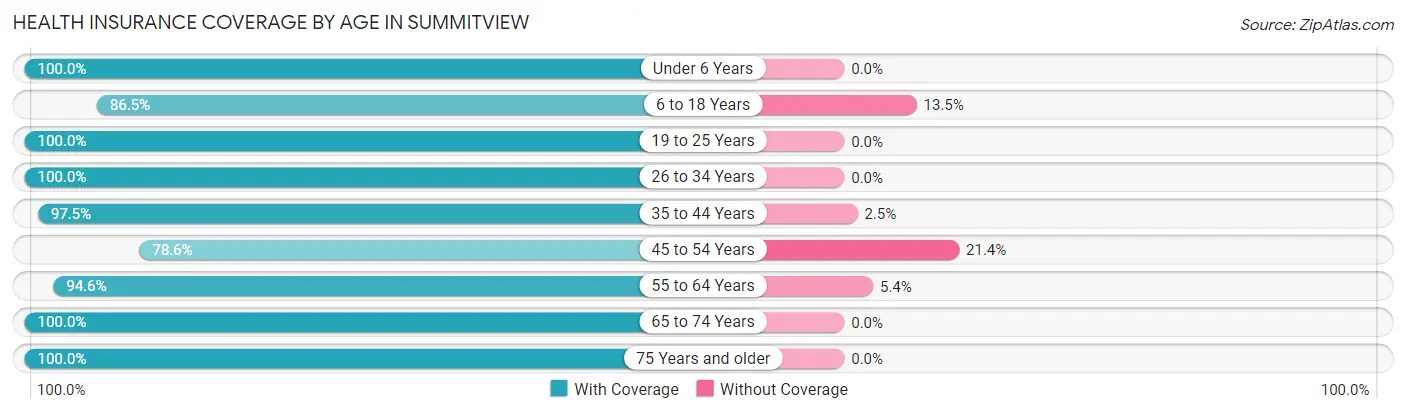
| Age Bracket | With Coverage | Without Coverage |
| Under 6 Years | 26 (100.0%) | 0 (0.0%) |
| 6 to 18 Years | 385 (86.5%) | 60 (13.5%) |
| 19 to 25 Years | 186 (100.0%) | 0 (0.0%) |
| 26 to 34 Years | 122 (100.0%) | 0 (0.0%) |
| 35 to 44 Years | 278 (97.5%) | 7 (2.5%) |
| 45 to 54 Years | 268 (78.6%) | 73 (21.4%) |
| 55 to 64 Years | 212 (94.6%) | 12 (5.4%) |
| 65 to 74 Years | 313 (100.0%) | 0 (0.0%) |
| 75 Years and older | 117 (100.0%) | 0 (0.0%) |
| Total | 1,907 (92.6%) | 152 (7.4%) |
Health Insurance Coverage by Citizenship Status in Summitview
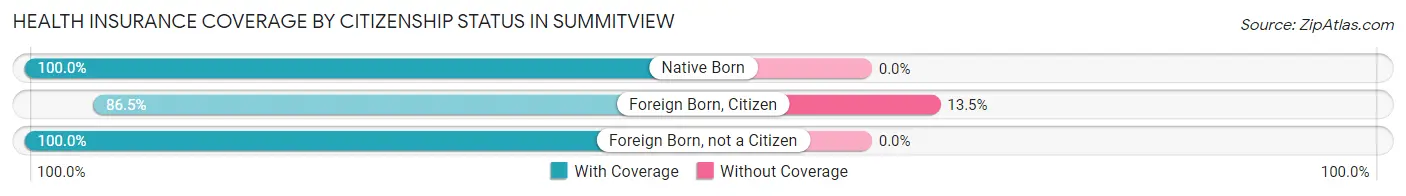
| Citizenship Status | With Coverage | Without Coverage |
| Native Born | 26 (100.0%) | 0 (0.0%) |
| Foreign Born, Citizen | 385 (86.5%) | 60 (13.5%) |
| Foreign Born, not a Citizen | 186 (100.0%) | 0 (0.0%) |
Health Insurance Coverage by Household Income in Summitview
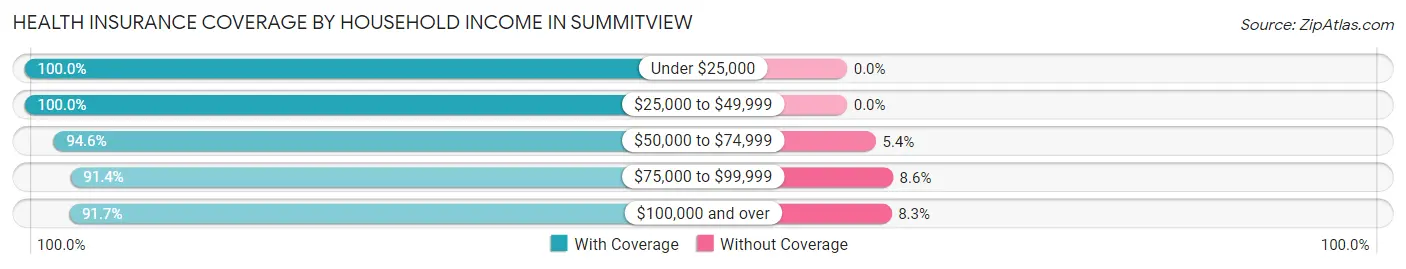
| Household Income | With Coverage | Without Coverage |
| Under $25,000 | 26 (100.0%) | 0 (0.0%) |
| $25,000 to $49,999 | 59 (100.0%) | 0 (0.0%) |
| $50,000 to $74,999 | 440 (94.6%) | 25 (5.4%) |
| $75,000 to $99,999 | 511 (91.4%) | 48 (8.6%) |
| $100,000 and over | 871 (91.7%) | 79 (8.3%) |
Public vs Private Health Insurance Coverage by Age in Summitview
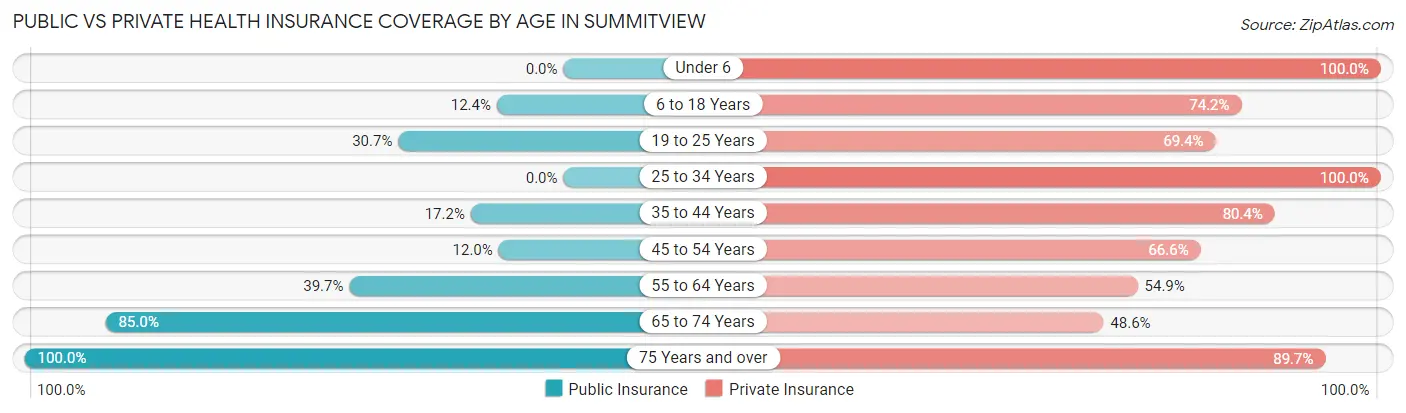
| Age Bracket | Public Insurance | Private Insurance |
| Under 6 | 0 (0.0%) | 26 (100.0%) |
| 6 to 18 Years | 55 (12.4%) | 330 (74.2%) |
| 19 to 25 Years | 57 (30.6%) | 129 (69.4%) |
| 25 to 34 Years | 0 (0.0%) | 122 (100.0%) |
| 35 to 44 Years | 49 (17.2%) | 229 (80.3%) |
| 45 to 54 Years | 41 (12.0%) | 227 (66.6%) |
| 55 to 64 Years | 89 (39.7%) | 123 (54.9%) |
| 65 to 74 Years | 266 (85.0%) | 152 (48.6%) |
| 75 Years and over | 117 (100.0%) | 105 (89.7%) |
| Total | 674 (32.7%) | 1,443 (70.1%) |
Disability Status by Sex by Age in Summitview
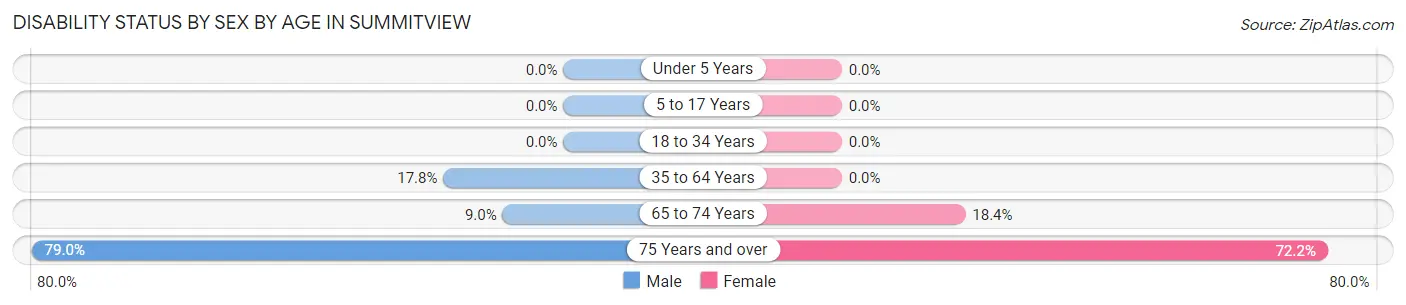
| Age Bracket | Male | Female |
| Under 5 Years | 0 (0.0%) | 0 (0.0%) |
| 5 to 17 Years | 0 (0.0%) | 0 (0.0%) |
| 18 to 34 Years | 0 (0.0%) | 0 (0.0%) |
| 35 to 64 Years | 82 (17.8%) | 0 (0.0%) |
| 65 to 74 Years | 14 (9.0%) | 29 (18.3%) |
| 75 Years and over | 30 (78.9%) | 57 (72.2%) |
Disability Class by Sex by Age in Summitview
Disability Class: Hearing Difficulty
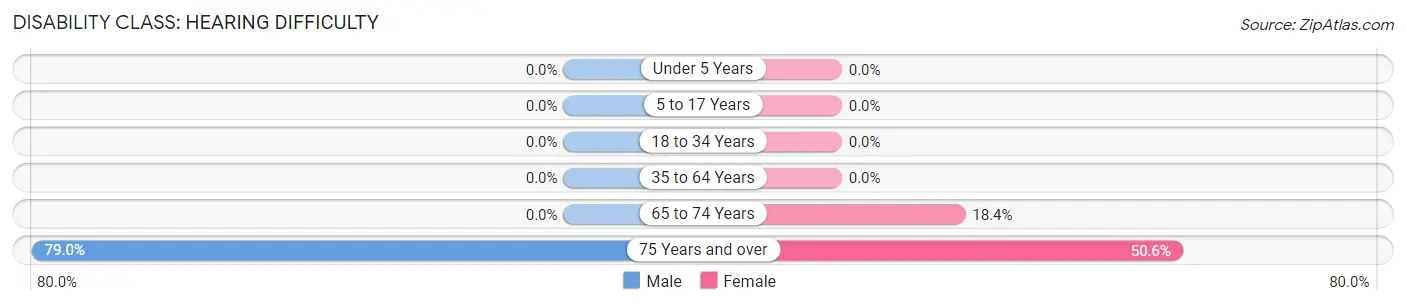
| Age Bracket | Male | Female |
| Under 5 Years | 0 (0.0%) | 0 (0.0%) |
| 5 to 17 Years | 0 (0.0%) | 0 (0.0%) |
| 18 to 34 Years | 0 (0.0%) | 0 (0.0%) |
| 35 to 64 Years | 0 (0.0%) | 0 (0.0%) |
| 65 to 74 Years | 0 (0.0%) | 29 (18.3%) |
| 75 Years and over | 30 (78.9%) | 40 (50.6%) |
Disability Class: Vision Difficulty
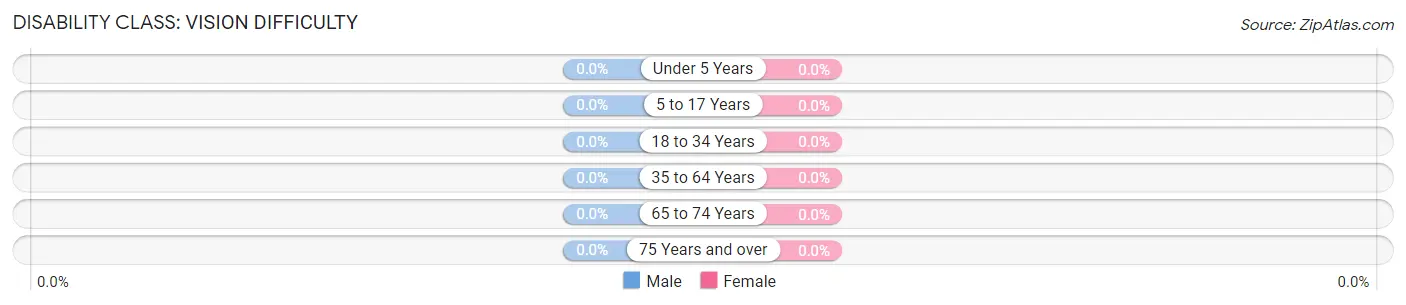
| Age Bracket | Male | Female |
| Under 5 Years | 0 (0.0%) | 0 (0.0%) |
| 5 to 17 Years | 0 (0.0%) | 0 (0.0%) |
| 18 to 34 Years | 0 (0.0%) | 0 (0.0%) |
| 35 to 64 Years | 0 (0.0%) | 0 (0.0%) |
| 65 to 74 Years | 0 (0.0%) | 0 (0.0%) |
| 75 Years and over | 0 (0.0%) | 0 (0.0%) |
Disability Class: Cognitive Difficulty
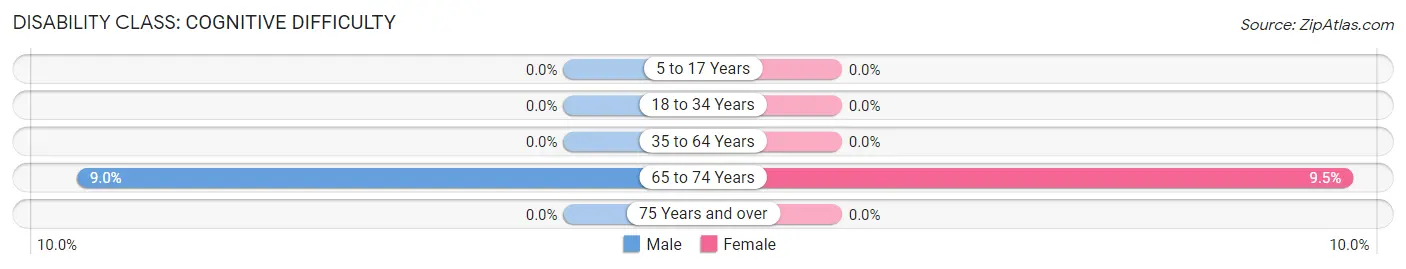
| Age Bracket | Male | Female |
| 5 to 17 Years | 0 (0.0%) | 0 (0.0%) |
| 18 to 34 Years | 0 (0.0%) | 0 (0.0%) |
| 35 to 64 Years | 0 (0.0%) | 0 (0.0%) |
| 65 to 74 Years | 14 (9.0%) | 15 (9.5%) |
| 75 Years and over | 0 (0.0%) | 0 (0.0%) |
Disability Class: Ambulatory Difficulty
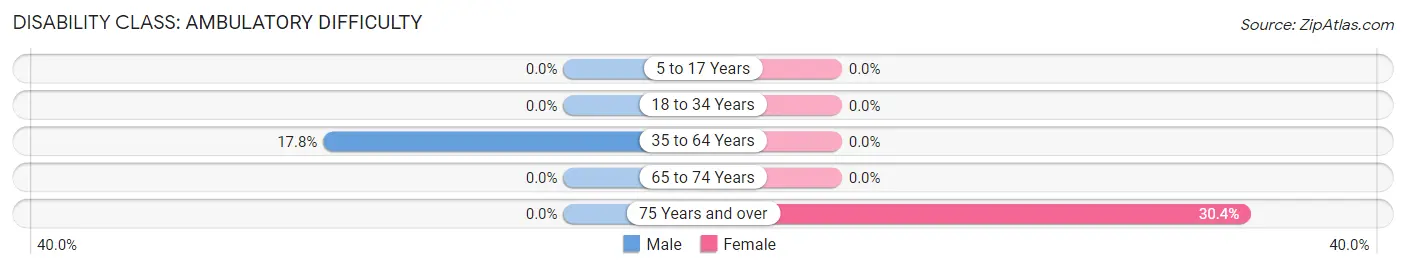
| Age Bracket | Male | Female |
| 5 to 17 Years | 0 (0.0%) | 0 (0.0%) |
| 18 to 34 Years | 0 (0.0%) | 0 (0.0%) |
| 35 to 64 Years | 82 (17.8%) | 0 (0.0%) |
| 65 to 74 Years | 0 (0.0%) | 0 (0.0%) |
| 75 Years and over | 0 (0.0%) | 24 (30.4%) |
Disability Class: Self-Care Difficulty
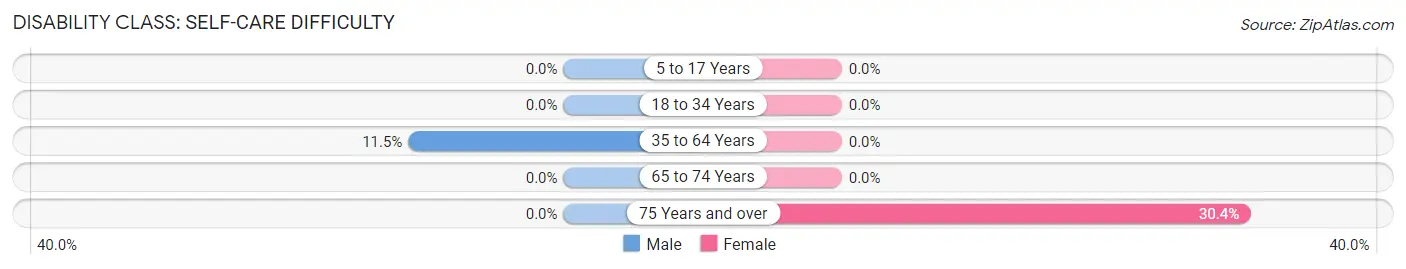
| Age Bracket | Male | Female |
| 5 to 17 Years | 0 (0.0%) | 0 (0.0%) |
| 18 to 34 Years | 0 (0.0%) | 0 (0.0%) |
| 35 to 64 Years | 53 (11.5%) | 0 (0.0%) |
| 65 to 74 Years | 0 (0.0%) | 0 (0.0%) |
| 75 Years and over | 0 (0.0%) | 24 (30.4%) |
Technology Access in Summitview
Computing Device Access in Summitview
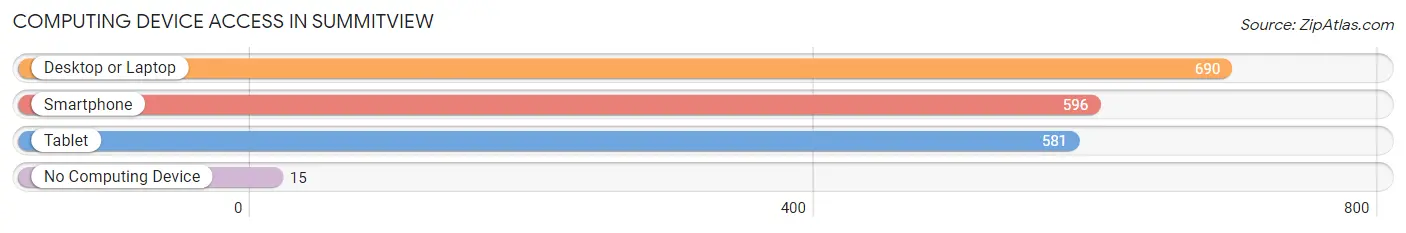
| Device Type | # Households | % Households |
| Desktop or Laptop | 690 | 95.2% |
| Smartphone | 596 | 82.2% |
| Tablet | 581 | 80.1% |
| No Computing Device | 15 | 2.1% |
| Total | 725 | 100.0% |
Internet Access in Summitview
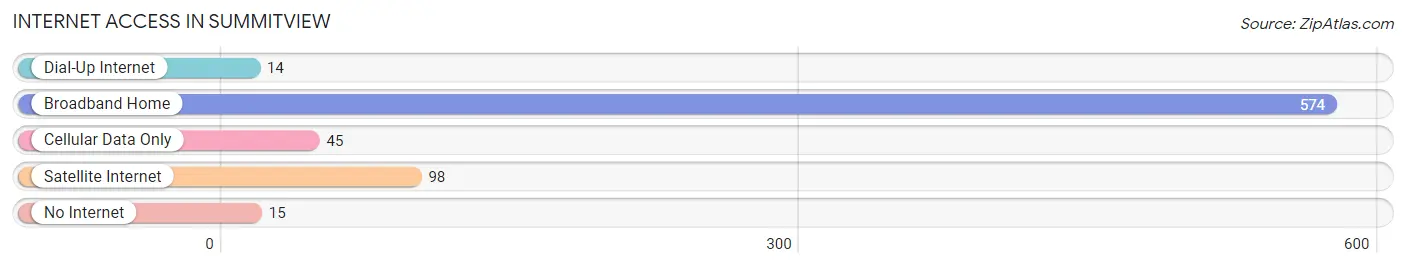
| Internet Type | # Households | % Households |
| Dial-Up Internet | 14 | 1.9% |
| Broadband Home | 574 | 79.2% |
| Cellular Data Only | 45 | 6.2% |
| Satellite Internet | 98 | 13.5% |
| No Internet | 15 | 2.1% |
| Total | 725 | 100.0% |
Summitview Summary
Summitview is a small city located in the state of Washington, United States. It is situated in the Yakima Valley, which is located in the south-central part of the state. The city is located in Yakima County and is part of the Yakima Metropolitan Statistical Area. As of the 2010 census, the population of Summitview was 8,845.
Geography
Summitview is located at 46°37'25"N 120°31'45"W (46.623, -120.529). It is situated in the Yakima Valley, which is located in the south-central part of the state. The city is located in Yakima County and is part of the Yakima Metropolitan Statistical Area. The city is situated at an elevation of 1,845 feet (562 m) above sea level.
The city is located in a semi-arid climate zone, with hot summers and cold winters. The average annual precipitation is 8.5 inches (216 mm). The average high temperature in July is 91°F (33°C), and the average low temperature in January is 24°F (-4°C).
History
The area that is now Summitview was first settled in the late 1800s by homesteaders. The city was officially incorporated in 1909. The city was named after the nearby summit of the Cascade Mountains.
In the early 1900s, the city was a major center for the production of hops, which were used in the brewing of beer. The city was also home to several sawmills and lumber mills.
In the 1950s, the city began to experience a population boom as people moved to the area to take advantage of the booming agricultural industry. The city also experienced a surge in population due to the construction of the nearby Yakima Training Center, which was used by the United States Army during the Cold War.
Economy
The economy of Summitview is largely based on agriculture. The city is home to several large farms that produce a variety of crops, including apples, cherries, hops, and wheat. The city is also home to several food processing plants, which process the crops grown in the area.
The city is also home to several manufacturing companies, which produce a variety of products, including furniture, clothing, and electronics. The city is also home to several retail stores, which sell a variety of goods.
Demographics
As of the 2010 census, the population of Summitview was 8,845. The racial makeup of the city was 79.3% White, 0.7% African American, 0.7% Native American, 0.7% Asian, 0.2% Pacific Islander, 16.2% from other races, and 2.2% from two or more races. Hispanic or Latino of any race were 28.3% of the population.
The median household income in Summitview was $41,944, and the median family income was $50,944. The per capita income for the city was $20,845. About 16.2% of families and 20.3% of the population were below the poverty line, including 28.3% of those under age 18 and 8.2% of those age 65 or over.
Common Questions
What is Per Capita Income in Summitview?
Per Capita income in Summitview is $38,916.
What is the Median Family Income in Summitview?
Median Family Income in Summitview is $82,311.
What is the Median Household income in Summitview?
Median Household Income in Summitview is $82,382.
What is Inequality or Gini Index in Summitview?
Inequality or Gini Index in Summitview is 0.37.
What is the Total Population of Summitview?
Total Population of Summitview is 2,059.
What is the Total Male Population of Summitview?
Total Male Population of Summitview is 1,019.
What is the Total Female Population of Summitview?
Total Female Population of Summitview is 1,040.
What is the Ratio of Males per 100 Females in Summitview?
There are 97.98 Males per 100 Females in Summitview.
What is the Ratio of Females per 100 Males in Summitview?
There are 102.06 Females per 100 Males in Summitview.
What is the Median Population Age in Summitview?
Median Population Age in Summitview is 42.0 Years.
What is the Average Family Size in Summitview
Average Family Size in Summitview is 3.4 People.
What is the Average Household Size in Summitview
Average Household Size in Summitview is 2.8 People.
How Large is the Labor Force in Summitview?
There are 1,105 People in the Labor Forcein in Summitview.
What is the Percentage of People in the Labor Force in Summitview?
63.9% of People are in the Labor Force in Summitview.
What is the Unemployment Rate in Summitview?
Unemployment Rate in Summitview is 1.3%.