Cities with the Most Immigrants from Japan in Washington
RELATED REPORTS & OPTIONS
Japan
Washington
Compare Cities
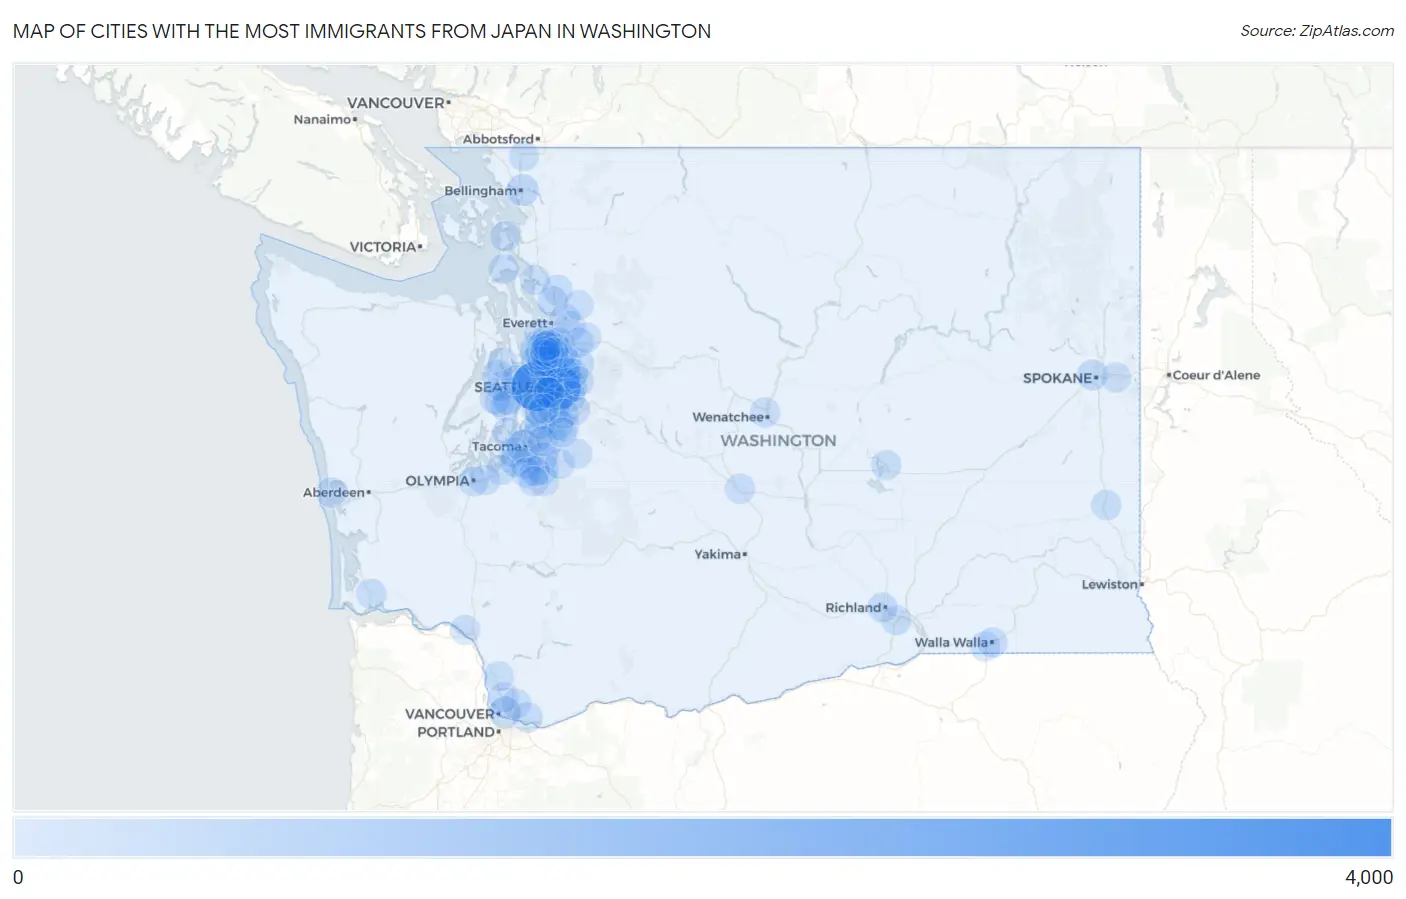
Map of Cities with the Most Immigrants from Japan in Washington
0
4,000
Cities with the Most Immigrants from Japan in Washington
| City | Japan | vs State | vs National | |
| 1. | Seattle | 3,164 | 17,453(18.13%)#1 | 342,380(0.92%)#9 |
| 2. | Bellevue | 2,174 | 17,453(12.46%)#2 | 342,380(0.63%)#13 |
| 3. | Redmond | 649 | 17,453(3.72%)#3 | 342,380(0.19%)#62 |
| 4. | Kirkland | 566 | 17,453(3.24%)#4 | 342,380(0.17%)#74 |
| 5. | Tacoma | 501 | 17,453(2.87%)#5 | 342,380(0.15%)#91 |
| 6. | Vancouver | 301 | 17,453(1.72%)#6 | 342,380(0.09%)#158 |
| 7. | Sammamish | 300 | 17,453(1.72%)#7 | 342,380(0.09%)#163 |
| 8. | Renton | 268 | 17,453(1.54%)#8 | 342,380(0.08%)#197 |
| 9. | Bellingham | 267 | 17,453(1.53%)#9 | 342,380(0.08%)#200 |
| 10. | South Hill | 257 | 17,453(1.47%)#10 | 342,380(0.08%)#211 |
| 11. | Lakewood | 245 | 17,453(1.40%)#11 | 342,380(0.07%)#222 |
| 12. | Bothell | 235 | 17,453(1.35%)#12 | 342,380(0.07%)#229 |
| 13. | Woodinville | 227 | 17,453(1.30%)#13 | 342,380(0.07%)#241 |
| 14. | Kent | 210 | 17,453(1.20%)#14 | 342,380(0.06%)#261 |
| 15. | Federal Way | 204 | 17,453(1.17%)#15 | 342,380(0.06%)#269 |
| 16. | Seatac | 183 | 17,453(1.05%)#16 | 342,380(0.05%)#301 |
| 17. | Lynnwood | 174 | 17,453(1.00%)#17 | 342,380(0.05%)#318 |
| 18. | Shoreline | 166 | 17,453(0.95%)#18 | 342,380(0.05%)#338 |
| 19. | Issaquah | 157 | 17,453(0.90%)#19 | 342,380(0.05%)#358 |
| 20. | Duvall | 151 | 17,453(0.87%)#20 | 342,380(0.04%)#369 |
| 21. | Silverdale | 149 | 17,453(0.85%)#21 | 342,380(0.04%)#376 |
| 22. | Mill Creek | 147 | 17,453(0.84%)#22 | 342,380(0.04%)#379 |
| 23. | Spokane | 145 | 17,453(0.83%)#23 | 342,380(0.04%)#382 |
| 24. | Edmonds | 139 | 17,453(0.80%)#24 | 342,380(0.04%)#399 |
| 25. | Union Hill Novelty Hill | 128 | 17,453(0.73%)#25 | 342,380(0.04%)#434 |
| 26. | Port Orchard | 125 | 17,453(0.72%)#26 | 342,380(0.04%)#441 |
| 27. | Everett | 122 | 17,453(0.70%)#27 | 342,380(0.04%)#447 |
| 28. | Auburn | 122 | 17,453(0.70%)#28 | 342,380(0.04%)#448 |
| 29. | Bremerton | 114 | 17,453(0.65%)#29 | 342,380(0.03%)#474 |
| 30. | Newcastle | 110 | 17,453(0.63%)#30 | 342,380(0.03%)#496 |
| 31. | Burien | 108 | 17,453(0.62%)#31 | 342,380(0.03%)#504 |
| 32. | Camas | 104 | 17,453(0.60%)#32 | 342,380(0.03%)#525 |
| 33. | Mukilteo | 103 | 17,453(0.59%)#33 | 342,380(0.03%)#531 |
| 34. | Arlington | 103 | 17,453(0.59%)#34 | 342,380(0.03%)#532 |
| 35. | Marysville | 101 | 17,453(0.58%)#35 | 342,380(0.03%)#537 |
| 36. | Mill Creek East | 100 | 17,453(0.57%)#36 | 342,380(0.03%)#544 |
| 37. | North Lynnwood | 100 | 17,453(0.57%)#37 | 342,380(0.03%)#545 |
| 38. | Tracyton | 100 | 17,453(0.57%)#38 | 342,380(0.03%)#547 |
| 39. | Kenmore | 99 | 17,453(0.57%)#39 | 342,380(0.03%)#551 |
| 40. | Parkland | 98 | 17,453(0.56%)#40 | 342,380(0.03%)#555 |
| 41. | Des Moines | 95 | 17,453(0.54%)#41 | 342,380(0.03%)#566 |
| 42. | Mountlake Terrace | 92 | 17,453(0.53%)#42 | 342,380(0.03%)#583 |
| 43. | Mercer Island | 91 | 17,453(0.52%)#43 | 342,380(0.03%)#588 |
| 44. | Covington | 84 | 17,453(0.48%)#44 | 342,380(0.02%)#633 |
| 45. | Cottage Lake | 80 | 17,453(0.46%)#45 | 342,380(0.02%)#650 |
| 46. | Bothell West | 75 | 17,453(0.43%)#46 | 342,380(0.02%)#689 |
| 47. | Puyallup | 73 | 17,453(0.42%)#47 | 342,380(0.02%)#696 |
| 48. | Lake Stickney | 68 | 17,453(0.39%)#48 | 342,380(0.02%)#737 |
| 49. | Mirrormont | 66 | 17,453(0.38%)#49 | 342,380(0.02%)#760 |
| 50. | Oak Harbor | 64 | 17,453(0.37%)#50 | 342,380(0.02%)#777 |
| 51. | Lacey | 60 | 17,453(0.34%)#51 | 342,380(0.02%)#808 |
| 52. | Lake Forest Park | 59 | 17,453(0.34%)#52 | 342,380(0.02%)#824 |
| 53. | Olympia | 58 | 17,453(0.33%)#53 | 342,380(0.02%)#831 |
| 54. | Maltby | 58 | 17,453(0.33%)#54 | 342,380(0.02%)#839 |
| 55. | Mount Vista | 58 | 17,453(0.33%)#55 | 342,380(0.02%)#840 |
| 56. | Colfax | 56 | 17,453(0.32%)#56 | 342,380(0.02%)#878 |
| 57. | Silver Firs | 54 | 17,453(0.31%)#57 | 342,380(0.02%)#895 |
| 58. | Brier | 54 | 17,453(0.31%)#58 | 342,380(0.02%)#901 |
| 59. | Martha Lake | 53 | 17,453(0.30%)#59 | 342,380(0.02%)#910 |
| 60. | University Place | 52 | 17,453(0.30%)#60 | 342,380(0.02%)#918 |
| 61. | Wenatchee | 50 | 17,453(0.29%)#61 | 342,380(0.01%)#945 |
| 62. | Ocean Shores | 43 | 17,453(0.25%)#62 | 342,380(0.01%)#1,066 |
| 63. | Graham | 42 | 17,453(0.24%)#63 | 342,380(0.01%)#1,071 |
| 64. | Moses Lake | 42 | 17,453(0.24%)#64 | 342,380(0.01%)#1,072 |
| 65. | Kennewick | 41 | 17,453(0.23%)#65 | 342,380(0.01%)#1,083 |
| 66. | Alderwood Manor | 41 | 17,453(0.23%)#66 | 342,380(0.01%)#1,099 |
| 67. | Poulsbo | 37 | 17,453(0.21%)#67 | 342,380(0.01%)#1,183 |
| 68. | Richland | 36 | 17,453(0.21%)#68 | 342,380(0.01%)#1,192 |
| 69. | La Center | 36 | 17,453(0.21%)#69 | 342,380(0.01%)#1,203 |
| 70. | Anacortes | 35 | 17,453(0.20%)#70 | 342,380(0.01%)#1,214 |
| 71. | College Place | 35 | 17,453(0.20%)#71 | 342,380(0.01%)#1,217 |
| 72. | Maple Heights Lake Desire | 35 | 17,453(0.20%)#72 | 342,380(0.01%)#1,221 |
| 73. | Lynden | 34 | 17,453(0.19%)#73 | 342,380(0.01%)#1,235 |
| 74. | Bethel | 33 | 17,453(0.19%)#74 | 342,380(0.01%)#1,273 |
| 75. | Lake Stevens | 32 | 17,453(0.18%)#75 | 342,380(0.01%)#1,280 |
| 76. | Longview | 32 | 17,453(0.18%)#76 | 342,380(0.01%)#1,281 |
| 77. | Spanaway | 32 | 17,453(0.18%)#77 | 342,380(0.01%)#1,285 |
| 78. | Walla Walla | 32 | 17,453(0.18%)#78 | 342,380(0.01%)#1,286 |
| 79. | Ellensburg | 32 | 17,453(0.18%)#79 | 342,380(0.01%)#1,293 |
| 80. | Lakeland South | 32 | 17,453(0.18%)#80 | 342,380(0.01%)#1,296 |
| 81. | Gig Harbor | 32 | 17,453(0.18%)#81 | 342,380(0.01%)#1,297 |
| 82. | Parkwood | 30 | 17,453(0.17%)#82 | 342,380(0.01%)#1,366 |
| 83. | Larch Way | 30 | 17,453(0.17%)#83 | 342,380(0.01%)#1,372 |
| 84. | Naselle | 29 | 17,453(0.17%)#84 | 342,380(0.01%)#1,412 |
| 85. | Frederickson | 28 | 17,453(0.16%)#85 | 342,380(0.01%)#1,428 |
| 86. | Dupont | 28 | 17,453(0.16%)#86 | 342,380(0.01%)#1,434 |
| 87. | Monroe | 27 | 17,453(0.15%)#87 | 342,380(0.01%)#1,450 |
| 88. | Elk Plain | 27 | 17,453(0.15%)#88 | 342,380(0.01%)#1,454 |
| 89. | Prairie Ridge | 27 | 17,453(0.15%)#89 | 342,380(0.01%)#1,457 |
| 90. | Ames Lake | 27 | 17,453(0.15%)#90 | 342,380(0.01%)#1,470 |
| 91. | Enumclaw | 26 | 17,453(0.15%)#91 | 342,380(0.01%)#1,491 |
| 92. | Granite Falls | 26 | 17,453(0.15%)#92 | 342,380(0.01%)#1,499 |
| 93. | Bainbridge Island | 25 | 17,453(0.14%)#93 | 342,380(0.01%)#1,523 |
| 94. | Lake Morton Berrydale | 25 | 17,453(0.14%)#94 | 342,380(0.01%)#1,540 |
| 95. | Orchards | 23 | 17,453(0.13%)#95 | 342,380(0.01%)#1,600 |
| 96. | Woods Creek | 23 | 17,453(0.13%)#96 | 342,380(0.01%)#1,623 |
| 97. | Spokane Valley | 22 | 17,453(0.13%)#97 | 342,380(0.01%)#1,631 |
| 98. | Stanwood | 22 | 17,453(0.13%)#98 | 342,380(0.01%)#1,668 |
| 99. | Tukwila | 21 | 17,453(0.12%)#99 | 342,380(0.01%)#1,693 |
| 100. | Bothell East | 21 | 17,453(0.12%)#100 | 342,380(0.01%)#1,707 |
Common Questions
What are the Top 10 Cities with the Most Immigrants from Japan in Washington?
Top 10 Cities with the Most Immigrants from Japan in Washington are:
#1
3,164
#2
2,174
#3
649
#4
566
#5
501
#6
301
#7
300
#8
268
#9
267
#10
257
What city has the Most Immigrants from Japan in Washington?
Seattle has the Most Immigrants from Japan in Washington with 3,164.
What is the Total Immigrants from Japan in the State of Washington?
Total Immigrants from Japan in Washington is 17,453.
What is the Total Immigrants from Japan in the United States?
Total Immigrants from Japan in the United States is 342,380.