Cities with the Largest Eastern European Community in Washington
RELATED REPORTS & OPTIONS
Eastern European
Washington
Compare Cities
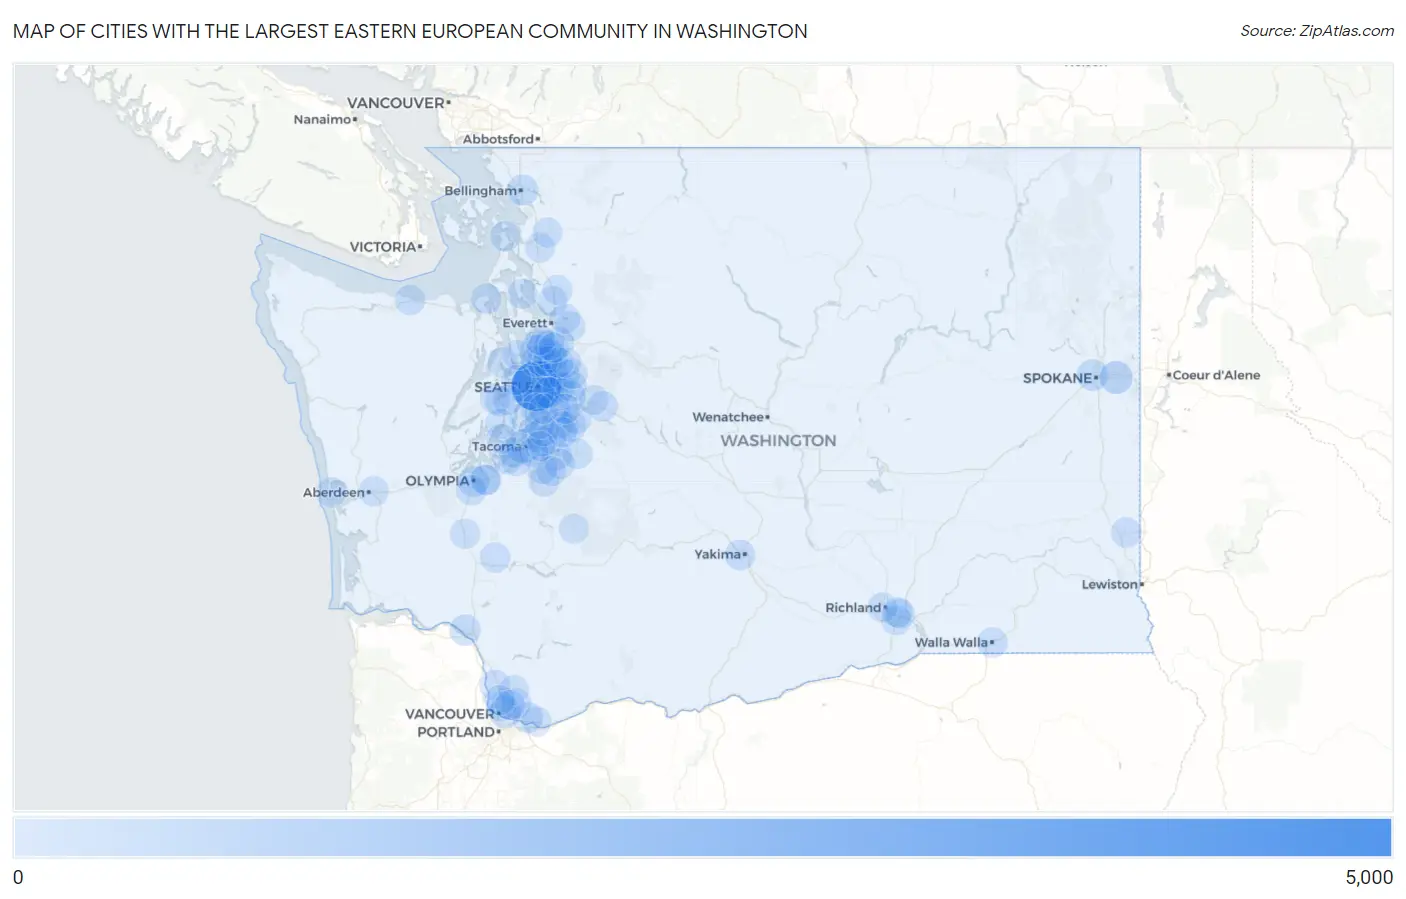
Map of Cities with the Largest Eastern European Community in Washington
0
5,000
Cities with the Largest Eastern European Community in Washington
| City | Eastern European | vs State | vs National | |
| 1. | Seattle | 4,662 | 21,487(21.70%)#1 | 1,005,654(0.46%)#9 |
| 2. | Tacoma | 967 | 21,487(4.50%)#2 | 1,005,654(0.10%)#87 |
| 3. | Spokane Valley | 634 | 21,487(2.95%)#3 | 1,005,654(0.06%)#164 |
| 4. | Kirkland | 629 | 21,487(2.93%)#4 | 1,005,654(0.06%)#165 |
| 5. | Renton | 455 | 21,487(2.12%)#5 | 1,005,654(0.05%)#240 |
| 6. | Bellevue | 443 | 21,487(2.06%)#6 | 1,005,654(0.04%)#246 |
| 7. | Vancouver | 398 | 21,487(1.85%)#7 | 1,005,654(0.04%)#281 |
| 8. | Redmond | 374 | 21,487(1.74%)#8 | 1,005,654(0.04%)#304 |
| 9. | Spokane | 370 | 21,487(1.72%)#9 | 1,005,654(0.04%)#307 |
| 10. | Olympia | 297 | 21,487(1.38%)#10 | 1,005,654(0.03%)#418 |
| 11. | Issaquah | 276 | 21,487(1.28%)#11 | 1,005,654(0.03%)#460 |
| 12. | Longview | 253 | 21,487(1.18%)#12 | 1,005,654(0.03%)#515 |
| 13. | Shoreline | 236 | 21,487(1.10%)#13 | 1,005,654(0.02%)#555 |
| 14. | Bellingham | 225 | 21,487(1.05%)#14 | 1,005,654(0.02%)#595 |
| 15. | Mercer Island | 214 | 21,487(1.00%)#15 | 1,005,654(0.02%)#644 |
| 16. | Burien | 207 | 21,487(0.96%)#16 | 1,005,654(0.02%)#662 |
| 17. | Camas | 200 | 21,487(0.93%)#17 | 1,005,654(0.02%)#695 |
| 18. | Sammamish | 198 | 21,487(0.92%)#18 | 1,005,654(0.02%)#706 |
| 19. | Bonney Lake | 197 | 21,487(0.92%)#19 | 1,005,654(0.02%)#715 |
| 20. | Lacey | 183 | 21,487(0.85%)#20 | 1,005,654(0.02%)#778 |
| 21. | Lake Forest Park | 173 | 21,487(0.81%)#21 | 1,005,654(0.02%)#826 |
| 22. | Federal Way | 172 | 21,487(0.80%)#22 | 1,005,654(0.02%)#828 |
| 23. | Bothell West | 170 | 21,487(0.79%)#23 | 1,005,654(0.02%)#845 |
| 24. | Kent | 165 | 21,487(0.77%)#24 | 1,005,654(0.02%)#874 |
| 25. | Yakima | 158 | 21,487(0.74%)#25 | 1,005,654(0.02%)#916 |
| 26. | Graham | 148 | 21,487(0.69%)#26 | 1,005,654(0.01%)#977 |
| 27. | Silver Firs | 148 | 21,487(0.69%)#27 | 1,005,654(0.01%)#979 |
| 28. | Edmonds | 140 | 21,487(0.65%)#28 | 1,005,654(0.01%)#1,042 |
| 29. | Maple Valley | 128 | 21,487(0.60%)#29 | 1,005,654(0.01%)#1,156 |
| 30. | North Bend | 125 | 21,487(0.58%)#30 | 1,005,654(0.01%)#1,178 |
| 31. | Bremerton | 124 | 21,487(0.58%)#31 | 1,005,654(0.01%)#1,188 |
| 32. | Orchards | 122 | 21,487(0.57%)#32 | 1,005,654(0.01%)#1,205 |
| 33. | Covington | 116 | 21,487(0.54%)#33 | 1,005,654(0.01%)#1,255 |
| 34. | Steilacoom | 107 | 21,487(0.50%)#34 | 1,005,654(0.01%)#1,362 |
| 35. | Walla Walla | 100 | 21,487(0.47%)#35 | 1,005,654(0.01%)#1,434 |
| 36. | Onalaska | 100 | 21,487(0.47%)#36 | 1,005,654(0.01%)#1,445 |
| 37. | Everett | 99 | 21,487(0.46%)#37 | 1,005,654(0.01%)#1,447 |
| 38. | Bothell | 98 | 21,487(0.46%)#38 | 1,005,654(0.01%)#1,461 |
| 39. | Ridgefield | 97 | 21,487(0.45%)#39 | 1,005,654(0.01%)#1,480 |
| 40. | Union Hill Novelty Hill | 95 | 21,487(0.44%)#40 | 1,005,654(0.01%)#1,495 |
| 41. | Port Angeles | 93 | 21,487(0.43%)#41 | 1,005,654(0.01%)#1,531 |
| 42. | Enumclaw | 91 | 21,487(0.42%)#42 | 1,005,654(0.01%)#1,565 |
| 43. | Auburn | 90 | 21,487(0.42%)#43 | 1,005,654(0.01%)#1,571 |
| 44. | Prairie Ridge | 90 | 21,487(0.42%)#44 | 1,005,654(0.01%)#1,577 |
| 45. | Pullman | 87 | 21,487(0.40%)#45 | 1,005,654(0.01%)#1,621 |
| 46. | Port Townsend | 87 | 21,487(0.40%)#46 | 1,005,654(0.01%)#1,629 |
| 47. | Hobart | 87 | 21,487(0.40%)#47 | 1,005,654(0.01%)#1,632 |
| 48. | Fairwood Cdp Spokane County | 83 | 21,487(0.39%)#48 | 1,005,654(0.01%)#1,683 |
| 49. | South Hill | 82 | 21,487(0.38%)#49 | 1,005,654(0.01%)#1,688 |
| 50. | Poulsbo | 82 | 21,487(0.38%)#50 | 1,005,654(0.01%)#1,698 |
| 51. | Marysville | 79 | 21,487(0.37%)#51 | 1,005,654(0.01%)#1,744 |
| 52. | Kennewick | 70 | 21,487(0.33%)#52 | 1,005,654(0.01%)#1,932 |
| 53. | Tumwater | 69 | 21,487(0.32%)#53 | 1,005,654(0.01%)#1,960 |
| 54. | North Lynnwood | 68 | 21,487(0.32%)#54 | 1,005,654(0.01%)#1,988 |
| 55. | Lakeland South | 68 | 21,487(0.32%)#55 | 1,005,654(0.01%)#1,995 |
| 56. | Vashon | 67 | 21,487(0.31%)#56 | 1,005,654(0.01%)#2,021 |
| 57. | Aberdeen | 65 | 21,487(0.30%)#57 | 1,005,654(0.01%)#2,060 |
| 58. | Lake Stevens | 62 | 21,487(0.29%)#58 | 1,005,654(0.01%)#2,130 |
| 59. | Kenmore | 62 | 21,487(0.29%)#59 | 1,005,654(0.01%)#2,133 |
| 60. | Battle Ground | 60 | 21,487(0.28%)#60 | 1,005,654(0.01%)#2,193 |
| 61. | Bainbridge Island | 59 | 21,487(0.27%)#61 | 1,005,654(0.01%)#2,216 |
| 62. | Camano | 59 | 21,487(0.27%)#62 | 1,005,654(0.01%)#2,222 |
| 63. | Washougal | 57 | 21,487(0.27%)#63 | 1,005,654(0.01%)#2,284 |
| 64. | Ocean Shores | 57 | 21,487(0.27%)#64 | 1,005,654(0.01%)#2,293 |
| 65. | Waller | 55 | 21,487(0.26%)#65 | 1,005,654(0.01%)#2,356 |
| 66. | Port Orchard | 54 | 21,487(0.25%)#66 | 1,005,654(0.01%)#2,377 |
| 67. | University Place | 53 | 21,487(0.25%)#67 | 1,005,654(0.01%)#2,401 |
| 68. | Anacortes | 53 | 21,487(0.25%)#68 | 1,005,654(0.01%)#2,406 |
| 69. | Mount Vernon | 50 | 21,487(0.23%)#69 | 1,005,654(0.00%)#2,496 |
| 70. | Cottage Lake | 50 | 21,487(0.23%)#70 | 1,005,654(0.00%)#2,506 |
| 71. | Lakeland North | 50 | 21,487(0.23%)#71 | 1,005,654(0.00%)#2,515 |
| 72. | Tukwila | 48 | 21,487(0.22%)#72 | 1,005,654(0.00%)#2,590 |
| 73. | Orting | 47 | 21,487(0.22%)#73 | 1,005,654(0.00%)#2,636 |
| 74. | Des Moines | 46 | 21,487(0.21%)#74 | 1,005,654(0.00%)#2,659 |
| 75. | Parkwood | 46 | 21,487(0.21%)#75 | 1,005,654(0.00%)#2,678 |
| 76. | Lake Morton Berrydale | 45 | 21,487(0.21%)#76 | 1,005,654(0.00%)#2,706 |
| 77. | Hazel Dell | 44 | 21,487(0.20%)#77 | 1,005,654(0.00%)#2,732 |
| 78. | Lakewood | 43 | 21,487(0.20%)#78 | 1,005,654(0.00%)#2,767 |
| 79. | Salmon Creek | 43 | 21,487(0.20%)#79 | 1,005,654(0.00%)#2,779 |
| 80. | Wauna | 43 | 21,487(0.20%)#80 | 1,005,654(0.00%)#2,804 |
| 81. | Woodinville | 42 | 21,487(0.20%)#81 | 1,005,654(0.00%)#2,837 |
| 82. | Kingston | 42 | 21,487(0.20%)#82 | 1,005,654(0.00%)#2,860 |
| 83. | Ashford | 42 | 21,487(0.20%)#83 | 1,005,654(0.00%)#2,866 |
| 84. | Five Corners | 41 | 21,487(0.19%)#84 | 1,005,654(0.00%)#2,880 |
| 85. | Centralia | 41 | 21,487(0.19%)#85 | 1,005,654(0.00%)#2,882 |
| 86. | Pasco | 40 | 21,487(0.19%)#86 | 1,005,654(0.00%)#2,915 |
| 87. | East Renton Highlands | 40 | 21,487(0.19%)#87 | 1,005,654(0.00%)#2,943 |
| 88. | Lynnwood | 39 | 21,487(0.18%)#88 | 1,005,654(0.00%)#2,982 |
| 89. | Artondale | 39 | 21,487(0.18%)#89 | 1,005,654(0.00%)#2,996 |
| 90. | Richland | 37 | 21,487(0.17%)#90 | 1,005,654(0.00%)#3,093 |
| 91. | Martha Lake | 37 | 21,487(0.17%)#91 | 1,005,654(0.00%)#3,096 |
| 92. | West Pasco | 37 | 21,487(0.17%)#92 | 1,005,654(0.00%)#3,142 |
| 93. | Picnic Point | 36 | 21,487(0.17%)#93 | 1,005,654(0.00%)#3,177 |
| 94. | Tanglewilde | 36 | 21,487(0.17%)#94 | 1,005,654(0.00%)#3,182 |
| 95. | Mill Creek East | 35 | 21,487(0.16%)#95 | 1,005,654(0.00%)#3,212 |
| 96. | Milton | 33 | 21,487(0.15%)#96 | 1,005,654(0.00%)#3,319 |
| 97. | Snoqualmie | 32 | 21,487(0.15%)#97 | 1,005,654(0.00%)#3,366 |
| 98. | Sedro Woolley | 31 | 21,487(0.14%)#98 | 1,005,654(0.00%)#3,420 |
| 99. | Clear Lake Cdp Pierce County | 31 | 21,487(0.14%)#99 | 1,005,654(0.00%)#3,467 |
| 100. | Arlington | 30 | 21,487(0.14%)#100 | 1,005,654(0.00%)#3,487 |
Common Questions
What are the Top 10 Cities with the Largest Eastern European Community in Washington?
Top 10 Cities with the Largest Eastern European Community in Washington are:
What city has the Largest Eastern European Community in Washington?
Seattle has the Largest Eastern European Community in Washington with 4,662.
What is the Total Eastern European Population in the State of Washington?
Total Eastern European Population in Washington is 21,487.
What is the Total Eastern European Population in the United States?
Total Eastern European Population in the United States is 1,005,654.