Cities with the Highest Percentage of Immigrants from Jamaica in Washington
RELATED REPORTS & OPTIONS
Jamaica
Washington
Compare Cities
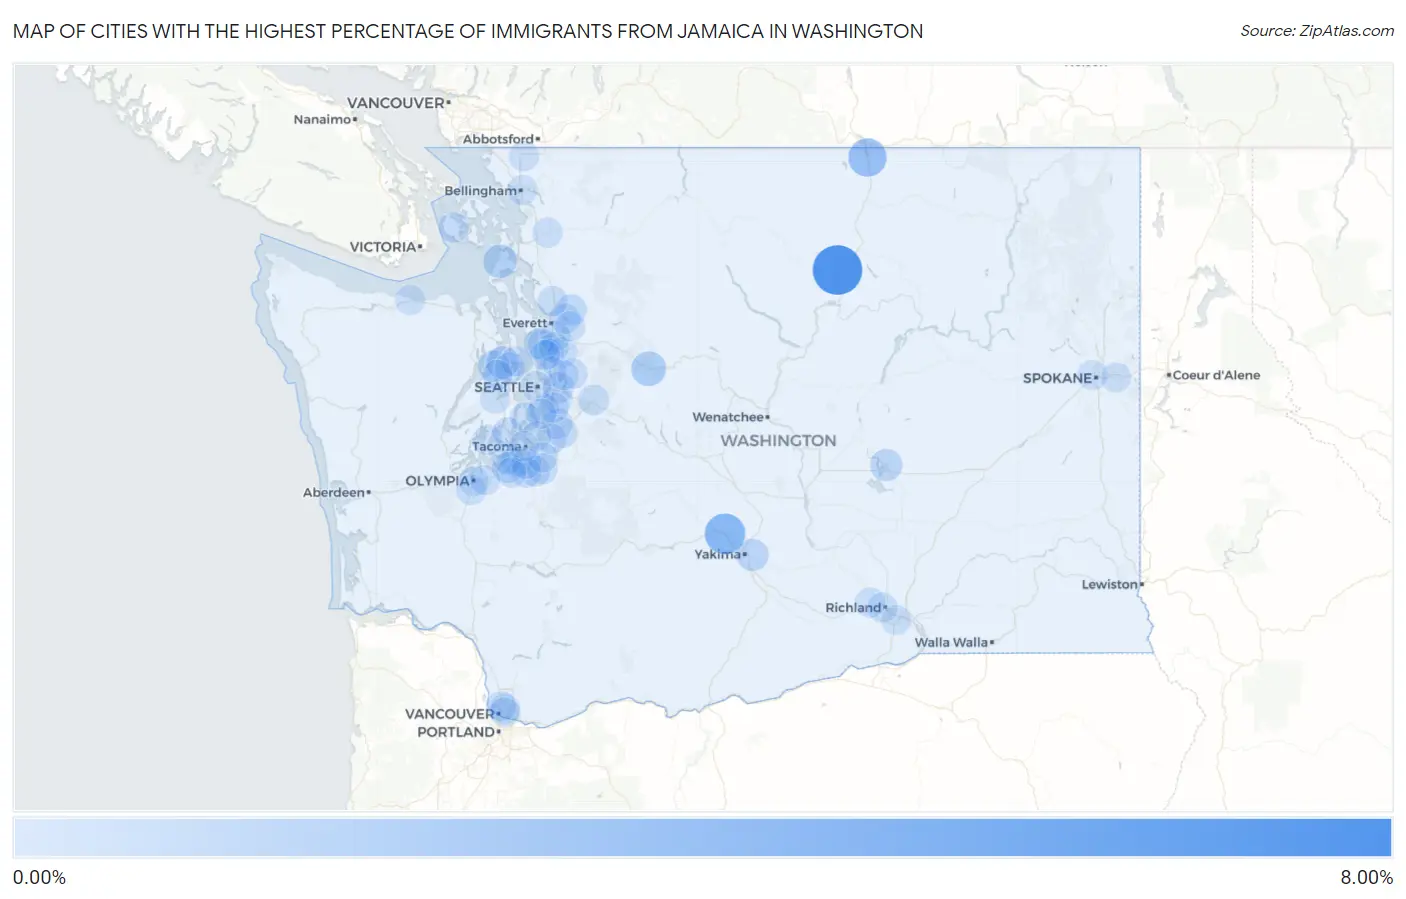
Map of Cities with the Highest Percentage of Immigrants from Jamaica in Washington
0.00%
8.00%
Cities with the Highest Percentage of Immigrants from Jamaica in Washington
| City | Jamaica | vs State | vs National | |
| 1. | Clear Lake Cdp Pierce County | 7.95% | 0.045%(+7.91)#83 | 0.24%(+7.71)#3,366 |
| 2. | Malott | 7.77% | 0.045%(+7.72)#86 | 0.24%(+7.53)#3,444 |
| 3. | Naches | 4.05% | 0.045%(+4.01)#87 | 0.24%(+3.82)#3,445 |
| 4. | Oroville | 3.14% | 0.045%(+3.09)#88 | 0.24%(+2.90)#3,446 |
| 5. | Skykomish | 1.72% | 0.045%(+1.68)#173 | 0.24%(+1.49)#6,512 |
| 6. | Whidbey Island Station | 1.29% | 0.045%(+1.24)#253 | 0.24%(+1.05)#8,893 |
| 7. | Poulsbo | 0.97% | 0.045%(+0.927)#254 | 0.24%(+0.735)#8,894 |
| 8. | Terrace Heights | 0.83% | 0.045%(+0.783)#255 | 0.24%(+0.591)#8,895 |
| 9. | Moses Lake | 0.80% | 0.045%(+0.754)#256 | 0.24%(+0.562)#8,896 |
| 10. | Bangor Base | 0.61% | 0.045%(+0.567)#287 | 0.24%(+0.375)#9,973 |
| 11. | North Lynnwood | 0.57% | 0.045%(+0.528)#288 | 0.24%(+0.336)#9,974 |
| 12. | Lochsloy | 0.52% | 0.045%(+0.477)#322 | 0.24%(+0.285)#11,158 |
| 13. | Lakewood | 0.31% | 0.045%(+0.262)#323 | 0.24%(+0.070)#11,159 |
| 14. | Steilacoom | 0.28% | 0.045%(+0.239)#324 | 0.24%(+0.047)#11,160 |
| 15. | Meadowdale | 0.27% | 0.045%(+0.222)#400 | 0.24%(+0.030)#14,355 |
| 16. | North Fort Lewis | 0.27% | 0.045%(+0.221)#401 | 0.24%(+0.028)#14,356 |
| 17. | Snoqualmie | 0.24% | 0.045%(+0.195)#402 | 0.24%(+0.002)#14,357 |
| 18. | Eastmont | 0.24% | 0.045%(+0.192)#403 | 0.24%(-0.000)#14,358 |
| 19. | Lake Stevens | 0.19% | 0.045%(+0.145)#404 | 0.24%(-0.047)#14,359 |
| 20. | Bellevue | 0.19% | 0.045%(+0.143)#405 | 0.24%(-0.049)#14,360 |
| 21. | Frederickson | 0.19% | 0.045%(+0.141)#406 | 0.24%(-0.051)#14,361 |
| 22. | South Hill | 0.18% | 0.045%(+0.138)#407 | 0.24%(-0.055)#14,362 |
| 23. | Union Hill Novelty Hill | 0.18% | 0.045%(+0.132)#408 | 0.24%(-0.060)#14,363 |
| 24. | Tukwila | 0.13% | 0.045%(+0.080)#409 | 0.24%(-0.112)#14,364 |
| 25. | Kent | 0.11% | 0.045%(+0.069)#410 | 0.24%(-0.123)#14,365 |
| 26. | Auburn | 0.11% | 0.045%(+0.065)#411 | 0.24%(-0.128)#14,366 |
| 27. | Lake Morton Berrydale | 0.11% | 0.045%(+0.060)#412 | 0.24%(-0.132)#14,367 |
| 28. | Suquamish | 0.092% | 0.045%(+0.047)#413 | 0.24%(-0.145)#14,368 |
| 29. | Gig Harbor | 0.084% | 0.045%(+0.039)#414 | 0.24%(-0.153)#15,312 |
| 30. | Marysville | 0.080% | 0.045%(+0.035)#415 | 0.24%(-0.157)#15,313 |
| 31. | Maltby | 0.079% | 0.045%(+0.034)#416 | 0.24%(-0.158)#15,314 |
| 32. | Tumwater | 0.078% | 0.045%(+0.033)#417 | 0.24%(-0.159)#15,315 |
| 33. | Spanaway | 0.076% | 0.045%(+0.031)#418 | 0.24%(-0.161)#15,316 |
| 34. | Friday Harbor | 0.076% | 0.045%(+0.030)#419 | 0.24%(-0.162)#15,317 |
| 35. | Minnehaha | 0.069% | 0.045%(+0.024)#420 | 0.24%(-0.168)#15,318 |
| 36. | Parkland | 0.066% | 0.045%(+0.021)#421 | 0.24%(-0.171)#15,319 |
| 37. | Sedro Woolley | 0.064% | 0.045%(+0.019)#422 | 0.24%(-0.173)#15,320 |
| 38. | Federal Way | 0.063% | 0.045%(+0.018)#423 | 0.24%(-0.174)#15,321 |
| 39. | Home | 0.059% | 0.045%(+0.014)#427 | 0.24%(-0.178)#16,542 |
| 40. | Puyallup | 0.059% | 0.045%(+0.014)#428 | 0.24%(-0.179)#16,543 |
| 41. | Bellingham | 0.058% | 0.045%(+0.013)#429 | 0.24%(-0.179)#16,544 |
| 42. | Indianola | 0.056% | 0.045%(+0.011)#430 | 0.24%(-0.181)#16,545 |
| 43. | West Richland | 0.054% | 0.045%(+0.009)#431 | 0.24%(-0.183)#16,546 |
| 44. | Newcastle | 0.054% | 0.045%(+0.009)#432 | 0.24%(-0.183)#16,547 |
| 45. | Fort Lewis | 0.052% | 0.045%(+0.007)#433 | 0.24%(-0.185)#16,548 |
| 46. | Renton | 0.051% | 0.045%(+0.006)#434 | 0.24%(-0.186)#16,549 |
| 47. | Tacoma | 0.042% | 0.045%(-0.003)#435 | 0.24%(-0.195)#16,550 |
| 48. | Port Angeles | 0.040% | 0.045%(-0.005)#436 | 0.24%(-0.197)#16,551 |
| 49. | Richland | 0.039% | 0.045%(-0.006)#437 | 0.24%(-0.198)#16,552 |
| 50. | Bothell West | 0.039% | 0.045%(-0.006)#438 | 0.24%(-0.198)#16,553 |
| 51. | Olympia | 0.033% | 0.045%(-0.013)#439 | 0.24%(-0.205)#16,554 |
| 52. | Lacey | 0.032% | 0.045%(-0.013)#440 | 0.24%(-0.205)#16,555 |
| 53. | Mill Creek East | 0.032% | 0.045%(-0.014)#441 | 0.24%(-0.206)#16,556 |
| 54. | Kirkland | 0.028% | 0.045%(-0.017)#442 | 0.24%(-0.209)#16,557 |
| 55. | Lynden | 0.019% | 0.045%(-0.026)#443 | 0.24%(-0.218)#16,558 |
| 56. | Bremerton | 0.018% | 0.045%(-0.027)#444 | 0.24%(-0.219)#16,559 |
| 57. | Redmond | 0.018% | 0.045%(-0.028)#445 | 0.24%(-0.220)#16,560 |
| 58. | Seattle | 0.017% | 0.045%(-0.028)#446 | 0.24%(-0.220)#16,561 |
| 59. | Brier | 0.015% | 0.045%(-0.030)#447 | 0.24%(-0.222)#16,562 |
| 60. | Silverdale | 0.014% | 0.045%(-0.031)#448 | 0.24%(-0.224)#16,563 |
| 61. | Hazel Dell | 0.013% | 0.045%(-0.032)#449 | 0.24%(-0.224)#16,564 |
| 62. | Everett | 0.012% | 0.045%(-0.033)#450 | 0.24%(-0.226)#16,565 |
| 63. | Vashon | 0.0091% | 0.045%(-0.036)#451 | 0.24%(-0.228)#16,566 |
| 64. | Spokane | 0.0039% | 0.045%(-0.041)#452 | 0.24%(-0.233)#16,567 |
| 65. | Seatac | 0.0032% | 0.045%(-0.042)#453 | 0.24%(-0.234)#16,568 |
| 66. | Kennewick | 0.0024% | 0.045%(-0.043)#454 | 0.24%(-0.235)#16,569 |
| 67. | Spokane Valley | 0.00096% | 0.045%(-0.044)#455 | 0.24%(-0.236)#16,570 |
| 68. | Vancouver | 0.00052% | 0.045%(-0.045)#456 | 0.24%(-0.237)#16,571 |
Common Questions
What are the Top 10 Cities with the Highest Percentage of Immigrants from Jamaica in Washington?
Top 10 Cities with the Highest Percentage of Immigrants from Jamaica in Washington are:
#1
7.77%
#2
4.05%
#3
3.14%
#4
1.72%
#5
1.29%
#6
0.97%
#7
0.83%
#8
0.80%
#9
0.61%
#10
0.57%
What city has the Highest Percentage of Immigrants from Jamaica in Washington?
Malott has the Highest Percentage of Immigrants from Jamaica in Washington with 7.77%.
What is the Percentage of Immigrants from Jamaica in the State of Washington?
Percentage of Immigrants from Jamaica in Washington is 0.045%.
What is the Percentage of Immigrants from Jamaica in the United States?
Percentage of Immigrants from Jamaica in the United States is 0.24%.