Cities with the Highest Poverty Level Among Single Males in Washington
RELATED REPORTS & OPTIONS
Highest Poverty | Single Male
Washington
Compare Cities
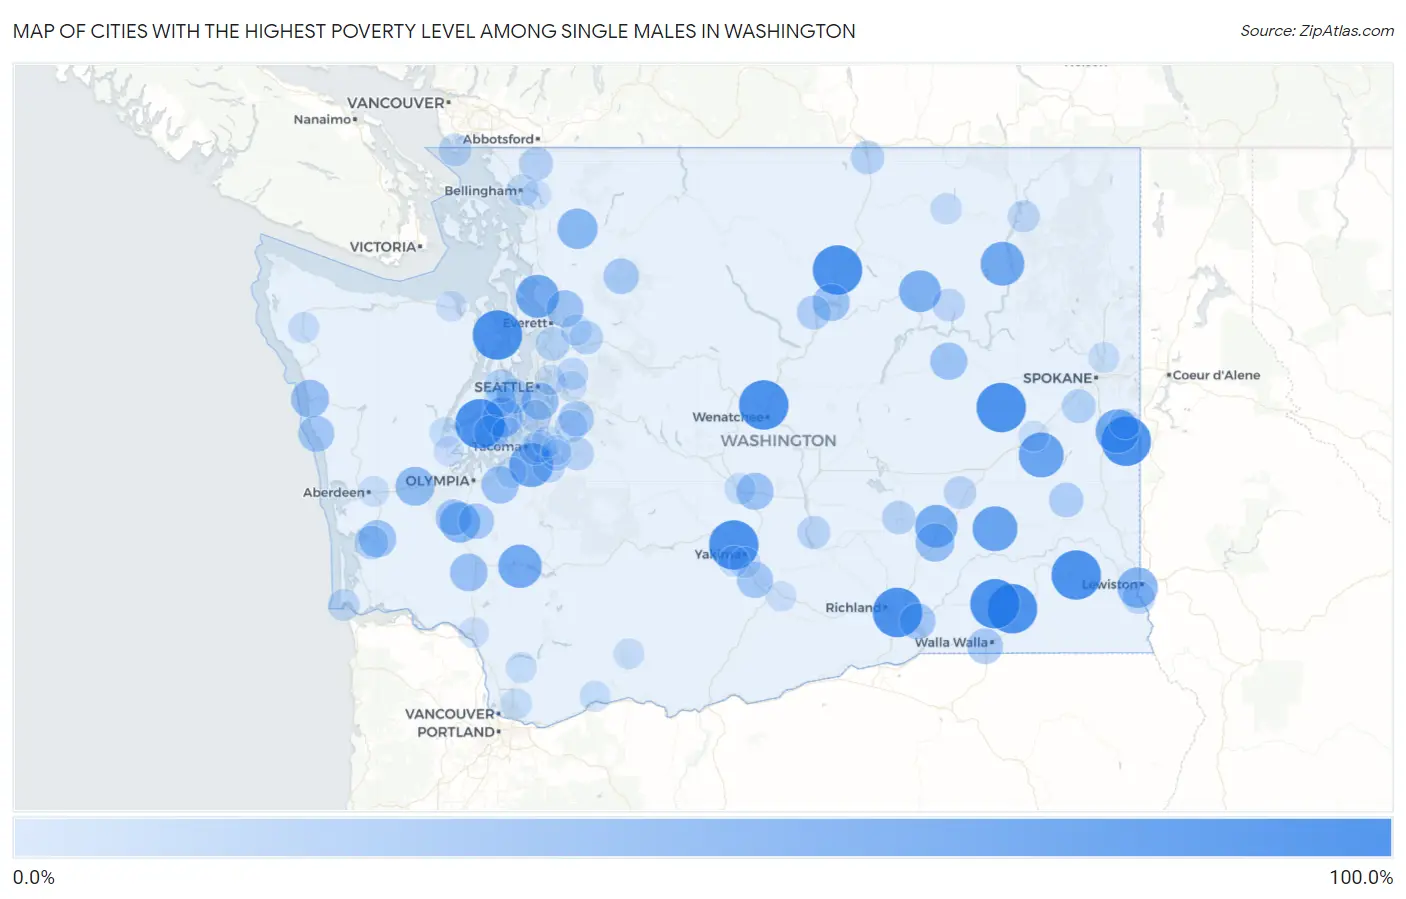
Map of Cities with the Highest Poverty Level Among Single Males in Washington
0.0%
100.0%
Cities with the Highest Poverty Level Among Single Males in Washington
| City | Single Male Poverty | vs State | vs National | |
| 1. | Sunnyslope | 100.0% | 9.3%(+90.7)#1 | 12.4%(+87.6)#31 |
| 2. | Gleed | 100.0% | 9.3%(+90.7)#2 | 12.4%(+87.6)#41 |
| 3. | Port Ludlow | 100.0% | 9.3%(+90.7)#3 | 12.4%(+87.6)#47 |
| 4. | Allyn | 100.0% | 9.3%(+90.7)#4 | 12.4%(+87.6)#87 |
| 5. | West Pasco | 100.0% | 9.3%(+90.7)#5 | 12.4%(+87.6)#109 |
| 6. | Pomeroy | 100.0% | 9.3%(+90.7)#6 | 12.4%(+87.6)#159 |
| 7. | Waitsburg | 100.0% | 9.3%(+90.7)#7 | 12.4%(+87.6)#253 |
| 8. | Malott | 100.0% | 9.3%(+90.7)#8 | 12.4%(+87.6)#263 |
| 9. | Harrington | 100.0% | 9.3%(+90.7)#9 | 12.4%(+87.6)#437 |
| 10. | Prescott | 100.0% | 9.3%(+90.7)#10 | 12.4%(+87.6)#537 |
| 11. | Latah | 100.0% | 9.3%(+90.7)#11 | 12.4%(+87.6)#700 |
| 12. | Clear Lake Cdp Skagit County | 90.6% | 9.3%(+81.4)#12 | 12.4%(+78.2)#943 |
| 13. | Washtucna | 80.0% | 9.3%(+70.7)#13 | 12.4%(+67.6)#1,108 |
| 14. | Lamont | 80.0% | 9.3%(+70.7)#14 | 12.4%(+67.6)#1,109 |
| 15. | Clover Creek | 76.7% | 9.3%(+67.4)#15 | 12.4%(+64.2)#1,161 |
| 16. | Inchelium | 75.0% | 9.3%(+65.7)#16 | 12.4%(+62.6)#1,211 |
| 17. | Waverly | 75.0% | 9.3%(+65.7)#17 | 12.4%(+62.6)#1,221 |
| 18. | Mossyrock | 73.7% | 9.3%(+64.4)#18 | 12.4%(+61.2)#1,236 |
| 19. | Kayak Point | 71.7% | 9.3%(+62.5)#19 | 12.4%(+59.3)#1,273 |
| 20. | Hatton | 70.0% | 9.3%(+60.7)#20 | 12.4%(+57.6)#1,347 |
| 21. | Nespelem | 66.7% | 9.3%(+57.4)#21 | 12.4%(+54.2)#1,484 |
| 22. | West Clarkston Highland | 60.9% | 9.3%(+51.6)#22 | 12.4%(+48.4)#1,681 |
| 23. | Grand Mound | 60.0% | 9.3%(+50.7)#23 | 12.4%(+47.6)#1,707 |
| 24. | Hamilton | 60.0% | 9.3%(+50.7)#24 | 12.4%(+47.6)#1,743 |
| 25. | Burley | 58.3% | 9.3%(+49.1)#25 | 12.4%(+45.9)#1,805 |
| 26. | Elma | 54.4% | 9.3%(+45.1)#26 | 12.4%(+41.9)#2,000 |
| 27. | Connell | 52.4% | 9.3%(+43.1)#27 | 12.4%(+39.9)#2,109 |
| 28. | Queets | 50.0% | 9.3%(+40.7)#28 | 12.4%(+37.6)#2,381 |
| 29. | Winlock | 48.6% | 9.3%(+39.3)#29 | 12.4%(+36.1)#2,441 |
| 30. | Raymond | 47.4% | 9.3%(+38.1)#30 | 12.4%(+34.9)#2,497 |
| 31. | Nisqually Indian Community | 47.4% | 9.3%(+38.1)#31 | 12.4%(+34.9)#2,501 |
| 32. | Wilbur | 47.1% | 9.3%(+37.8)#32 | 12.4%(+34.6)#2,517 |
| 33. | Brewster | 46.3% | 9.3%(+37.0)#33 | 12.4%(+33.8)#2,572 |
| 34. | Lake Cassidy | 46.2% | 9.3%(+36.9)#34 | 12.4%(+33.7)#2,576 |
| 35. | Kittitas | 46.2% | 9.3%(+36.9)#35 | 12.4%(+33.7)#2,581 |
| 36. | Boulevard Park | 46.0% | 9.3%(+36.7)#36 | 12.4%(+33.5)#2,598 |
| 37. | Rochester | 43.0% | 9.3%(+33.7)#37 | 12.4%(+30.6)#2,781 |
| 38. | Wapato | 42.2% | 9.3%(+33.0)#38 | 12.4%(+29.8)#2,851 |
| 39. | Taholah | 42.1% | 9.3%(+32.8)#39 | 12.4%(+29.7)#2,867 |
| 40. | Burbank | 41.5% | 9.3%(+32.2)#40 | 12.4%(+29.0)#2,922 |
| 41. | Bucoda | 40.0% | 9.3%(+30.7)#41 | 12.4%(+27.6)#3,062 |
| 42. | College Place | 39.8% | 9.3%(+30.6)#42 | 12.4%(+27.4)#3,114 |
| 43. | Fairwood Cdp Spokane County | 39.8% | 9.3%(+30.5)#43 | 12.4%(+27.4)#3,115 |
| 44. | Darrington | 39.7% | 9.3%(+30.4)#44 | 12.4%(+27.2)#3,121 |
| 45. | Hobart | 38.8% | 9.3%(+29.6)#45 | 12.4%(+26.4)#3,180 |
| 46. | Key Center | 38.0% | 9.3%(+28.7)#46 | 12.4%(+25.5)#3,240 |
| 47. | Manchester | 37.1% | 9.3%(+27.8)#47 | 12.4%(+24.7)#3,327 |
| 48. | Endicott | 35.7% | 9.3%(+26.5)#48 | 12.4%(+23.3)#3,468 |
| 49. | Pateros | 33.3% | 9.3%(+24.1)#49 | 12.4%(+20.9)#3,719 |
| 50. | Cheney | 32.8% | 9.3%(+23.5)#50 | 12.4%(+20.4)#3,860 |
| 51. | Tracyton | 32.2% | 9.3%(+22.9)#51 | 12.4%(+19.8)#3,924 |
| 52. | Mill Creek | 32.1% | 9.3%(+22.9)#52 | 12.4%(+19.7)#3,933 |
| 53. | South Bend | 32.0% | 9.3%(+22.7)#53 | 12.4%(+19.5)#3,948 |
| 54. | Woods Creek | 31.6% | 9.3%(+22.3)#54 | 12.4%(+19.1)#3,979 |
| 55. | Oroville | 31.5% | 9.3%(+22.2)#55 | 12.4%(+19.0)#3,998 |
| 56. | Everson | 31.4% | 9.3%(+22.1)#56 | 12.4%(+18.9)#4,012 |
| 57. | Othello | 30.9% | 9.3%(+21.6)#57 | 12.4%(+18.5)#4,057 |
| 58. | Enumclaw | 29.4% | 9.3%(+20.1)#58 | 12.4%(+16.9)#4,253 |
| 59. | Mattawa | 29.4% | 9.3%(+20.1)#59 | 12.4%(+16.9)#4,254 |
| 60. | Asotin | 29.0% | 9.3%(+19.8)#60 | 12.4%(+16.6)#4,286 |
| 61. | Normandy Park | 28.1% | 9.3%(+18.8)#61 | 12.4%(+15.6)#4,424 |
| 62. | Lind | 27.9% | 9.3%(+18.6)#62 | 12.4%(+15.4)#4,456 |
| 63. | Point Roberts | 27.8% | 9.3%(+18.5)#63 | 12.4%(+15.3)#4,474 |
| 64. | Keller | 27.8% | 9.3%(+18.5)#64 | 12.4%(+15.3)#4,486 |
| 65. | Mcmillin | 27.6% | 9.3%(+18.3)#65 | 12.4%(+15.2)#4,501 |
| 66. | Port Orchard | 26.9% | 9.3%(+17.6)#66 | 12.4%(+14.4)#4,602 |
| 67. | Maple Valley | 26.7% | 9.3%(+17.5)#67 | 12.4%(+14.3)#4,617 |
| 68. | Milton | 26.7% | 9.3%(+17.5)#68 | 12.4%(+14.3)#4,622 |
| 69. | Fife | 26.6% | 9.3%(+17.3)#69 | 12.4%(+14.1)#4,648 |
| 70. | Union Hill Novelty Hill | 25.3% | 9.3%(+16.0)#70 | 12.4%(+12.9)#4,803 |
| 71. | Kettle Falls | 25.0% | 9.3%(+15.7)#71 | 12.4%(+12.6)#4,853 |
| 72. | Ilwaco | 25.0% | 9.3%(+15.7)#72 | 12.4%(+12.6)#4,860 |
| 73. | Bellingham | 23.8% | 9.3%(+14.6)#73 | 12.4%(+11.4)#5,115 |
| 74. | Republic | 23.1% | 9.3%(+13.8)#74 | 12.4%(+10.6)#5,242 |
| 75. | Algona | 22.4% | 9.3%(+13.2)#75 | 12.4%(+9.99)#5,354 |
| 76. | Ellensburg | 22.4% | 9.3%(+13.1)#76 | 12.4%(+9.94)#5,364 |
| 77. | Three Lakes | 22.3% | 9.3%(+13.1)#77 | 12.4%(+9.89)#5,371 |
| 78. | Bonney Lake | 22.1% | 9.3%(+12.9)#78 | 12.4%(+9.69)#5,429 |
| 79. | Forks | 21.9% | 9.3%(+12.6)#79 | 12.4%(+9.44)#5,461 |
| 80. | Union Gap | 21.6% | 9.3%(+12.3)#80 | 12.4%(+9.13)#5,514 |
| 81. | Skokomish | 21.4% | 9.3%(+12.2)#81 | 12.4%(+8.99)#5,550 |
| 82. | Orchards | 20.8% | 9.3%(+11.6)#82 | 12.4%(+8.40)#5,655 |
| 83. | Carson | 20.8% | 9.3%(+11.6)#83 | 12.4%(+8.40)#5,660 |
| 84. | Mead | 20.8% | 9.3%(+11.5)#84 | 12.4%(+8.37)#5,672 |
| 85. | Amboy | 20.7% | 9.3%(+11.4)#85 | 12.4%(+8.25)#5,690 |
| 86. | Fort Lewis | 20.7% | 9.3%(+11.4)#86 | 12.4%(+8.22)#5,695 |
| 87. | Ahtanum | 20.6% | 9.3%(+11.3)#87 | 12.4%(+8.15)#5,706 |
| 88. | Aberdeen | 20.2% | 9.3%(+11.0)#88 | 12.4%(+7.78)#5,773 |
| 89. | Trout Lake | 20.0% | 9.3%(+10.7)#89 | 12.4%(+7.56)#5,846 |
| 90. | Sprague | 20.0% | 9.3%(+10.7)#90 | 12.4%(+7.56)#5,855 |
| 91. | Fairfield | 20.0% | 9.3%(+10.7)#91 | 12.4%(+7.56)#5,858 |
| 92. | Sammamish | 19.2% | 9.3%(+9.99)#92 | 12.4%(+6.81)#6,009 |
| 93. | Kelso | 19.2% | 9.3%(+9.92)#93 | 12.4%(+6.75)#6,030 |
| 94. | Gig Harbor | 19.0% | 9.3%(+9.70)#94 | 12.4%(+6.53)#6,075 |
| 95. | Sequim | 18.9% | 9.3%(+9.63)#95 | 12.4%(+6.45)#6,086 |
| 96. | Shelton | 18.6% | 9.3%(+9.34)#96 | 12.4%(+6.17)#6,140 |
| 97. | Granger | 18.3% | 9.3%(+9.00)#97 | 12.4%(+5.83)#6,193 |
| 98. | Yarrow Point | 18.2% | 9.3%(+8.92)#98 | 12.4%(+5.75)#6,216 |
| 99. | Lake Tapps | 17.6% | 9.3%(+8.31)#99 | 12.4%(+5.14)#6,357 |
| 100. | Sudden Valley | 17.2% | 9.3%(+7.95)#100 | 12.4%(+4.78)#6,432 |
Common Questions
What are the Top 10 Cities with the Highest Poverty Level Among Single Males in Washington?
Top 10 Cities with the Highest Poverty Level Among Single Males in Washington are:
#1
100.0%
#2
100.0%
#3
100.0%
#4
100.0%
#5
100.0%
#6
100.0%
#7
100.0%
#8
100.0%
#9
100.0%
#10
100.0%
What city has the Highest Poverty Level Among Single Males in Washington?
Sunnyslope has the Highest Poverty Level Among Single Males in Washington with 100.0%.
What is the Poverty Level Among Single Males in the State of Washington?
Poverty Level Among Single Males in Washington is 9.3%.
What is the Poverty Level Among Single Males in the United States?
Poverty Level Among Single Males in the United States is 12.4%.