Cities with the Highest Percentage of Immigrants from Canada in Washington
RELATED REPORTS & OPTIONS
Canada
Washington
Compare Cities
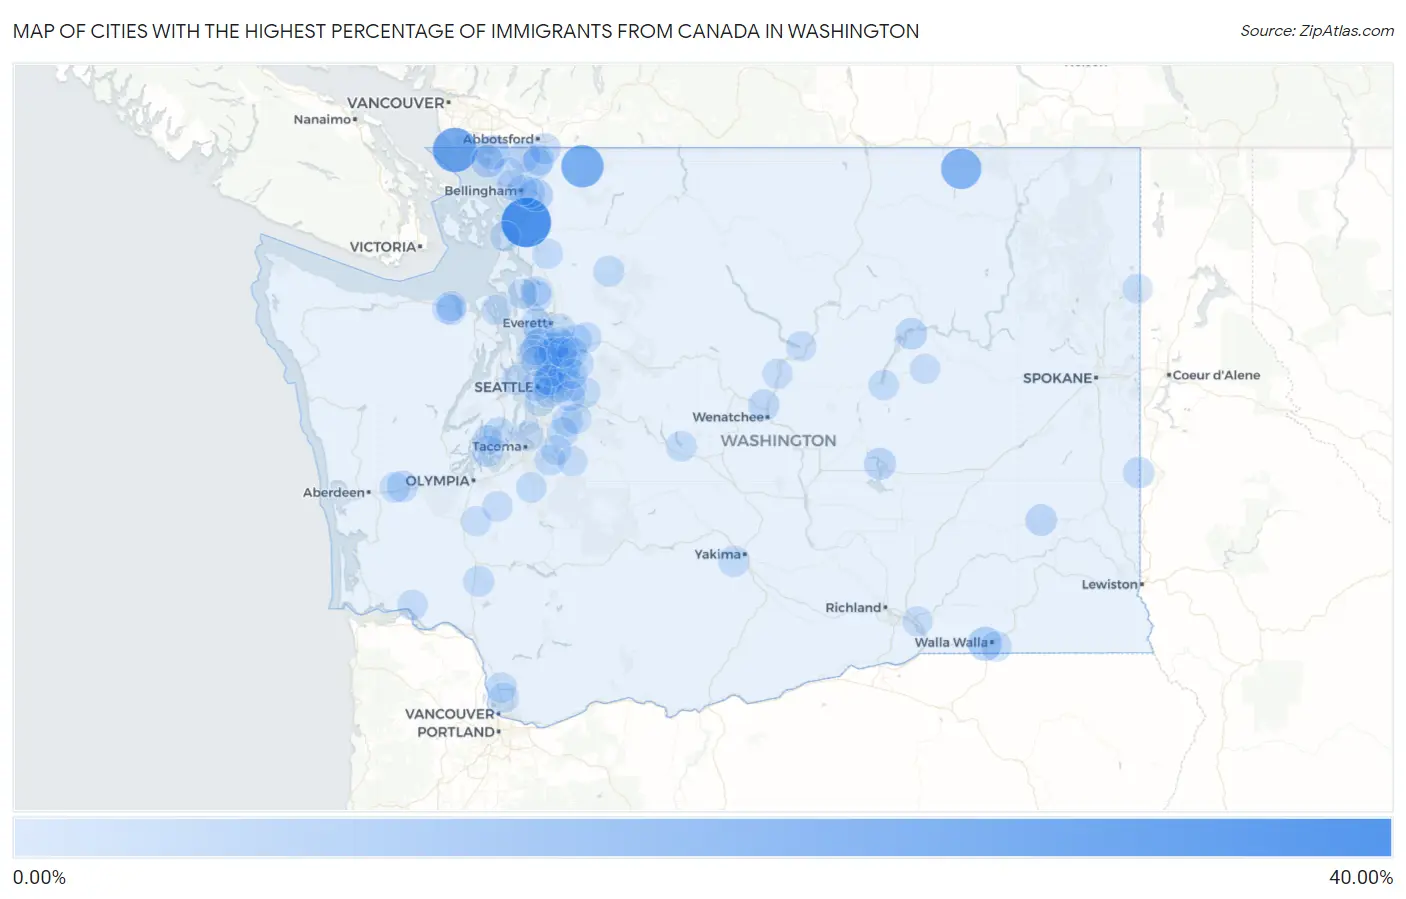
Map of Cities with the Highest Percentage of Immigrants from Canada in Washington
0.00%
40.00%
Cities with the Highest Percentage of Immigrants from Canada in Washington
| City | Canada | vs State | vs National | |
| 1. | Edison | 33.00% | 0.61%(+32.4)#-1 | 0.25%(+32.8)#0 |
| 2. | Point Roberts | 24.26% | 0.61%(+23.6)#0 | 0.25%(+24.0)#1 |
| 3. | Glacier | 20.75% | 0.61%(+20.1)#1 | 0.25%(+20.5)#2 |
| 4. | Curlew | 17.59% | 0.61%(+17.0)#2 | 0.25%(+17.3)#3 |
| 5. | Sunland Estates | 8.18% | 0.61%(+7.57)#3 | 0.25%(+7.93)#4 |
| 6. | Blaine | 7.33% | 0.61%(+6.72)#49 | 0.25%(+7.08)#1,618 |
| 7. | Garrett | 7.10% | 0.61%(+6.49)#50 | 0.25%(+6.85)#1,619 |
| 8. | Birch Bay | 5.03% | 0.61%(+4.41)#51 | 0.25%(+4.78)#1,620 |
| 9. | Sudden Valley | 5.00% | 0.61%(+4.38)#52 | 0.25%(+4.75)#1,621 |
| 10. | Ocosta | 4.50% | 0.61%(+3.89)#53 | 0.25%(+4.26)#1,622 |
| 11. | Crescent Bar | 4.00% | 0.61%(+3.39)#54 | 0.25%(+3.75)#1,623 |
| 12. | Cascade Valley | 3.76% | 0.61%(+3.15)#55 | 0.25%(+3.51)#1,624 |
| 13. | Lacrosse | 3.36% | 0.61%(+2.74)#56 | 0.25%(+3.11)#1,625 |
| 14. | Electric City | 3.28% | 0.61%(+2.66)#57 | 0.25%(+3.03)#1,626 |
| 15. | Lynden | 3.12% | 0.61%(+2.51)#58 | 0.25%(+2.87)#1,627 |
| 16. | Brady | 3.01% | 0.61%(+2.40)#59 | 0.25%(+2.77)#1,628 |
| 17. | Sunnyslope | 2.98% | 0.61%(+2.37)#60 | 0.25%(+2.74)#1,629 |
| 18. | Medina | 2.84% | 0.61%(+2.23)#61 | 0.25%(+2.59)#1,630 |
| 19. | Farmington | 2.78% | 0.61%(+2.16)#62 | 0.25%(+2.53)#1,631 |
| 20. | Everson | 2.77% | 0.61%(+2.16)#63 | 0.25%(+2.52)#1,632 |
| 21. | Longbranch | 2.70% | 0.61%(+2.08)#64 | 0.25%(+2.45)#1,633 |
| 22. | Sumas | 2.65% | 0.61%(+2.03)#65 | 0.25%(+2.40)#1,634 |
| 23. | Nooksack | 2.43% | 0.61%(+1.82)#66 | 0.25%(+2.18)#1,635 |
| 24. | Mukilteo | 2.43% | 0.61%(+1.81)#67 | 0.25%(+2.18)#1,636 |
| 25. | Ahtanum | 2.42% | 0.61%(+1.80)#68 | 0.25%(+2.17)#1,637 |
| 26. | Swede Heaven | 2.38% | 0.61%(+1.77)#69 | 0.25%(+2.13)#1,638 |
| 27. | Toledo | 2.29% | 0.61%(+1.68)#70 | 0.25%(+2.05)#1,639 |
| 28. | Raft Island | 2.22% | 0.61%(+1.60)#71 | 0.25%(+1.97)#1,640 |
| 29. | Clyde Hill | 2.16% | 0.61%(+1.54)#72 | 0.25%(+1.91)#1,641 |
| 30. | Monroe North | 2.07% | 0.61%(+1.46)#73 | 0.25%(+1.83)#1,642 |
| 31. | Alderton | 2.05% | 0.61%(+1.43)#74 | 0.25%(+1.80)#1,643 |
| 32. | Shadow Lake | 1.99% | 0.61%(+1.37)#75 | 0.25%(+1.74)#1,644 |
| 33. | Geneva | 1.96% | 0.61%(+1.34)#76 | 0.25%(+1.71)#1,645 |
| 34. | Woodinville | 1.92% | 0.61%(+1.30)#77 | 0.25%(+1.67)#1,646 |
| 35. | Duluth | 1.91% | 0.61%(+1.30)#78 | 0.25%(+1.66)#1,647 |
| 36. | Cathcart | 1.90% | 0.61%(+1.29)#79 | 0.25%(+1.65)#1,648 |
| 37. | Clinton | 1.89% | 0.61%(+1.27)#80 | 0.25%(+1.64)#1,649 |
| 38. | Fall City | 1.88% | 0.61%(+1.27)#81 | 0.25%(+1.63)#1,650 |
| 39. | Montesano | 1.75% | 0.61%(+1.13)#82 | 0.25%(+1.50)#1,651 |
| 40. | Marietta Alderwood | 1.73% | 0.61%(+1.11)#83 | 0.25%(+1.48)#1,652 |
| 41. | Walla Walla East | 1.70% | 0.61%(+1.08)#84 | 0.25%(+1.45)#1,653 |
| 42. | Clear Lake Cdp Skagit County | 1.69% | 0.61%(+1.08)#85 | 0.25%(+1.45)#1,654 |
| 43. | River Road | 1.63% | 0.61%(+1.01)#86 | 0.25%(+1.38)#1,655 |
| 44. | Cottage Lake | 1.60% | 0.61%(+0.982)#87 | 0.25%(+1.35)#1,656 |
| 45. | Roslyn | 1.57% | 0.61%(+0.958)#88 | 0.25%(+1.32)#1,657 |
| 46. | Sammamish | 1.56% | 0.61%(+0.943)#89 | 0.25%(+1.31)#1,888 |
| 47. | Redmond | 1.52% | 0.61%(+0.905)#90 | 0.25%(+1.27)#1,889 |
| 48. | Woods Creek | 1.52% | 0.61%(+0.904)#91 | 0.25%(+1.27)#1,890 |
| 49. | Meadowdale | 1.50% | 0.61%(+0.888)#92 | 0.25%(+1.25)#1,891 |
| 50. | Big Lake | 1.50% | 0.61%(+0.885)#93 | 0.25%(+1.25)#1,892 |
| 51. | Lake Morton Berrydale | 1.48% | 0.61%(+0.868)#94 | 0.25%(+1.23)#1,893 |
| 52. | Bellingham | 1.45% | 0.61%(+0.835)#95 | 0.25%(+1.20)#1,894 |
| 53. | South Creek | 1.45% | 0.61%(+0.835)#96 | 0.25%(+1.20)#1,895 |
| 54. | Kayak Point | 1.44% | 0.61%(+0.831)#97 | 0.25%(+1.20)#1,896 |
| 55. | Boulevard Park | 1.43% | 0.61%(+0.814)#98 | 0.25%(+1.18)#1,897 |
| 56. | Warm Beach | 1.43% | 0.61%(+0.811)#99 | 0.25%(+1.18)#1,898 |
| 57. | Bothell West | 1.42% | 0.61%(+0.803)#100 | 0.25%(+1.17)#1,899 |
| 58. | Mill Creek East | 1.41% | 0.61%(+0.801)#101 | 0.25%(+1.17)#1,900 |
| 59. | Coulee City | 1.39% | 0.61%(+0.777)#102 | 0.25%(+1.14)#1,901 |
| 60. | Skamokawa Valley | 1.39% | 0.61%(+0.774)#103 | 0.25%(+1.14)#1,902 |
| 61. | Mercer Island | 1.38% | 0.61%(+0.768)#104 | 0.25%(+1.13)#1,903 |
| 62. | Duvall | 1.38% | 0.61%(+0.764)#105 | 0.25%(+1.13)#1,904 |
| 63. | Rainier | 1.37% | 0.61%(+0.752)#106 | 0.25%(+1.12)#1,905 |
| 64. | Marrowstone | 1.36% | 0.61%(+0.746)#107 | 0.25%(+1.11)#1,906 |
| 65. | Bell Hill | 1.33% | 0.61%(+0.719)#108 | 0.25%(+1.09)#1,907 |
| 66. | Bellevue | 1.31% | 0.61%(+0.692)#109 | 0.25%(+1.06)#1,908 |
| 67. | Dash Point | 1.30% | 0.61%(+0.686)#110 | 0.25%(+1.05)#1,909 |
| 68. | Tehaleh | 1.30% | 0.61%(+0.686)#111 | 0.25%(+1.05)#1,910 |
| 69. | Kirkland | 1.29% | 0.61%(+0.680)#112 | 0.25%(+1.05)#1,911 |
| 70. | Chelan | 1.26% | 0.61%(+0.651)#113 | 0.25%(+1.02)#1,912 |
| 71. | Kenmore | 1.26% | 0.61%(+0.643)#114 | 0.25%(+1.01)#1,913 |
| 72. | Silver Firs | 1.26% | 0.61%(+0.641)#115 | 0.25%(+1.01)#2,168 |
| 73. | Bothell East | 1.24% | 0.61%(+0.626)#116 | 0.25%(+0.992)#2,169 |
| 74. | Hunts Point | 1.24% | 0.61%(+0.624)#117 | 0.25%(+0.990)#2,170 |
| 75. | Lake Tapps | 1.23% | 0.61%(+0.616)#118 | 0.25%(+0.982)#2,366 |
| 76. | Hobart | 1.20% | 0.61%(+0.588)#119 | 0.25%(+0.954)#2,367 |
| 77. | Fobes Hill | 1.15% | 0.61%(+0.535)#120 | 0.25%(+0.902)#2,368 |
| 78. | Riverpoint | 1.14% | 0.61%(+0.528)#121 | 0.25%(+0.894)#2,369 |
| 79. | Home | 1.12% | 0.61%(+0.509)#122 | 0.25%(+0.875)#2,370 |
| 80. | Almira | 1.10% | 0.61%(+0.488)#123 | 0.25%(+0.854)#2,371 |
| 81. | Buckley | 1.10% | 0.61%(+0.484)#124 | 0.25%(+0.850)#2,372 |
| 82. | Seattle | 1.10% | 0.61%(+0.481)#125 | 0.25%(+0.848)#2,373 |
| 83. | Sequim | 1.08% | 0.61%(+0.463)#126 | 0.25%(+0.829)#2,374 |
| 84. | Issaquah | 1.08% | 0.61%(+0.462)#127 | 0.25%(+0.828)#2,375 |
| 85. | Fairwood Cdp Spokane County | 1.08% | 0.61%(+0.461)#128 | 0.25%(+0.827)#2,376 |
| 86. | Woodway | 1.07% | 0.61%(+0.459)#129 | 0.25%(+0.825)#2,377 |
| 87. | Edmonds | 1.07% | 0.61%(+0.453)#130 | 0.25%(+0.820)#3,028 |
| 88. | Bucoda | 1.06% | 0.61%(+0.449)#131 | 0.25%(+0.816)#3,029 |
| 89. | Entiat | 1.06% | 0.61%(+0.445)#132 | 0.25%(+0.812)#3,030 |
| 90. | Bainbridge Island | 1.05% | 0.61%(+0.439)#133 | 0.25%(+0.805)#3,031 |
| 91. | Shoreline | 1.03% | 0.61%(+0.413)#134 | 0.25%(+0.780)#3,032 |
| 92. | Anacortes | 1.01% | 0.61%(+0.399)#135 | 0.25%(+0.765)#3,033 |
| 93. | Ferndale | 1.01% | 0.61%(+0.397)#136 | 0.25%(+0.763)#3,034 |
| 94. | Mount Vista | 0.98% | 0.61%(+0.366)#137 | 0.25%(+0.733)#3,035 |
| 95. | Burbank | 0.98% | 0.61%(+0.361)#138 | 0.25%(+0.727)#3,036 |
| 96. | High Bridge | 0.98% | 0.61%(+0.361)#139 | 0.25%(+0.727)#3,037 |
| 97. | Union Hill Novelty Hill | 0.96% | 0.61%(+0.344)#140 | 0.25%(+0.710)#3,038 |
| 98. | Camano | 0.95% | 0.61%(+0.338)#141 | 0.25%(+0.704)#3,039 |
| 99. | Maltby | 0.94% | 0.61%(+0.329)#142 | 0.25%(+0.695)#3,040 |
| 100. | Newport | 0.94% | 0.61%(+0.322)#143 | 0.25%(+0.688)#3,041 |
Common Questions
What are the Top 10 Cities with the Highest Percentage of Immigrants from Canada in Washington?
Top 10 Cities with the Highest Percentage of Immigrants from Canada in Washington are:
#1
33.00%
#2
24.26%
#3
20.75%
#4
17.59%
#5
7.33%
#6
7.10%
#7
5.03%
#8
5.00%
#9
3.76%
#10
3.36%
What city has the Highest Percentage of Immigrants from Canada in Washington?
Edison has the Highest Percentage of Immigrants from Canada in Washington with 33.00%.
What is the Percentage of Immigrants from Canada in the State of Washington?
Percentage of Immigrants from Canada in Washington is 0.61%.
What is the Percentage of Immigrants from Canada in the United States?
Percentage of Immigrants from Canada in the United States is 0.25%.