Cities with the Highest Percentage of Population with a Degree in Arts and Humanities in Washington
RELATED REPORTS & OPTIONS
Arts and Humanities
Washington
Compare Cities
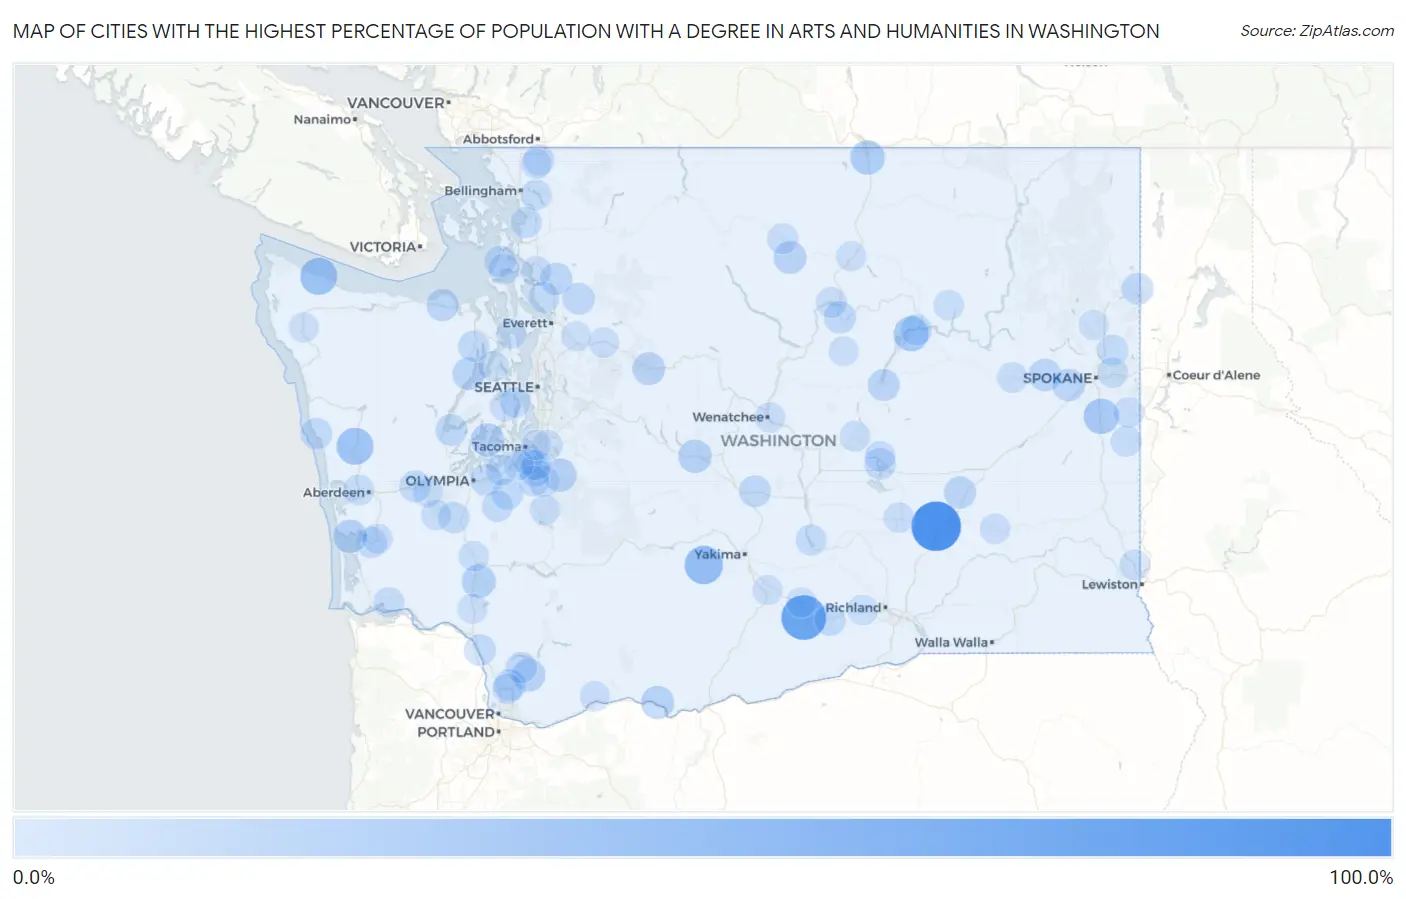
Map of Cities with the Highest Percentage of Population with a Degree in Arts and Humanities in Washington
0.0%
100.0%
Cities with the Highest Percentage of Population with a Degree in Arts and Humanities in Washington
| City | % Graduates | vs State | vs National | |
| 1. | Hatton | 100.0% | 5.2%(+94.8)#1 | 6.0%(+94.0)#16 |
| 2. | Mabton | 77.3% | 5.2%(+72.1)#2 | 6.0%(+71.3)#167 |
| 3. | Tampico | 47.4% | 5.2%(+42.2)#3 | 6.0%(+41.4)#425 |
| 4. | Clallam Bay | 41.5% | 5.2%(+36.3)#4 | 6.0%(+35.5)#522 |
| 5. | Humptulips | 40.7% | 5.2%(+35.5)#5 | 6.0%(+34.7)#542 |
| 6. | Spangle | 33.9% | 5.2%(+28.7)#6 | 6.0%(+27.9)#791 |
| 7. | Electric City | 33.0% | 5.2%(+27.8)#7 | 6.0%(+27.0)#881 |
| 8. | Oroville | 29.8% | 5.2%(+24.6)#8 | 6.0%(+23.8)#1,059 |
| 9. | Toledo | 26.4% | 5.2%(+21.2)#9 | 6.0%(+20.4)#1,343 |
| 10. | South Cle Elum | 25.0% | 5.2%(+19.8)#10 | 6.0%(+19.0)#1,432 |
| 11. | Tokeland | 25.0% | 5.2%(+19.8)#11 | 6.0%(+19.0)#1,491 |
| 12. | Home | 24.6% | 5.2%(+19.3)#12 | 6.0%(+18.6)#1,532 |
| 13. | Crocker | 24.0% | 5.2%(+18.8)#13 | 6.0%(+18.0)#1,589 |
| 14. | Lyle | 23.8% | 5.2%(+18.6)#14 | 6.0%(+17.9)#1,612 |
| 15. | Yacolt | 23.7% | 5.2%(+18.5)#15 | 6.0%(+17.8)#1,625 |
| 16. | Skykomish | 22.9% | 5.2%(+17.6)#16 | 6.0%(+16.9)#1,734 |
| 17. | Twisp | 22.8% | 5.2%(+17.6)#17 | 6.0%(+16.8)#1,736 |
| 18. | Clear Lake Cdp Pierce County | 22.1% | 5.2%(+16.9)#18 | 6.0%(+16.1)#1,836 |
| 19. | Reardan | 21.9% | 5.2%(+16.7)#19 | 6.0%(+15.9)#1,865 |
| 20. | Fairchild Afb | 21.6% | 5.2%(+16.4)#20 | 6.0%(+15.6)#1,905 |
| 21. | Brinnon | 21.4% | 5.2%(+16.2)#21 | 6.0%(+15.4)#1,947 |
| 22. | Bryant | 20.4% | 5.2%(+15.2)#22 | 6.0%(+14.4)#2,093 |
| 23. | Lind | 19.8% | 5.2%(+14.6)#23 | 6.0%(+13.8)#2,247 |
| 24. | Carlsborg | 19.6% | 5.2%(+14.4)#24 | 6.0%(+13.6)#2,268 |
| 25. | Cherry Grove | 19.4% | 5.2%(+14.2)#25 | 6.0%(+13.4)#2,314 |
| 26. | Coulee City | 19.2% | 5.2%(+14.0)#26 | 6.0%(+13.2)#2,348 |
| 27. | Bridgeport | 18.9% | 5.2%(+13.7)#27 | 6.0%(+12.9)#2,417 |
| 28. | Canyon Creek | 18.4% | 5.2%(+13.2)#28 | 6.0%(+12.4)#2,517 |
| 29. | Kittitas | 18.3% | 5.2%(+13.1)#29 | 6.0%(+12.3)#2,540 |
| 30. | Union | 18.0% | 5.2%(+12.8)#30 | 6.0%(+12.0)#2,618 |
| 31. | Cascade Valley | 17.9% | 5.2%(+12.7)#31 | 6.0%(+11.9)#2,642 |
| 32. | Newport | 17.6% | 5.2%(+12.4)#32 | 6.0%(+11.7)#2,700 |
| 33. | Tanglewilde | 17.4% | 5.2%(+12.2)#33 | 6.0%(+11.4)#2,775 |
| 34. | Kalama | 17.3% | 5.2%(+12.1)#34 | 6.0%(+11.3)#2,816 |
| 35. | Taholah | 17.1% | 5.2%(+11.9)#35 | 6.0%(+11.1)#2,850 |
| 36. | Prosser | 17.0% | 5.2%(+11.8)#36 | 6.0%(+11.0)#2,882 |
| 37. | Elma | 17.0% | 5.2%(+11.8)#37 | 6.0%(+11.0)#2,883 |
| 38. | Whidbey Island Station | 16.7% | 5.2%(+11.5)#38 | 6.0%(+10.7)#2,950 |
| 39. | Amboy | 16.4% | 5.2%(+11.2)#39 | 6.0%(+10.4)#3,102 |
| 40. | Rochester | 16.3% | 5.2%(+11.1)#40 | 6.0%(+10.3)#3,122 |
| 41. | North Yelm | 16.2% | 5.2%(+11.0)#41 | 6.0%(+10.2)#3,163 |
| 42. | Quilcene | 16.1% | 5.2%(+10.9)#42 | 6.0%(+10.1)#3,178 |
| 43. | Grand Coulee | 16.0% | 5.2%(+10.8)#43 | 6.0%(+10.0)#3,200 |
| 44. | Clover Creek | 15.9% | 5.2%(+10.7)#44 | 6.0%(+9.89)#3,254 |
| 45. | Graham | 15.6% | 5.2%(+10.4)#45 | 6.0%(+9.57)#3,361 |
| 46. | Rainier | 15.5% | 5.2%(+10.3)#46 | 6.0%(+9.48)#3,387 |
| 47. | Lake Goodwin | 15.5% | 5.2%(+10.3)#47 | 6.0%(+9.48)#3,390 |
| 48. | South Bend | 15.3% | 5.2%(+10.1)#48 | 6.0%(+9.29)#3,484 |
| 49. | Desert Aire | 15.2% | 5.2%(+10.0)#49 | 6.0%(+9.23)#3,510 |
| 50. | Green Bluff | 14.8% | 5.2%(+9.63)#50 | 6.0%(+8.84)#3,668 |
| 51. | Nooksack | 14.8% | 5.2%(+9.55)#51 | 6.0%(+8.76)#3,693 |
| 52. | Dupont | 14.8% | 5.2%(+9.54)#52 | 6.0%(+8.76)#3,698 |
| 53. | Edison | 14.6% | 5.2%(+9.39)#53 | 6.0%(+8.61)#3,761 |
| 54. | Oak Harbor | 14.4% | 5.2%(+9.17)#54 | 6.0%(+8.39)#3,847 |
| 55. | Latah | 14.3% | 5.2%(+9.07)#55 | 6.0%(+8.29)#3,930 |
| 56. | Brewster | 14.2% | 5.2%(+8.97)#56 | 6.0%(+8.18)#3,982 |
| 57. | Frederickson | 14.2% | 5.2%(+8.95)#57 | 6.0%(+8.17)#3,987 |
| 58. | Winthrop | 14.1% | 5.2%(+8.92)#58 | 6.0%(+8.13)#3,996 |
| 59. | Midland | 14.1% | 5.2%(+8.90)#59 | 6.0%(+8.12)#4,001 |
| 60. | Rosburg | 14.0% | 5.2%(+8.82)#60 | 6.0%(+8.04)#4,027 |
| 61. | Uniontown | 13.8% | 5.2%(+8.62)#61 | 6.0%(+7.83)#4,114 |
| 62. | Ephrata | 13.7% | 5.2%(+8.50)#62 | 6.0%(+7.72)#4,180 |
| 63. | Hoquiam | 13.5% | 5.2%(+8.33)#63 | 6.0%(+7.55)#4,247 |
| 64. | Sudden Valley | 13.5% | 5.2%(+8.27)#64 | 6.0%(+7.49)#4,274 |
| 65. | Davenport | 13.4% | 5.2%(+8.19)#65 | 6.0%(+7.40)#4,315 |
| 66. | Millwood | 13.1% | 5.2%(+7.94)#66 | 6.0%(+7.15)#4,478 |
| 67. | Moses Lake North | 13.0% | 5.2%(+7.79)#67 | 6.0%(+7.00)#4,560 |
| 68. | Benton City | 12.9% | 5.2%(+7.67)#68 | 6.0%(+6.89)#4,637 |
| 69. | East Wenatchee | 12.8% | 5.2%(+7.57)#69 | 6.0%(+6.79)#4,684 |
| 70. | Everson | 12.7% | 5.2%(+7.46)#70 | 6.0%(+6.67)#4,747 |
| 71. | Bethel | 12.6% | 5.2%(+7.43)#71 | 6.0%(+6.65)#4,762 |
| 72. | Elk Plain | 12.6% | 5.2%(+7.37)#72 | 6.0%(+6.59)#4,786 |
| 73. | Rockford | 12.3% | 5.2%(+7.13)#73 | 6.0%(+6.35)#4,959 |
| 74. | Dollars Corner | 12.3% | 5.2%(+7.09)#74 | 6.0%(+6.31)#4,981 |
| 75. | Othello | 12.3% | 5.2%(+7.07)#75 | 6.0%(+6.29)#5,000 |
| 76. | Startup | 12.2% | 5.2%(+6.96)#76 | 6.0%(+6.18)#5,070 |
| 77. | Carson | 12.1% | 5.2%(+6.87)#77 | 6.0%(+6.09)#5,132 |
| 78. | Lake Ketchum | 12.0% | 5.2%(+6.79)#78 | 6.0%(+6.00)#5,190 |
| 79. | Bangor Base | 11.9% | 5.2%(+6.74)#79 | 6.0%(+5.95)#5,230 |
| 80. | Summit View | 11.8% | 5.2%(+6.62)#80 | 6.0%(+5.84)#5,313 |
| 81. | Mcchord Afb | 11.8% | 5.2%(+6.55)#81 | 6.0%(+5.77)#5,346 |
| 82. | Keller | 11.8% | 5.2%(+6.55)#82 | 6.0%(+5.77)#5,378 |
| 83. | Napavine | 11.7% | 5.2%(+6.50)#83 | 6.0%(+5.72)#5,418 |
| 84. | Oakville | 11.7% | 5.2%(+6.45)#84 | 6.0%(+5.67)#5,444 |
| 85. | Southworth | 11.6% | 5.2%(+6.41)#85 | 6.0%(+5.62)#5,464 |
| 86. | Raymond | 11.6% | 5.2%(+6.38)#86 | 6.0%(+5.60)#5,486 |
| 87. | Eatonville | 11.6% | 5.2%(+6.37)#87 | 6.0%(+5.58)#5,491 |
| 88. | Washtucna | 11.5% | 5.2%(+6.33)#88 | 6.0%(+5.54)#5,534 |
| 89. | Toppenish | 11.5% | 5.2%(+6.31)#89 | 6.0%(+5.53)#5,547 |
| 90. | Malone | 11.5% | 5.2%(+6.28)#90 | 6.0%(+5.50)#5,565 |
| 91. | Pacific | 11.3% | 5.2%(+6.13)#91 | 6.0%(+5.34)#5,671 |
| 92. | Forks | 11.2% | 5.2%(+5.94)#92 | 6.0%(+5.16)#5,784 |
| 93. | Hansville | 11.1% | 5.2%(+5.94)#93 | 6.0%(+5.15)#5,785 |
| 94. | Fife Heights | 11.1% | 5.2%(+5.93)#94 | 6.0%(+5.15)#5,790 |
| 95. | Sunnyside | 11.1% | 5.2%(+5.89)#95 | 6.0%(+5.10)#5,888 |
| 96. | Okanogan | 11.1% | 5.2%(+5.87)#96 | 6.0%(+5.09)#5,892 |
| 97. | Chain Lake | 11.0% | 5.2%(+5.82)#97 | 6.0%(+5.04)#5,918 |
| 98. | Deer Park | 10.9% | 5.2%(+5.73)#98 | 6.0%(+4.95)#5,981 |
| 99. | Mansfield | 10.9% | 5.2%(+5.70)#99 | 6.0%(+4.91)#6,006 |
| 100. | Castle Rock | 10.8% | 5.2%(+5.58)#100 | 6.0%(+4.79)#6,100 |
Common Questions
What are the Top 10 Cities with the Highest Percentage of Population with a Degree in Arts and Humanities in Washington?
Top 10 Cities with the Highest Percentage of Population with a Degree in Arts and Humanities in Washington are:
#1
100.0%
#2
77.3%
#3
47.4%
#4
41.5%
#5
40.7%
#6
33.9%
#7
33.0%
#8
29.8%
#9
26.4%
#10
25.0%
What city has the Highest Percentage of Population with a Degree in Arts and Humanities in Washington?
Hatton has the Highest Percentage of Population with a Degree in Arts and Humanities in Washington with 100.0%.
What is the Percentage of Population with a Degree in Arts and Humanities in the State of Washington?
Percentage of Population with a Degree in Arts and Humanities in Washington is 5.2%.
What is the Percentage of Population with a Degree in Arts and Humanities in the United States?
Percentage of Population with a Degree in Arts and Humanities in the United States is 6.0%.