Glacier, WA Map & Demographics
Glacier Map
Glacier Overview
$24,057
PER CAPITA INCOME
$30,714
AVG HOUSEHOLD INCOME
0.47
INEQUALITY / GINI INDEX
241
TOTAL POPULATION
168
MALE POPULATION
73
FEMALE POPULATION
230.14
MALES / 100 FEMALES
43.45
FEMALES / 100 MALES
44.2
MEDIAN AGE
2.1
AVG FAMILY SIZE
2.0
AVG HOUSEHOLD SIZE
219
LABOR FORCE [ PEOPLE ]
90.9%
PERCENT IN LABOR FORCE
Income in Glacier
Income Overview in Glacier
| Characteristic | Number | Measure |
| Per Capita Income | 241 | $24,057 |
| Median Family Income | 60 | $0 |
| Mean Family Income | 60 | $0 |
| Median Household Income | 118 | $30,714 |
| Mean Household Income | 118 | $49,338 |
| Income Deficit | 60 | $0 |
| Wage / Income Gap (%) | 241 | 0.00% |
| Wage / Income Gap ($) | 241 | 100.00¢ per $1 |
| Gini / Inequality Index | 241 | 0.47 |
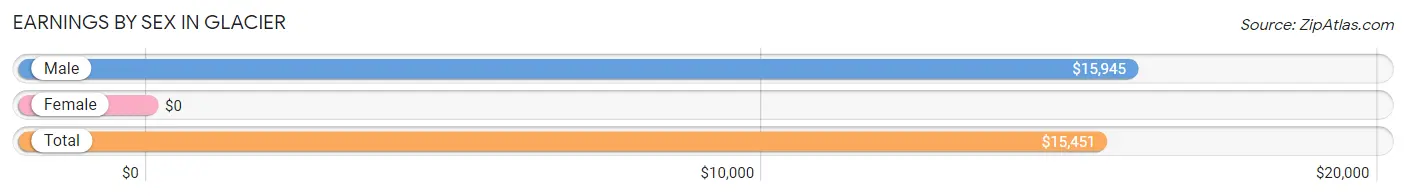
Earnings by Sex in Glacier
| Sex | Number | Average Earnings |
| Male | 153 (69.9%) | $15,945 |
| Female | 66 (30.1%) | $0 |
| Total | 219 (100.0%) | $15,451 |
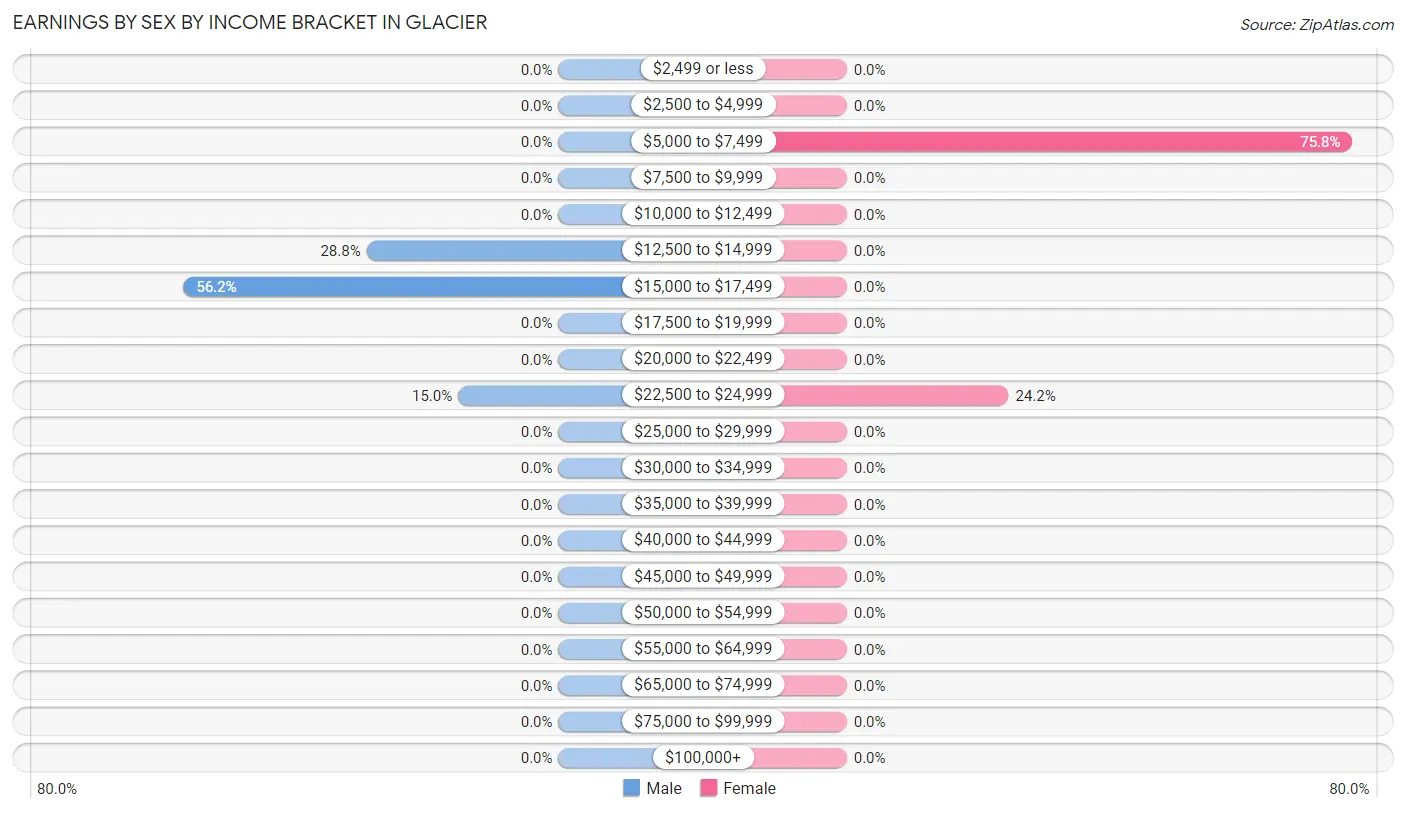
Earnings by Sex by Income Bracket in Glacier
The most common earnings brackets in Glacier are $15,000 to $17,499 for men (86 | 56.2%) and $5,000 to $7,499 for women (50 | 75.8%).
| Income | Male | Female |
| $2,499 or less | 0 (0.0%) | 0 (0.0%) |
| $2,500 to $4,999 | 0 (0.0%) | 0 (0.0%) |
| $5,000 to $7,499 | 0 (0.0%) | 50 (75.8%) |
| $7,500 to $9,999 | 0 (0.0%) | 0 (0.0%) |
| $10,000 to $12,499 | 0 (0.0%) | 0 (0.0%) |
| $12,500 to $14,999 | 44 (28.8%) | 0 (0.0%) |
| $15,000 to $17,499 | 86 (56.2%) | 0 (0.0%) |
| $17,500 to $19,999 | 0 (0.0%) | 0 (0.0%) |
| $20,000 to $22,499 | 0 (0.0%) | 0 (0.0%) |
| $22,500 to $24,999 | 23 (15.0%) | 16 (24.2%) |
| $25,000 to $29,999 | 0 (0.0%) | 0 (0.0%) |
| $30,000 to $34,999 | 0 (0.0%) | 0 (0.0%) |
| $35,000 to $39,999 | 0 (0.0%) | 0 (0.0%) |
| $40,000 to $44,999 | 0 (0.0%) | 0 (0.0%) |
| $45,000 to $49,999 | 0 (0.0%) | 0 (0.0%) |
| $50,000 to $54,999 | 0 (0.0%) | 0 (0.0%) |
| $55,000 to $64,999 | 0 (0.0%) | 0 (0.0%) |
| $65,000 to $74,999 | 0 (0.0%) | 0 (0.0%) |
| $75,000 to $99,999 | 0 (0.0%) | 0 (0.0%) |
| $100,000+ | 0 (0.0%) | 0 (0.0%) |
| Total | 153 (100.0%) | 66 (100.0%) |
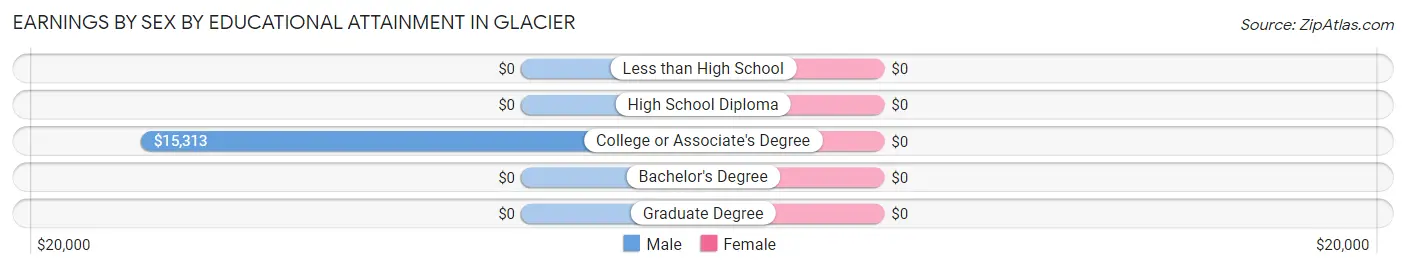
Earnings by Sex by Educational Attainment in Glacier
| Educational Attainment | Male Income | Female Income |
| Less than High School | - | - |
| High School Diploma | - | - |
| College or Associate's Degree | $15,313 | $0 |
| Bachelor's Degree | - | - |
| Graduate Degree | - | - |
| Total | $15,945 | $0 |
Family Income in Glacier
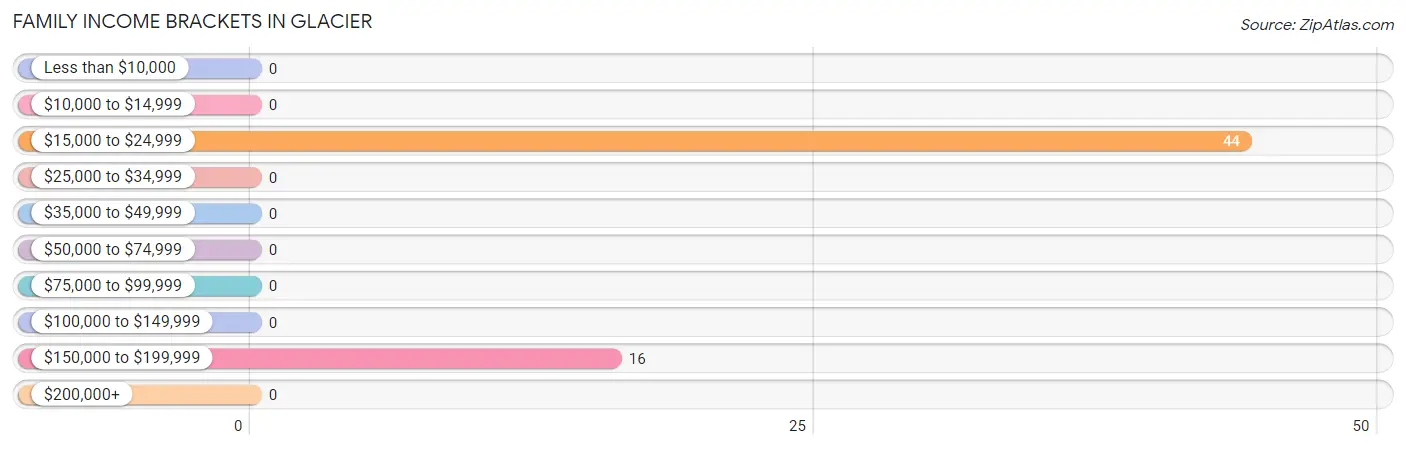
Family Income Brackets in Glacier
According to the Glacier family income data, there are 44 families falling into the $15,000 to $24,999 income range, which is the most common income bracket and makes up 73.3% of all families.
| Income Bracket | # Families | % Families |
| Less than $10,000 | 0 | 0.0% |
| $10,000 to $14,999 | 0 | 0.0% |
| $15,000 to $24,999 | 44 | 73.3% |
| $25,000 to $34,999 | 0 | 0.0% |
| $35,000 to $49,999 | 0 | 0.0% |
| $50,000 to $74,999 | 0 | 0.0% |
| $75,000 to $99,999 | 0 | 0.0% |
| $100,000 to $149,999 | 0 | 0.0% |
| $150,000 to $199,999 | 16 | 26.7% |
| $200,000+ | 0 | 0.0% |
Family Income by Famaliy Size in Glacier
| Income Bracket | # Families | Median Income |
| 2-Person Families | 60 (100.0%) | $0 |
| 3-Person Families | 0 (0.0%) | $0 |
| 4-Person Families | 0 (0.0%) | $0 |
| 5-Person Families | 0 (0.0%) | $0 |
| 6-Person Families | 0 (0.0%) | $0 |
| 7+ Person Families | 0 (0.0%) | $0 |
| Total | 60 (100.0%) | $0 |
Family Income by Number of Earners in Glacier
| Number of Earners | # Families | Median Income |
| No Earners | 0 (0.0%) | $0 |
| 1 Earner | 16 (26.7%) | $0 |
| 2 Earners | 44 (73.3%) | $0 |
| 3+ Earners | 0 (0.0%) | $0 |
| Total | 60 (100.0%) | $0 |
Household Income in Glacier
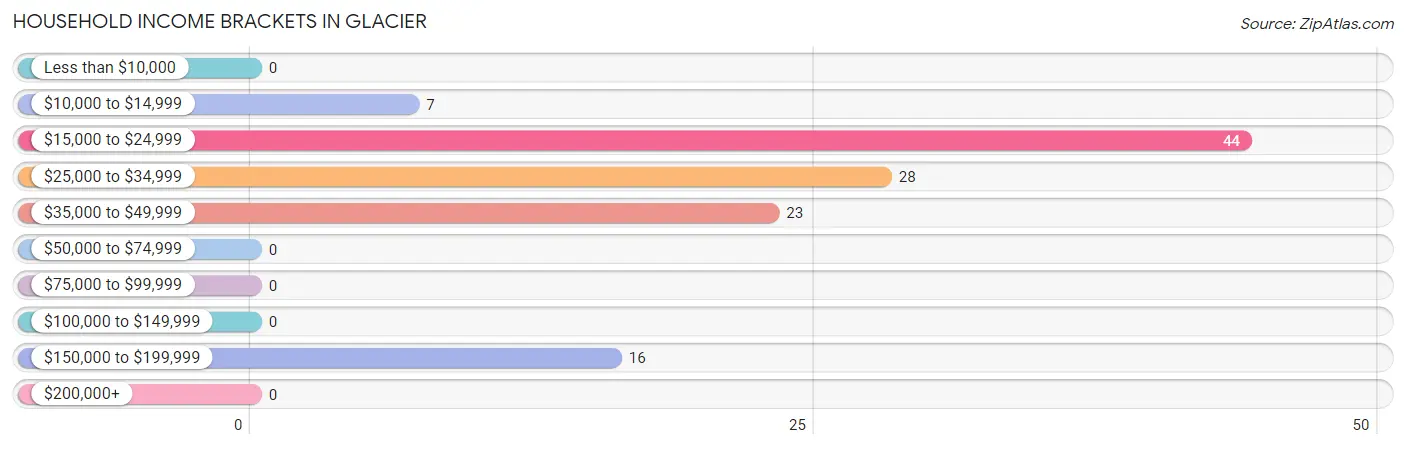
Household Income Brackets in Glacier
With 44 households falling in the category, the $15,000 to $24,999 income range is the most frequent in Glacier, accounting for 37.3% of all households.
| Income Bracket | # Households | % Households |
| Less than $10,000 | 0 | 0.0% |
| $10,000 to $14,999 | 7 | 5.9% |
| $15,000 to $24,999 | 44 | 37.3% |
| $25,000 to $34,999 | 28 | 23.7% |
| $35,000 to $49,999 | 23 | 19.5% |
| $50,000 to $74,999 | 0 | 0.0% |
| $75,000 to $99,999 | 0 | 0.0% |
| $100,000 to $149,999 | 0 | 0.0% |
| $150,000 to $199,999 | 16 | 13.6% |
| $200,000+ | 0 | 0.0% |
Household Income by Householder Age in Glacier
| Income Bracket | # Households | Median Income |
| 15 to 24 Years | 0 (0.0%) | $0 |
| 25 to 44 Years | 51 (43.2%) | $0 |
| 45 to 64 Years | 44 (37.3%) | $0 |
| 65+ Years | 23 (19.5%) | $0 |
| Total | 118 (100.0%) | $30,714 |
Poverty in Glacier
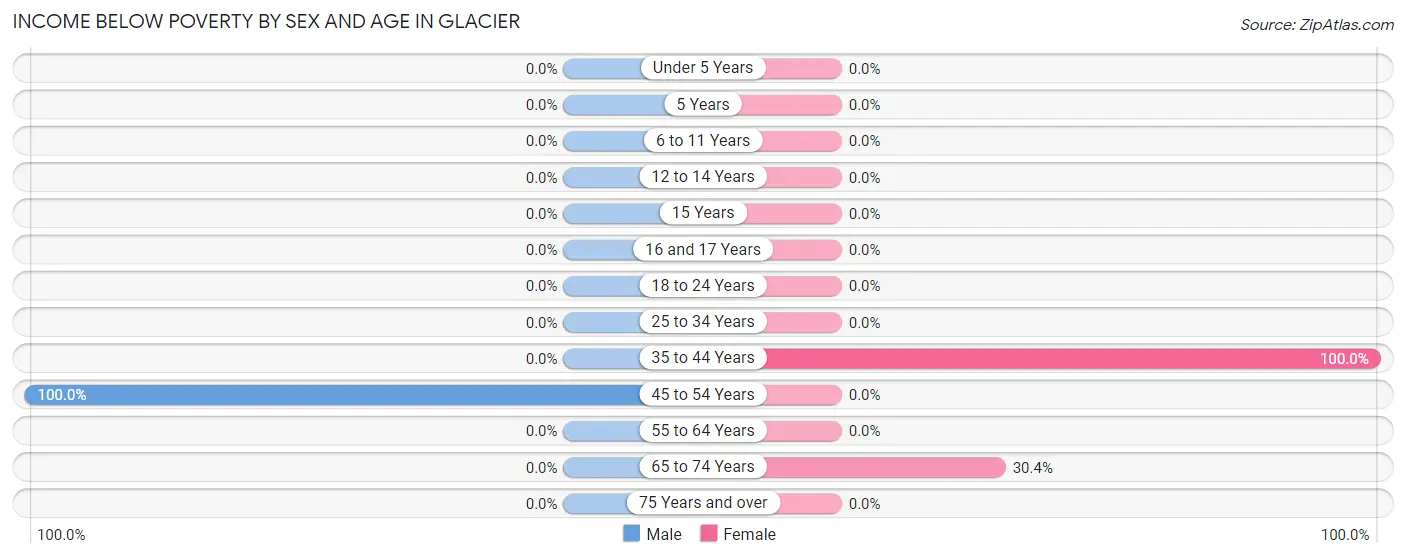
Income Below Poverty by Sex and Age in Glacier
With 26.2% poverty level for males and 78.1% for females among the residents of Glacier, 45 to 54 year old males and 35 to 44 year old females are the most vulnerable to poverty, with 44 males (100.0%) and 50 females (100.0%) in their respective age groups living below the poverty level.
| Age Bracket | Male | Female |
| Under 5 Years | 0 (0.0%) | 0 (0.0%) |
| 5 Years | 0 (0.0%) | 0 (0.0%) |
| 6 to 11 Years | 0 (0.0%) | 0 (0.0%) |
| 12 to 14 Years | 0 (0.0%) | 0 (0.0%) |
| 15 Years | 0 (0.0%) | 0 (0.0%) |
| 16 and 17 Years | 0 (0.0%) | 0 (0.0%) |
| 18 to 24 Years | 0 (0.0%) | 0 (0.0%) |
| 25 to 34 Years | 0 (0.0%) | 0 (0.0%) |
| 35 to 44 Years | 0 (0.0%) | 50 (100.0%) |
| 45 to 54 Years | 44 (100.0%) | 0 (0.0%) |
| 55 to 64 Years | 0 (0.0%) | 0 (0.0%) |
| 65 to 74 Years | 0 (0.0%) | 7 (30.4%) |
| 75 Years and over | 0 (0.0%) | 0 (0.0%) |
| Total | 44 (26.2%) | 57 (78.1%) |
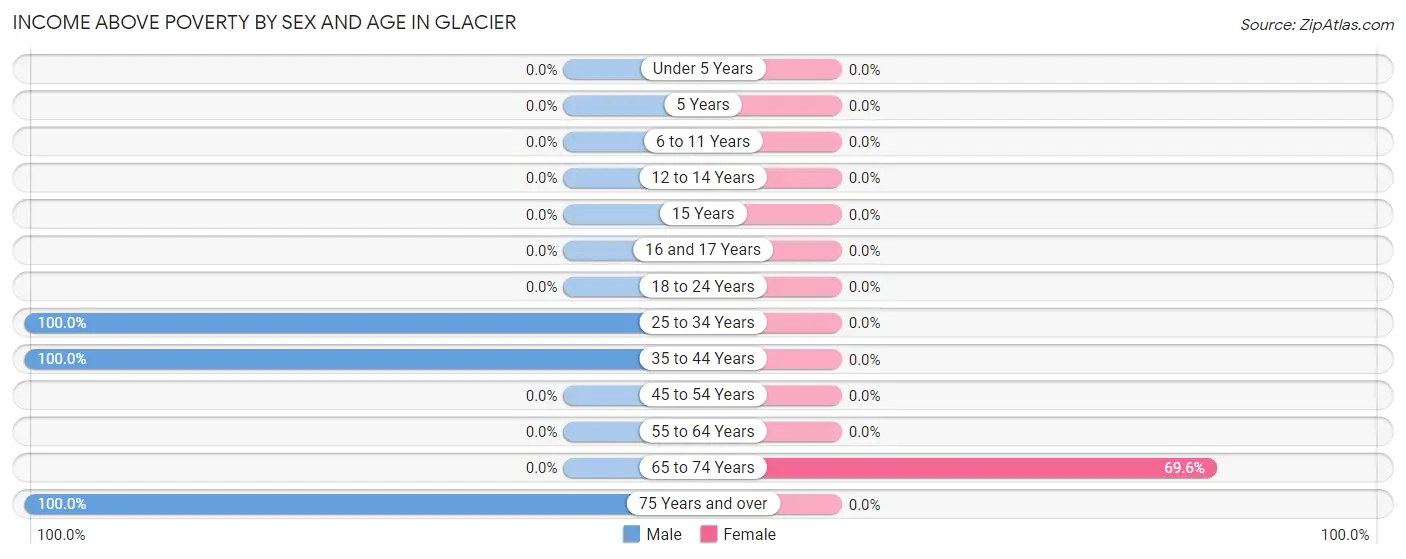
Income Above Poverty by Sex and Age in Glacier
According to the poverty statistics in Glacier, males aged 25 to 34 years and females aged 65 to 74 years are the age groups that are most secure financially, with 100.0% of males and 69.6% of females in these age groups living above the poverty line.
| Age Bracket | Male | Female |
| Under 5 Years | 0 (0.0%) | 0 (0.0%) |
| 5 Years | 0 (0.0%) | 0 (0.0%) |
| 6 to 11 Years | 0 (0.0%) | 0 (0.0%) |
| 12 to 14 Years | 0 (0.0%) | 0 (0.0%) |
| 15 Years | 0 (0.0%) | 0 (0.0%) |
| 16 and 17 Years | 0 (0.0%) | 0 (0.0%) |
| 18 to 24 Years | 0 (0.0%) | 0 (0.0%) |
| 25 to 34 Years | 87 (100.0%) | 0 (0.0%) |
| 35 to 44 Years | 22 (100.0%) | 0 (0.0%) |
| 45 to 54 Years | 0 (0.0%) | 0 (0.0%) |
| 55 to 64 Years | 0 (0.0%) | 0 (0.0%) |
| 65 to 74 Years | 0 (0.0%) | 16 (69.6%) |
| 75 Years and over | 15 (100.0%) | 0 (0.0%) |
| Total | 124 (73.8%) | 16 (21.9%) |
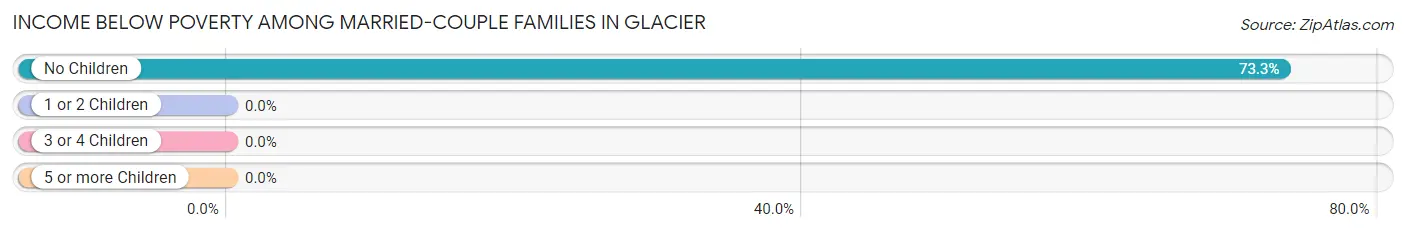
Income Below Poverty Among Married-Couple Families in Glacier
The poverty statistics for married-couple families in Glacier show that 73.3% or 44 of the total 60 families live below the poverty line. Families with no children have the highest poverty rate of 73.3%, comprising of 44 families. On the other hand, families with no children have the lowest poverty rate of 73.3%, which includes 44 families.
| Children | Above Poverty | Below Poverty |
| No Children | 16 (26.7%) | 44 (73.3%) |
| 1 or 2 Children | 0 (0.0%) | 0 (0.0%) |
| 3 or 4 Children | 0 (0.0%) | 0 (0.0%) |
| 5 or more Children | 0 (0.0%) | 0 (0.0%) |
| Total | 16 (26.7%) | 44 (73.3%) |
Income Below Poverty Among Single-Parent Households in Glacier
| Children | Single Father | Single Mother |
| No Children | 0 (0.0%) | 0 (0.0%) |
| 1 or 2 Children | 0 (0.0%) | 0 (0.0%) |
| 3 or 4 Children | 0 (0.0%) | 0 (0.0%) |
| 5 or more Children | 0 (0.0%) | 0 (0.0%) |
| Total | 0 (0.0%) | 0 (0.0%) |
Income Below Poverty Among Married-Couple vs Single-Parent Households in Glacier
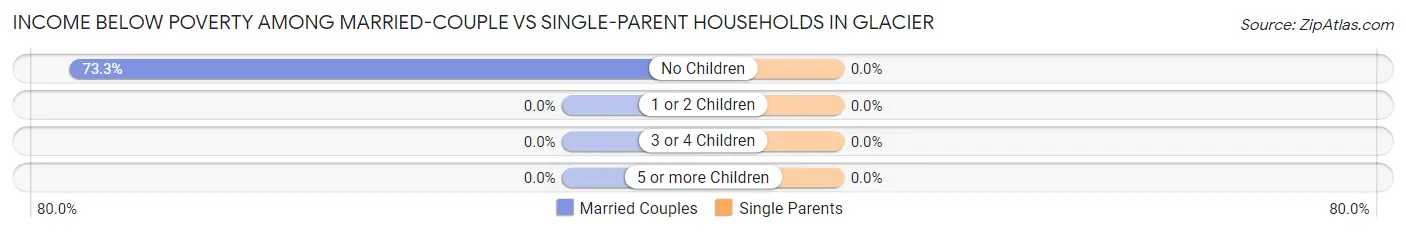
| Children | Married-Couple Families | Single-Parent Households |
| No Children | 44 (73.3%) | 0 (0.0%) |
| 1 or 2 Children | 0 (0.0%) | 0 (0.0%) |
| 3 or 4 Children | 0 (0.0%) | 0 (0.0%) |
| 5 or more Children | 0 (0.0%) | 0 (0.0%) |
| Total | 44 (73.3%) | 0 (0.0%) |
Race in Glacier
The most populous races in Glacier are White / Caucasian (197 | 81.7%), and Two or more Races (44 | 18.3%).
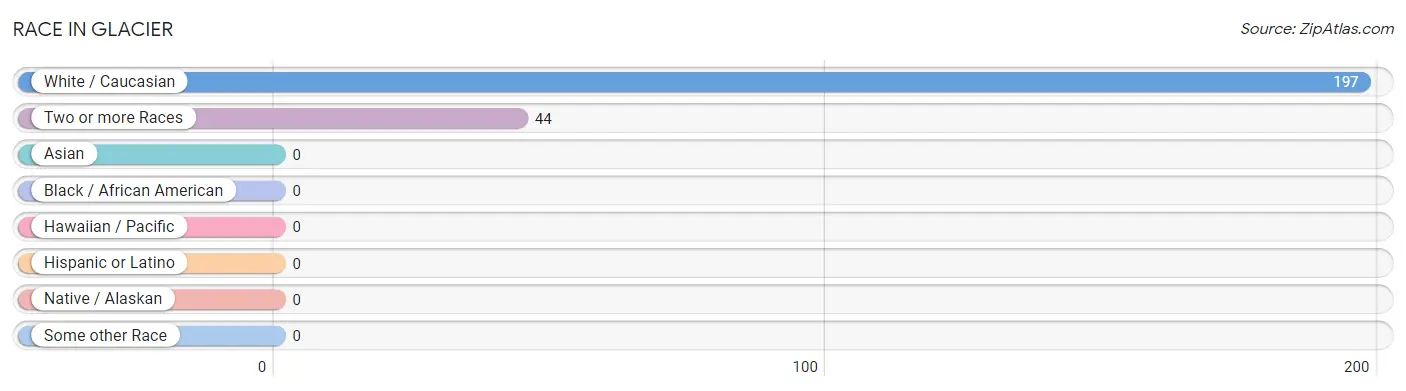
| Race | # Population | % Population |
| Asian | 0 | 0.0% |
| Black / African American | 0 | 0.0% |
| Hawaiian / Pacific | 0 | 0.0% |
| Hispanic or Latino | 0 | 0.0% |
| Native / Alaskan | 0 | 0.0% |
| White / Caucasian | 197 | 81.7% |
| Two or more Races | 44 | 18.3% |
| Some other Race | 0 | 0.0% |
| Total | 241 | 100.0% |
Ancestry in Glacier
The most populous ancestries reported in Glacier are Italian (73 | 30.3%), Arab (44 | 18.3%), Australian (44 | 18.3%), Egyptian (44 | 18.3%), and German (30 | 12.4%), together accounting for 97.5% of all Glacier residents.
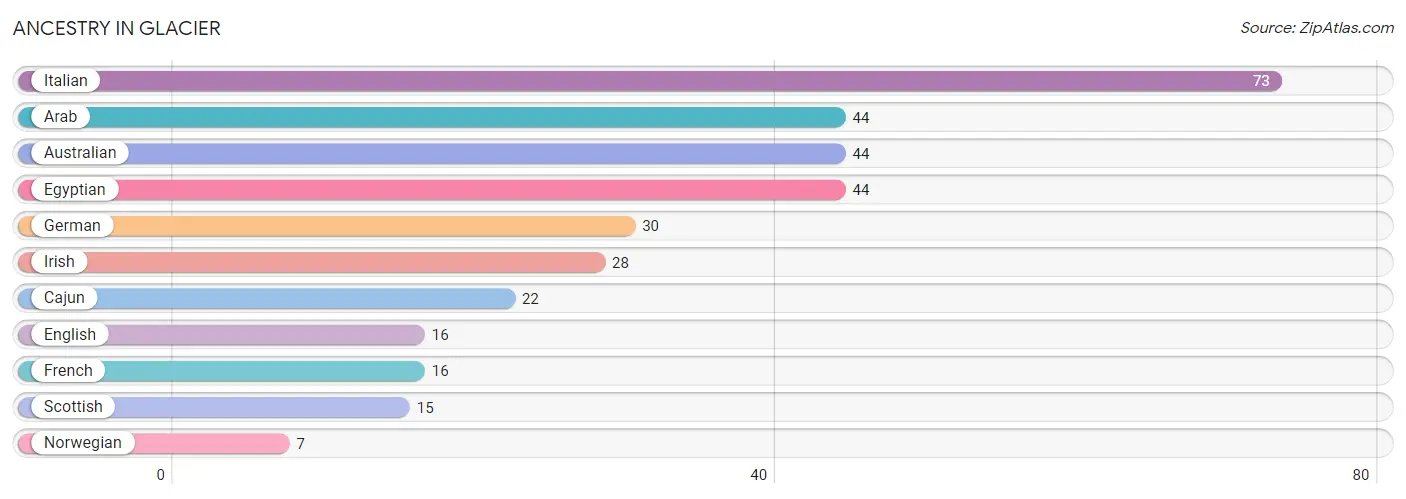
| Ancestry | # Population | % Population |
| Arab | 44 | 18.3% |
| Australian | 44 | 18.3% |
| Cajun | 22 | 9.1% |
| Egyptian | 44 | 18.3% |
| English | 16 | 6.6% |
| French | 16 | 6.6% |
| German | 30 | 12.4% |
| Irish | 28 | 11.6% |
| Italian | 73 | 30.3% |
| Norwegian | 7 | 2.9% |
| Scottish | 15 | 6.2% | View All 11 Rows |
Immigrants in Glacier
The most numerous immigrant groups reported in Glacier came from , and Canada (50 | 20.7%), together accounting for 20.7% of all Glacier residents.

| Immigration Origin | # Population | % Population |
| Canada | 50 | 20.7% | View All 1 Rows |
Sex and Age in Glacier
Sex and Age in Glacier
The most populous age groups in Glacier are 25 to 29 Years (59 | 35.1%) for men and 40 to 44 Years (50 | 68.5%) for women.
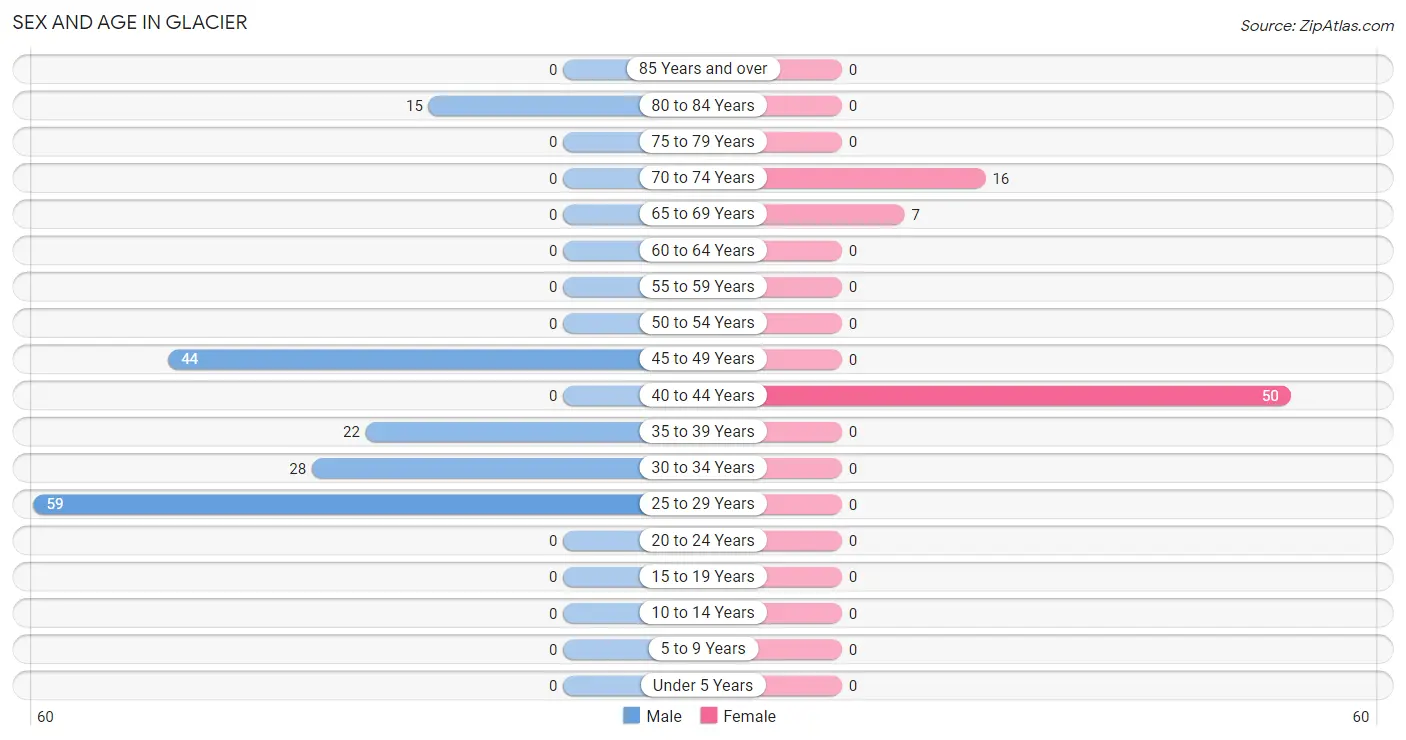
| Age Bracket | Male | Female |
| Under 5 Years | 0 (0.0%) | 0 (0.0%) |
| 5 to 9 Years | 0 (0.0%) | 0 (0.0%) |
| 10 to 14 Years | 0 (0.0%) | 0 (0.0%) |
| 15 to 19 Years | 0 (0.0%) | 0 (0.0%) |
| 20 to 24 Years | 0 (0.0%) | 0 (0.0%) |
| 25 to 29 Years | 59 (35.1%) | 0 (0.0%) |
| 30 to 34 Years | 28 (16.7%) | 0 (0.0%) |
| 35 to 39 Years | 22 (13.1%) | 0 (0.0%) |
| 40 to 44 Years | 0 (0.0%) | 50 (68.5%) |
| 45 to 49 Years | 44 (26.2%) | 0 (0.0%) |
| 50 to 54 Years | 0 (0.0%) | 0 (0.0%) |
| 55 to 59 Years | 0 (0.0%) | 0 (0.0%) |
| 60 to 64 Years | 0 (0.0%) | 0 (0.0%) |
| 65 to 69 Years | 0 (0.0%) | 7 (9.6%) |
| 70 to 74 Years | 0 (0.0%) | 16 (21.9%) |
| 75 to 79 Years | 0 (0.0%) | 0 (0.0%) |
| 80 to 84 Years | 15 (8.9%) | 0 (0.0%) |
| 85 Years and over | 0 (0.0%) | 0 (0.0%) |
| Total | 168 (100.0%) | 73 (100.0%) |
Families and Households in Glacier
Median Family Size in Glacier
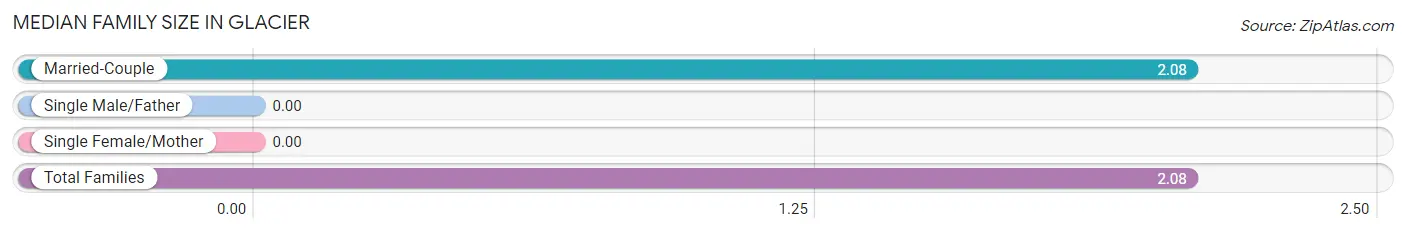
| Family Type | # Families | Family Size |
| Married-Couple | 60 (100.0%) | 2.08 |
| Single Male/Father | 0 (0.0%) | - |
| Single Female/Mother | 0 (0.0%) | - |
| Total Families | 60 (100.0%) | 2.08 |
Median Household Size in Glacier
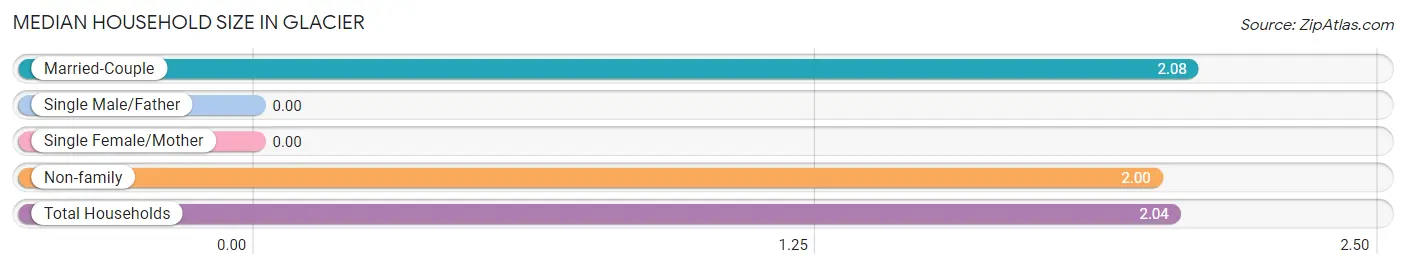
| Household Type | # Households | Household Size |
| Married-Couple | 60 (50.8%) | 2.08 |
| Single Male/Father | 0 (0.0%) | - |
| Single Female/Mother | 0 (0.0%) | - |
| Non-family | 58 (49.1%) | 2.00 |
| Total Households | 118 (100.0%) | 2.04 |
Household Size by Marriage Status in Glacier
Out of a total of 118 households in Glacier, 60 (50.8%) are family households, while 58 (49.1%) are nonfamily households. The most numerous type of family households are 2-person households, comprising 60, and the most common type of nonfamily households are 2-person households, comprising 51.
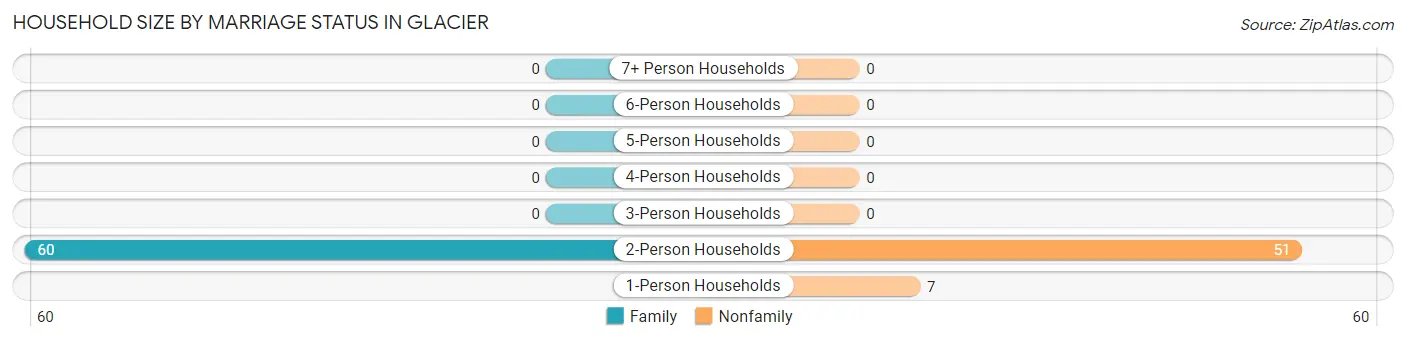
| Household Size | Family Households | Nonfamily Households |
| 1-Person Households | - | 7 (5.9%) |
| 2-Person Households | 60 (50.8%) | 51 (43.2%) |
| 3-Person Households | 0 (0.0%) | 0 (0.0%) |
| 4-Person Households | 0 (0.0%) | 0 (0.0%) |
| 5-Person Households | 0 (0.0%) | 0 (0.0%) |
| 6-Person Households | 0 (0.0%) | 0 (0.0%) |
| 7+ Person Households | 0 (0.0%) | 0 (0.0%) |
| Total | 60 (50.8%) | 58 (49.1%) |
Female Fertility in Glacier
Fertility by Age in Glacier
| Age Bracket | Women with Births | Births / 1,000 Women |
| 15 to 19 years | 0 (0.0%) | 0.0 |
| 20 to 34 years | 0 (0.0%) | 0.0 |
| 35 to 50 years | 0 (0.0%) | 0.0 |
| Total | 0 (0.0%) | 0.0 |
Fertility by Age by Marriage Status in Glacier
| Age Bracket | Married | Unmarried |
| 15 to 19 years | 0 (0.0%) | 0 (0.0%) |
| 20 to 34 years | 0 (0.0%) | 0 (0.0%) |
| 35 to 50 years | 0 (0.0%) | 0 (0.0%) |
| Total | 0 (0.0%) | 0 (0.0%) |
Fertility by Education in Glacier
| Educational Attainment | Women with Births | Births / 1,000 Women |
| Less than High School | 0 (0.0%) | 0.0 |
| High School Diploma | 0 (0.0%) | 0.0 |
| College or Associate's Degree | 0 (0.0%) | 0.0 |
| Bachelor's Degree | 0 (0.0%) | 0.0 |
| Graduate Degree | 0 (0.0%) | 0.0 |
| Total | 0 (0.0%) | 0.0 |
Fertility by Education by Marriage Status in Glacier
| Educational Attainment | Married | Unmarried |
| Less than High School | 0 (0.0%) | 0 (0.0%) |
| High School Diploma | 0 (0.0%) | 0 (0.0%) |
| College or Associate's Degree | 0 (0.0%) | 0 (0.0%) |
| Bachelor's Degree | 0 (0.0%) | 0 (0.0%) |
| Graduate Degree | 0 (0.0%) | 0 (0.0%) |
| Total | 0 (0.0%) | 0 (0.0%) |
Employment Characteristics in Glacier
Employment by Class of Employer in Glacier
Among the 219 employed individuals in Glacier, private company employees (109 | 49.8%), self-employed (not incorporated) (60 | 27.4%), and not-for-profit organizations (50 | 22.8%) make up the most common classes of employment.
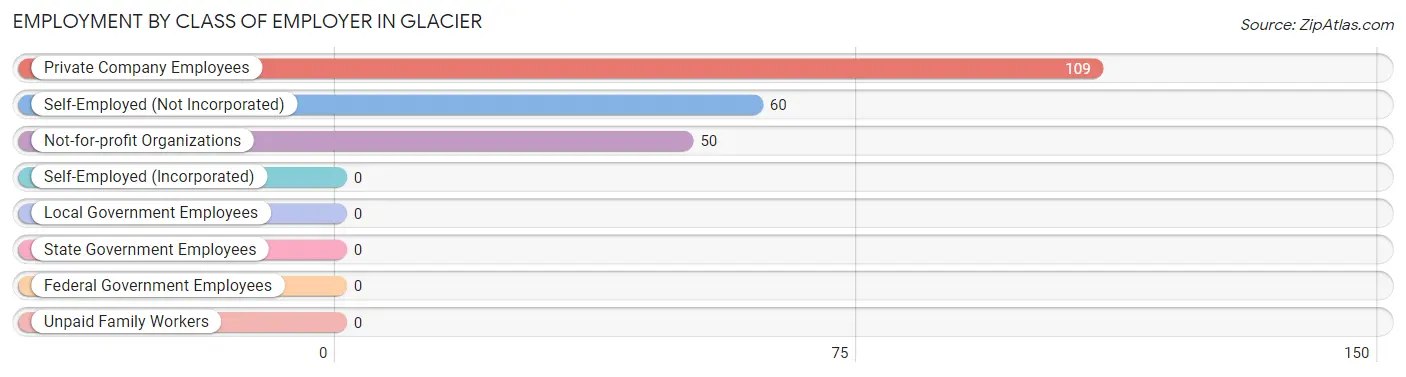
| Employer Class | # Employees | % Employees |
| Private Company Employees | 109 | 49.8% |
| Self-Employed (Incorporated) | 0 | 0.0% |
| Self-Employed (Not Incorporated) | 60 | 27.4% |
| Not-for-profit Organizations | 50 | 22.8% |
| Local Government Employees | 0 | 0.0% |
| State Government Employees | 0 | 0.0% |
| Federal Government Employees | 0 | 0.0% |
| Unpaid Family Workers | 0 | 0.0% |
| Total | 219 | 100.0% |
Employment Status by Age in Glacier
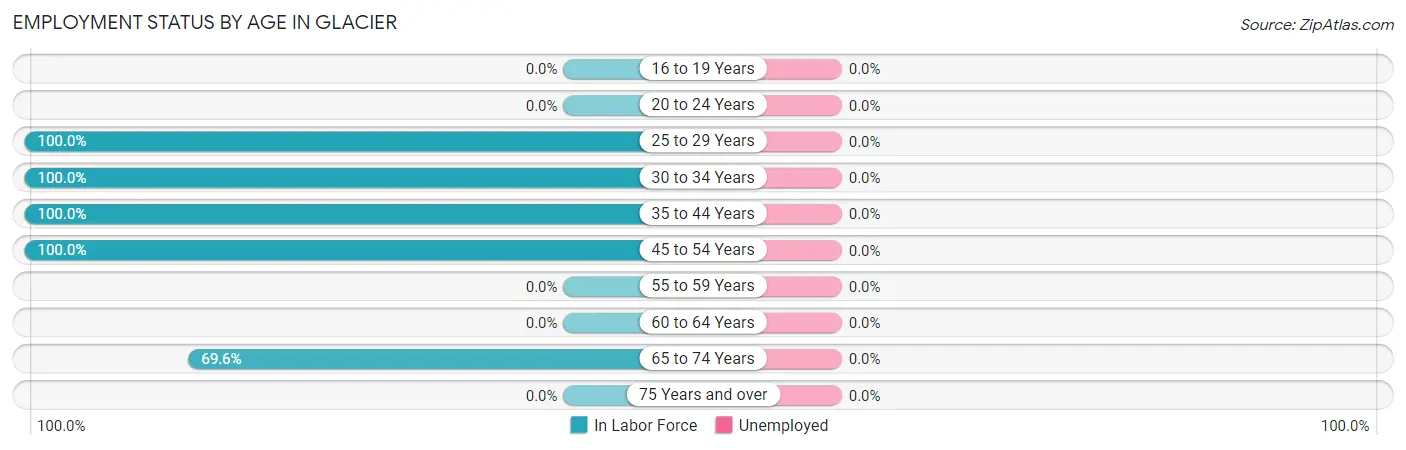
| Age Bracket | In Labor Force | Unemployed |
| 16 to 19 Years | 0 (0.0%) | 0 (0.0%) |
| 20 to 24 Years | 0 (0.0%) | 0 (0.0%) |
| 25 to 29 Years | 59 (100.0%) | 0 (0.0%) |
| 30 to 34 Years | 28 (100.0%) | 0 (0.0%) |
| 35 to 44 Years | 72 (100.0%) | 0 (0.0%) |
| 45 to 54 Years | 44 (100.0%) | 0 (0.0%) |
| 55 to 59 Years | 0 (0.0%) | 0 (0.0%) |
| 60 to 64 Years | 0 (0.0%) | 0 (0.0%) |
| 65 to 74 Years | 16 (69.6%) | 0 (0.0%) |
| 75 Years and over | 0 (0.0%) | 0 (0.0%) |
| Total | 219 (90.9%) | 0 (0.0%) |
Employment Status by Educational Attainment in Glacier
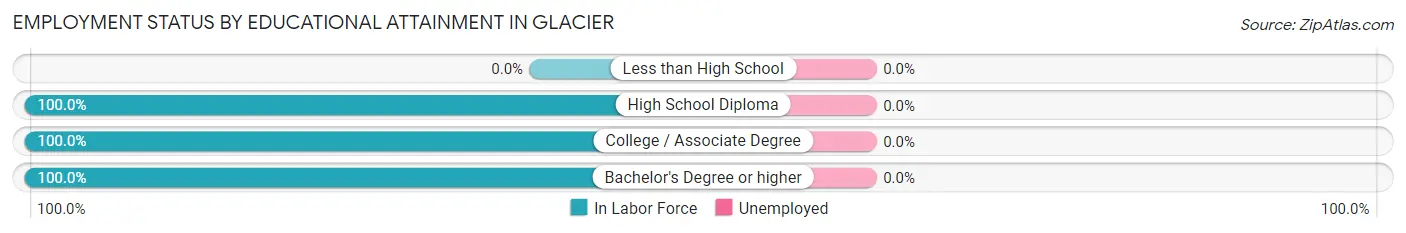
| Educational Attainment | In Labor Force | Unemployed |
| Less than High School | 0 (0.0%) | 0 (0.0%) |
| High School Diploma | 58 (100.0%) | 0 (0.0%) |
| College / Associate Degree | 95 (100.0%) | 0 (0.0%) |
| Bachelor's Degree or higher | 50 (100.0%) | 0 (0.0%) |
| Total | 203 (100.0%) | 0 (0.0%) |
Employment Occupations by Sex in Glacier
Management, Business, Science and Arts Occupations
The most common Management, Business, Science and Arts occupations in Glacier are Community & Social Service (50 | 22.8%), and Arts, Media & Entertainment (50 | 22.8%).
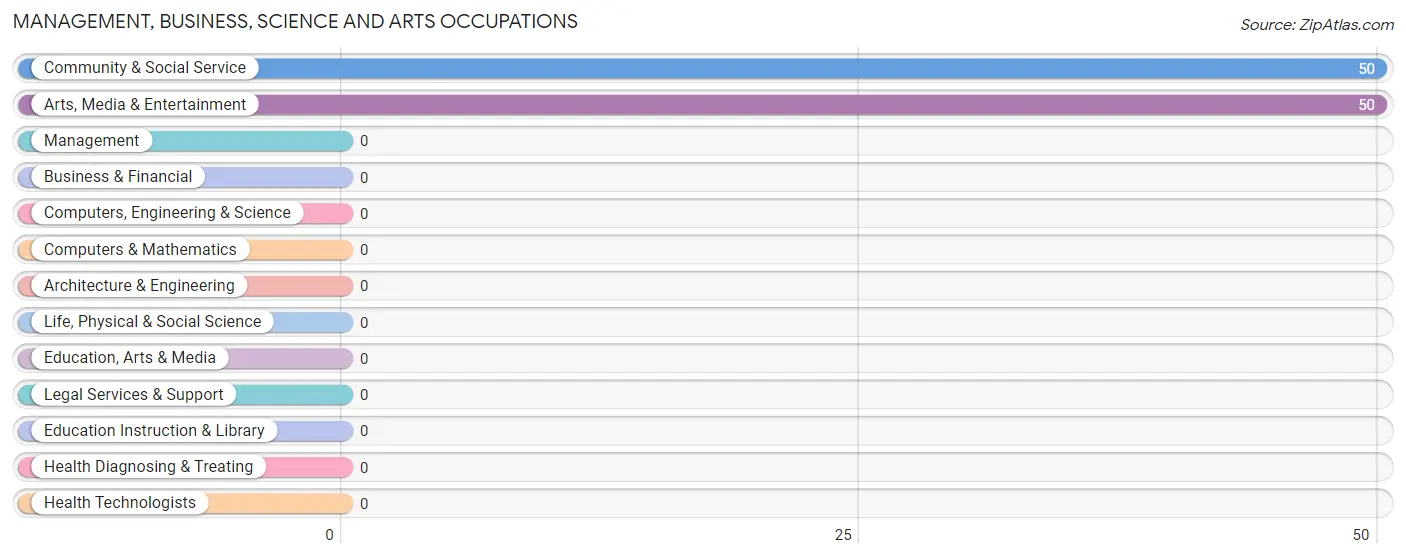
Management, Business, Science and Arts Occupations by Sex
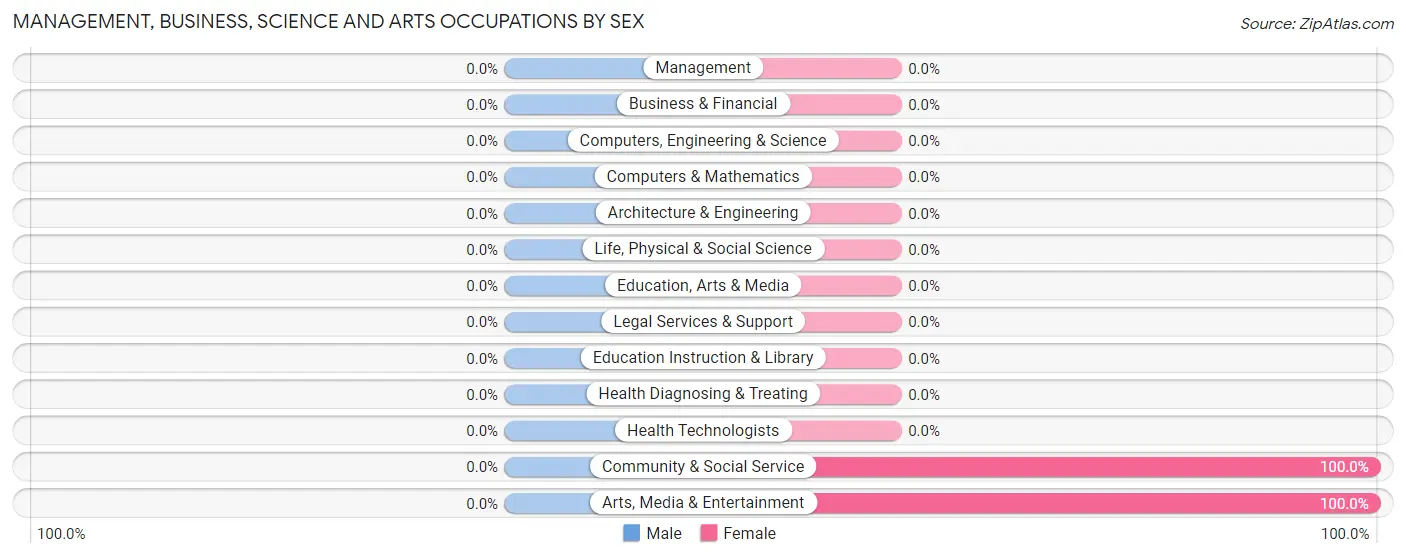
| Occupation | Male | Female |
| Management | 0 (0.0%) | 0 (0.0%) |
| Business & Financial | 0 (0.0%) | 0 (0.0%) |
| Computers, Engineering & Science | 0 (0.0%) | 0 (0.0%) |
| Computers & Mathematics | 0 (0.0%) | 0 (0.0%) |
| Architecture & Engineering | 0 (0.0%) | 0 (0.0%) |
| Life, Physical & Social Science | 0 (0.0%) | 0 (0.0%) |
| Community & Social Service | 0 (0.0%) | 50 (100.0%) |
| Education, Arts & Media | 0 (0.0%) | 0 (0.0%) |
| Legal Services & Support | 0 (0.0%) | 0 (0.0%) |
| Education Instruction & Library | 0 (0.0%) | 0 (0.0%) |
| Arts, Media & Entertainment | 0 (0.0%) | 50 (100.0%) |
| Health Diagnosing & Treating | 0 (0.0%) | 0 (0.0%) |
| Health Technologists | 0 (0.0%) | 0 (0.0%) |
| Total (Category) | 0 (0.0%) | 50 (100.0%) |
| Total (Overall) | 153 (69.9%) | 66 (30.1%) |
Services Occupations
The most common Services occupations in Glacier are Food Preparation & Serving (87 | 39.7%), and Cleaning & Maintenance (22 | 10.1%).
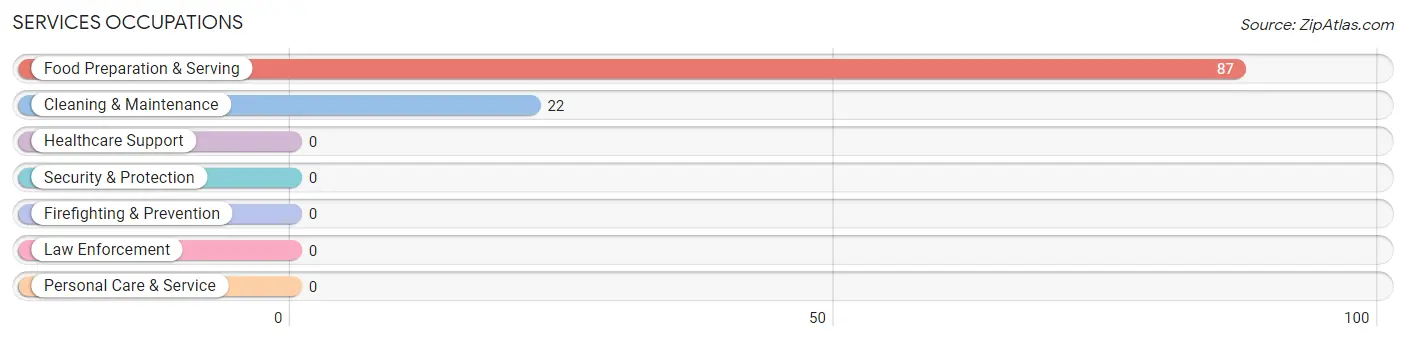
Services Occupations by Sex
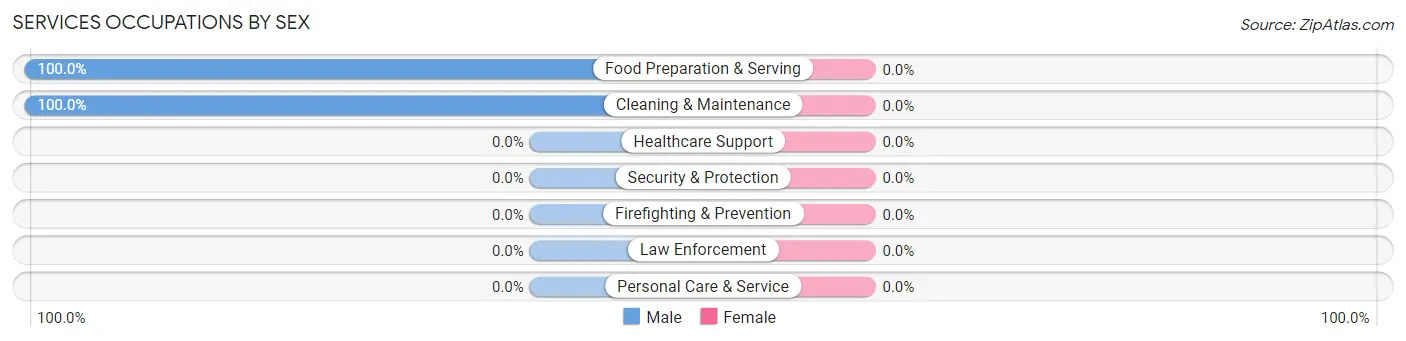
| Occupation | Male | Female |
| Healthcare Support | 0 (0.0%) | 0 (0.0%) |
| Security & Protection | 0 (0.0%) | 0 (0.0%) |
| Firefighting & Prevention | 0 (0.0%) | 0 (0.0%) |
| Law Enforcement | 0 (0.0%) | 0 (0.0%) |
| Food Preparation & Serving | 87 (100.0%) | 0 (0.0%) |
| Cleaning & Maintenance | 22 (100.0%) | 0 (0.0%) |
| Personal Care & Service | 0 (0.0%) | 0 (0.0%) |
| Total (Category) | 109 (100.0%) | 0 (0.0%) |
| Total (Overall) | 153 (69.9%) | 66 (30.1%) |
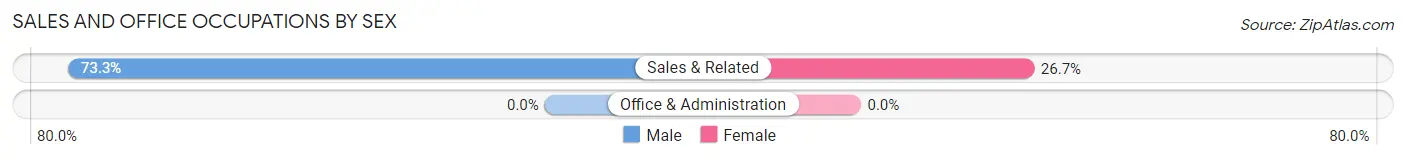
Sales and Office Occupations
The most common Sales and Office occupations in Glacier are , and Sales & Related (60 | 27.4%).
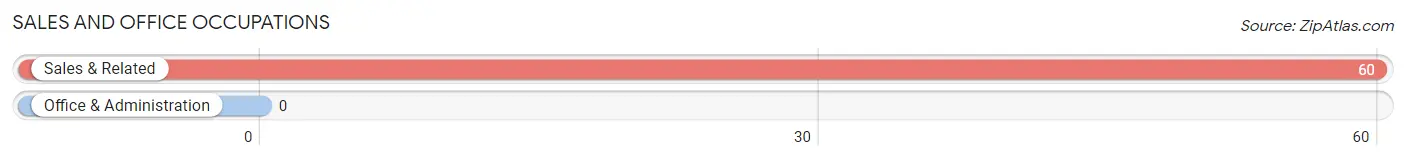
Sales and Office Occupations by Sex
| Occupation | Male | Female |
| Sales & Related | 44 (73.3%) | 16 (26.7%) |
| Office & Administration | 0 (0.0%) | 0 (0.0%) |
| Total (Category) | 44 (73.3%) | 16 (26.7%) |
| Total (Overall) | 153 (69.9%) | 66 (30.1%) |
Natural Resources, Construction and Maintenance Occupations
Natural Resources, Construction and Maintenance Occupations by Sex
| Occupation | Male | Female |
| Farming, Fishing & Forestry | 0 (0.0%) | 0 (0.0%) |
| Construction & Extraction | 0 (0.0%) | 0 (0.0%) |
| Installation, Maintenance & Repair | 0 (0.0%) | 0 (0.0%) |
| Total (Category) | 0 (0.0%) | 0 (0.0%) |
| Total (Overall) | 153 (69.9%) | 66 (30.1%) |
Production, Transportation and Moving Occupations
Production, Transportation and Moving Occupations by Sex
| Occupation | Male | Female |
| Production | 0 (0.0%) | 0 (0.0%) |
| Transportation | 0 (0.0%) | 0 (0.0%) |
| Material Moving | 0 (0.0%) | 0 (0.0%) |
| Total (Category) | 0 (0.0%) | 0 (0.0%) |
| Total (Overall) | 153 (69.9%) | 66 (30.1%) |
Employment Industries by Sex in Glacier
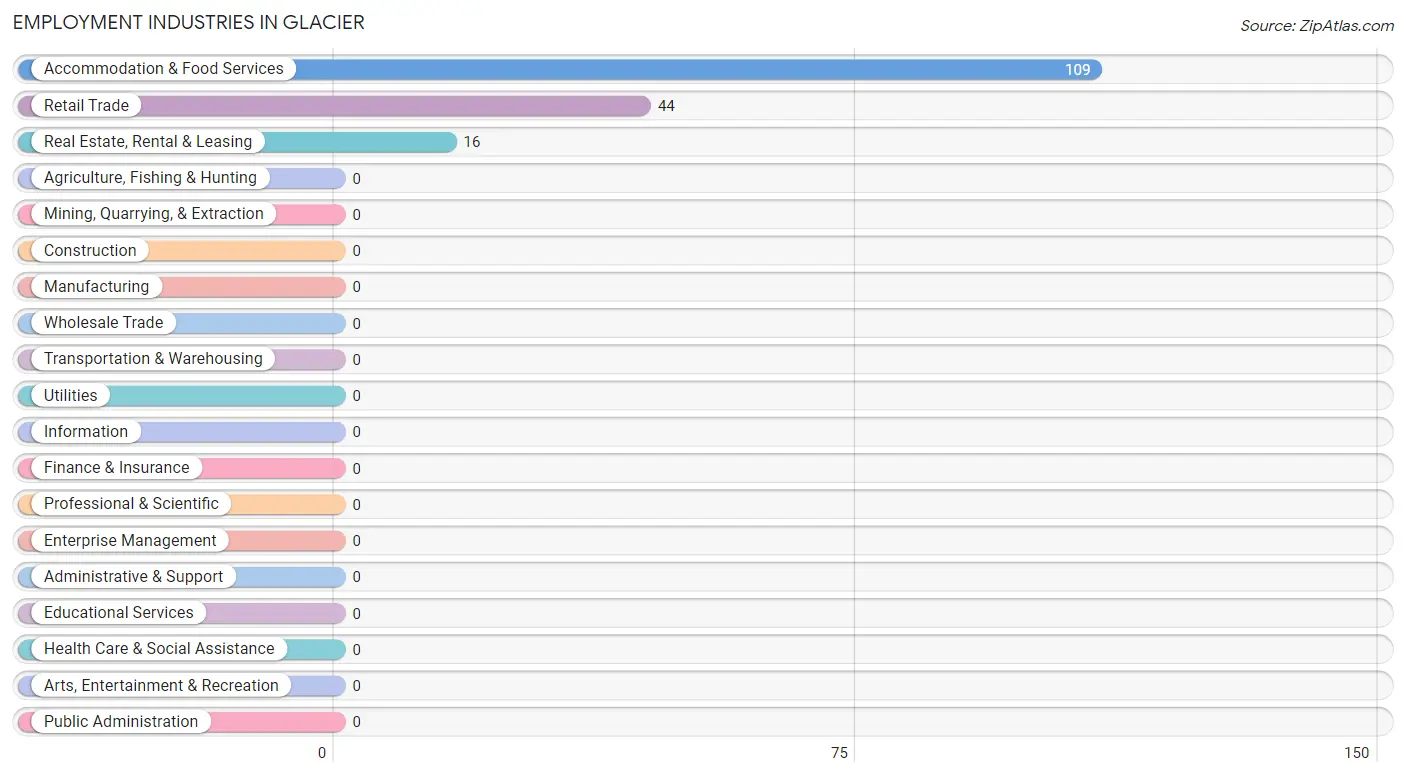
Employment Industries in Glacier
The major employment industries in Glacier include Accommodation & Food Services (109 | 49.8%), Retail Trade (44 | 20.1%), and Real Estate, Rental & Leasing (16 | 7.3%).
Employment Industries by Sex in Glacier
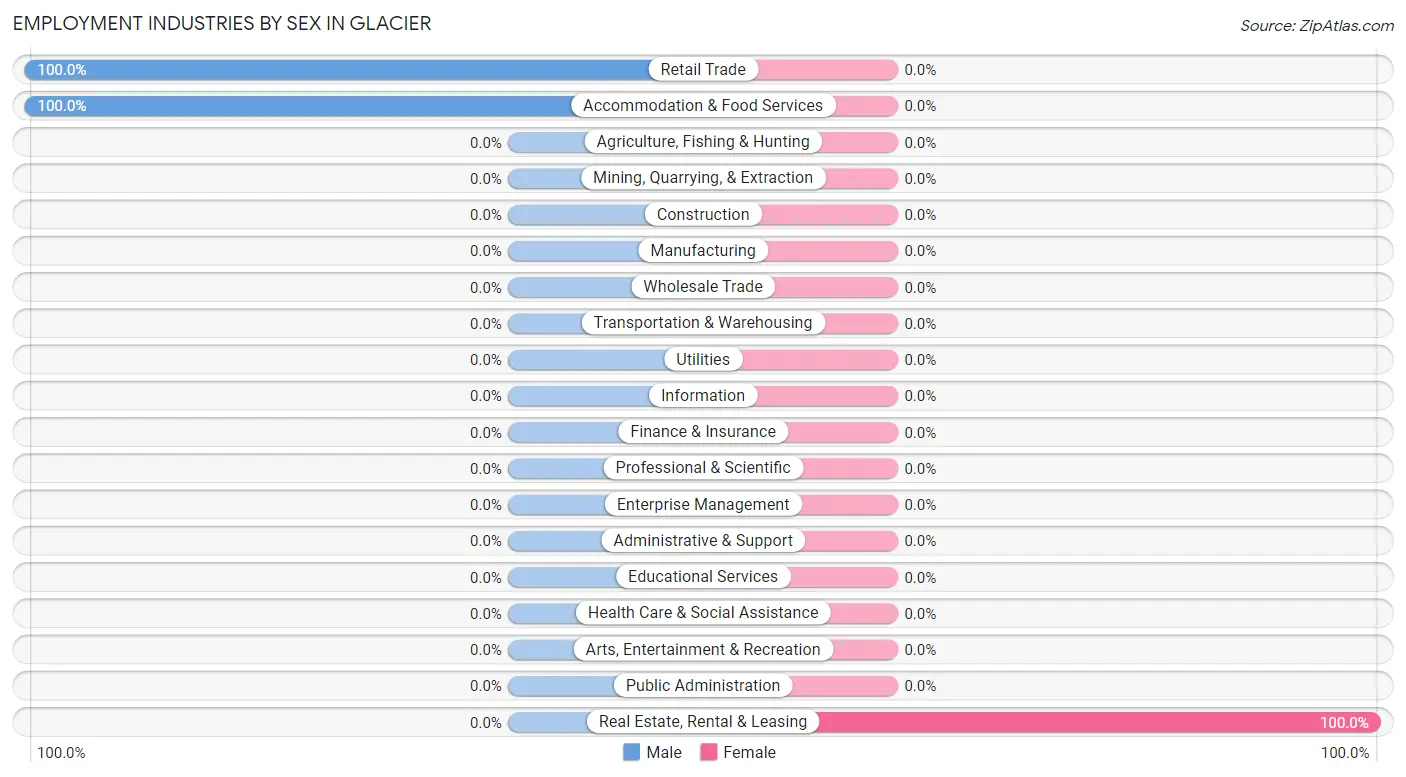
| Industry | Male | Female |
| Agriculture, Fishing & Hunting | 0 (0.0%) | 0 (0.0%) |
| Mining, Quarrying, & Extraction | 0 (0.0%) | 0 (0.0%) |
| Construction | 0 (0.0%) | 0 (0.0%) |
| Manufacturing | 0 (0.0%) | 0 (0.0%) |
| Wholesale Trade | 0 (0.0%) | 0 (0.0%) |
| Retail Trade | 44 (100.0%) | 0 (0.0%) |
| Transportation & Warehousing | 0 (0.0%) | 0 (0.0%) |
| Utilities | 0 (0.0%) | 0 (0.0%) |
| Information | 0 (0.0%) | 0 (0.0%) |
| Finance & Insurance | 0 (0.0%) | 0 (0.0%) |
| Real Estate, Rental & Leasing | 0 (0.0%) | 16 (100.0%) |
| Professional & Scientific | 0 (0.0%) | 0 (0.0%) |
| Enterprise Management | 0 (0.0%) | 0 (0.0%) |
| Administrative & Support | 0 (0.0%) | 0 (0.0%) |
| Educational Services | 0 (0.0%) | 0 (0.0%) |
| Health Care & Social Assistance | 0 (0.0%) | 0 (0.0%) |
| Arts, Entertainment & Recreation | 0 (0.0%) | 0 (0.0%) |
| Accommodation & Food Services | 109 (100.0%) | 0 (0.0%) |
| Public Administration | 0 (0.0%) | 0 (0.0%) |
| Total | 153 (69.9%) | 66 (30.1%) |
Education in Glacier
School Enrollment in Glacier
| School Level | # Students | % Students |
| Nursery / Preschool | 0 | 0.0% |
| Kindergarten | 0 | 0.0% |
| Elementary School | 0 | 0.0% |
| Middle School | 0 | 0.0% |
| High School | 0 | 0.0% |
| College / Undergraduate | 0 | 0.0% |
| Graduate / Professional | 0 | 0.0% |
| Total | 0 | 0.0% |
School Enrollment by Age by Funding Source in Glacier
| Age Bracket | Public School | Private School |
| 3 to 4 Year Olds | 0 (0.0%) | 0 (0.0%) |
| 5 to 9 Year Old | 0 (0.0%) | 0 (0.0%) |
| 10 to 14 Year Olds | 0 (0.0%) | 0 (0.0%) |
| 15 to 17 Year Olds | 0 (0.0%) | 0 (0.0%) |
| 18 to 19 Year Olds | 0 (0.0%) | 0 (0.0%) |
| 20 to 24 Year Olds | 0 (0.0%) | 0 (0.0%) |
| 25 to 34 Year Olds | 0 (0.0%) | 0 (0.0%) |
| 35 Years and over | 0 (0.0%) | 0 (0.0%) |
| Total | 0 (0.0%) | 0 (0.0%) |
Educational Attainment by Field of Study in Glacier
Visual & performing arts (50 | 61.7%), science & technology (16 | 19.8%), and bio, nature & agricultural (15 | 18.5%) are the most common fields of study among 81 individuals in Glacier who have obtained a bachelor's degree or higher.
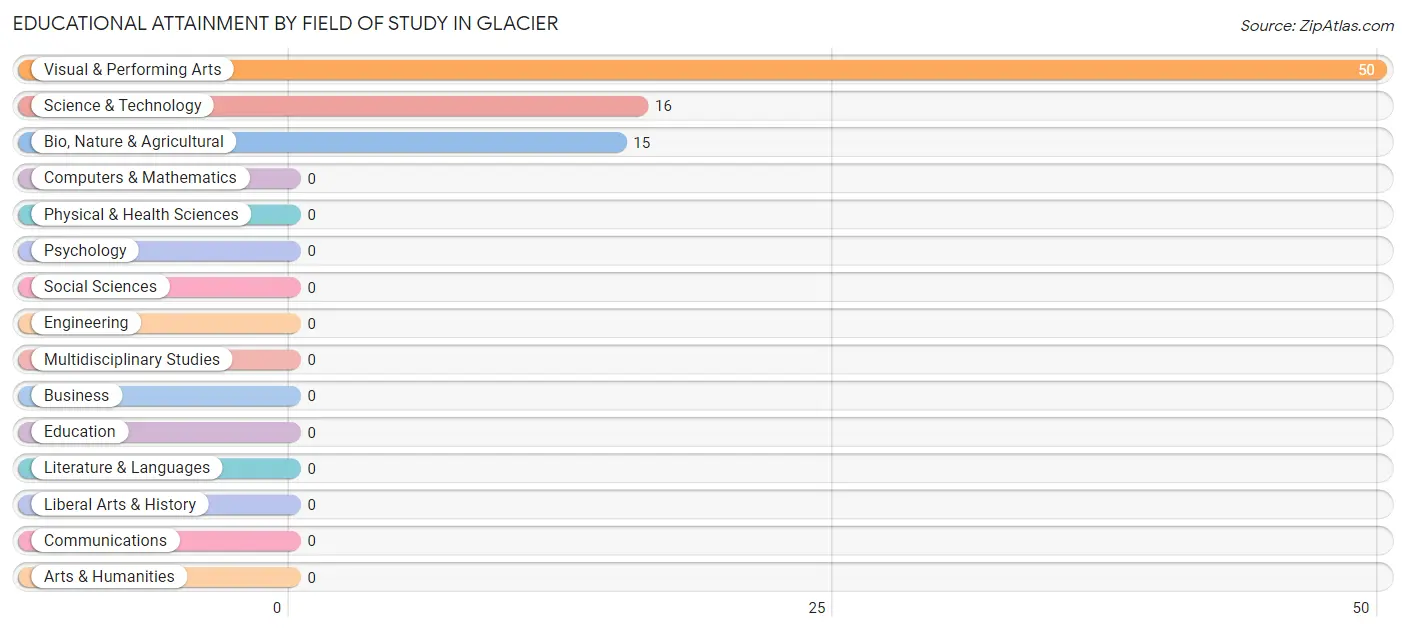
| Field of Study | # Graduates | % Graduates |
| Computers & Mathematics | 0 | 0.0% |
| Bio, Nature & Agricultural | 15 | 18.5% |
| Physical & Health Sciences | 0 | 0.0% |
| Psychology | 0 | 0.0% |
| Social Sciences | 0 | 0.0% |
| Engineering | 0 | 0.0% |
| Multidisciplinary Studies | 0 | 0.0% |
| Science & Technology | 16 | 19.8% |
| Business | 0 | 0.0% |
| Education | 0 | 0.0% |
| Literature & Languages | 0 | 0.0% |
| Liberal Arts & History | 0 | 0.0% |
| Visual & Performing Arts | 50 | 61.7% |
| Communications | 0 | 0.0% |
| Arts & Humanities | 0 | 0.0% |
| Total | 81 | 100.0% |
Transportation & Commute in Glacier
Vehicle Availability by Sex in Glacier
The most prevalent vehicle ownership categories in Glacier are males with 2 vehicles (153, accounting for 100.0%) and females with 2 vehicles (50, making up 231.8%).
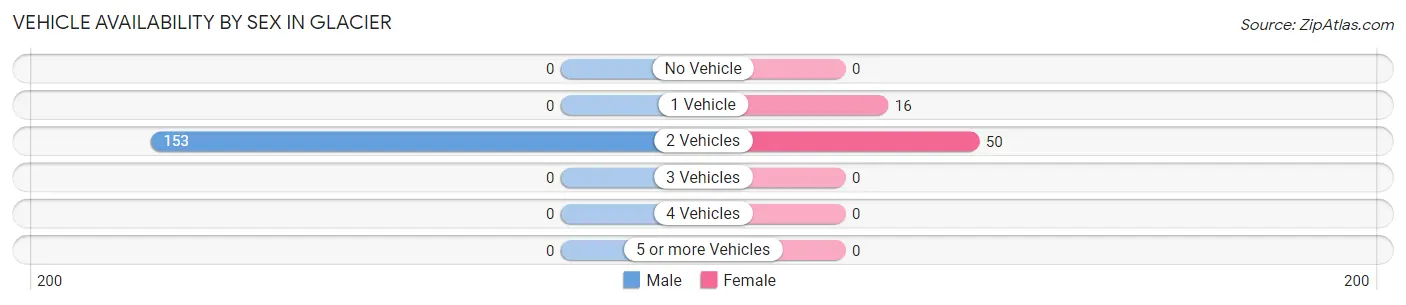
| Vehicles Available | Male | Female |
| No Vehicle | 0 (0.0%) | 0 (0.0%) |
| 1 Vehicle | 0 (0.0%) | 16 (24.2%) |
| 2 Vehicles | 153 (100.0%) | 50 (75.8%) |
| 3 Vehicles | 0 (0.0%) | 0 (0.0%) |
| 4 Vehicles | 0 (0.0%) | 0 (0.0%) |
| 5 or more Vehicles | 0 (0.0%) | 0 (0.0%) |
| Total | 153 (100.0%) | 66 (100.0%) |
Commute Time in Glacier
The most frequently occuring commute durations in Glacier are less than 5 minutes (64 commuters, 40.3%), 60 to 89 minutes (50 commuters, 31.5%), and 5 to 9 minutes (45 commuters, 28.3%).
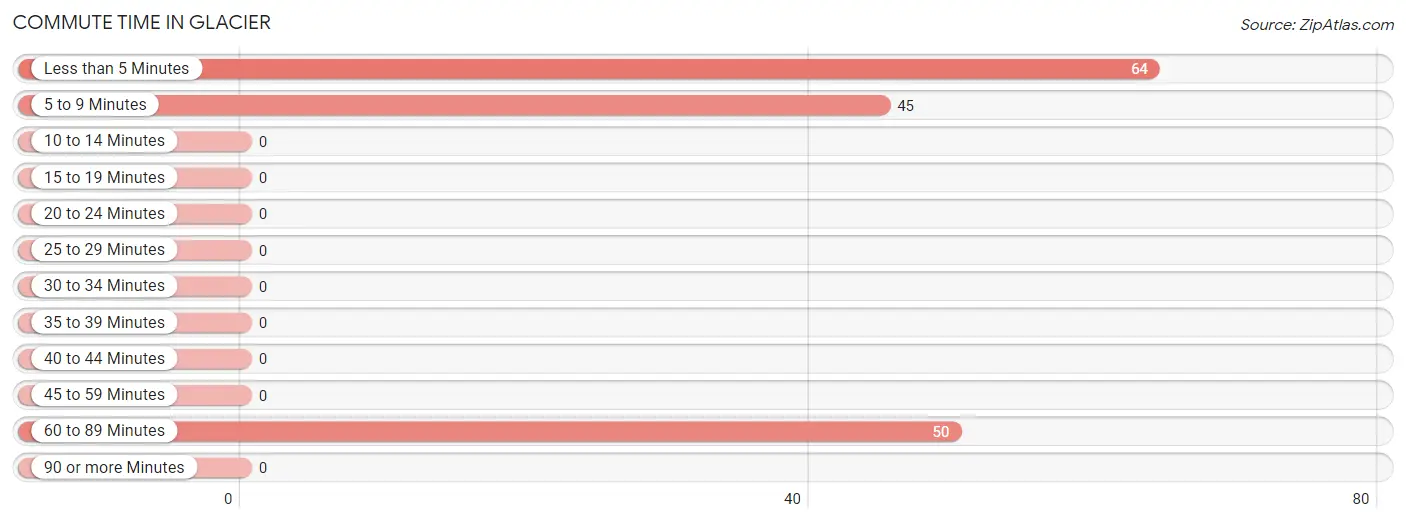
| Commute Time | # Commuters | % Commuters |
| Less than 5 Minutes | 64 | 40.3% |
| 5 to 9 Minutes | 45 | 28.3% |
| 10 to 14 Minutes | 0 | 0.0% |
| 15 to 19 Minutes | 0 | 0.0% |
| 20 to 24 Minutes | 0 | 0.0% |
| 25 to 29 Minutes | 0 | 0.0% |
| 30 to 34 Minutes | 0 | 0.0% |
| 35 to 39 Minutes | 0 | 0.0% |
| 40 to 44 Minutes | 0 | 0.0% |
| 45 to 59 Minutes | 0 | 0.0% |
| 60 to 89 Minutes | 50 | 31.5% |
| 90 or more Minutes | 0 | 0.0% |
Commute Time by Sex in Glacier
The most common commute times in Glacier are less than 5 minutes (64 commuters, 58.7%) for males and 60 to 89 minutes (50 commuters, 100.0%) for females.
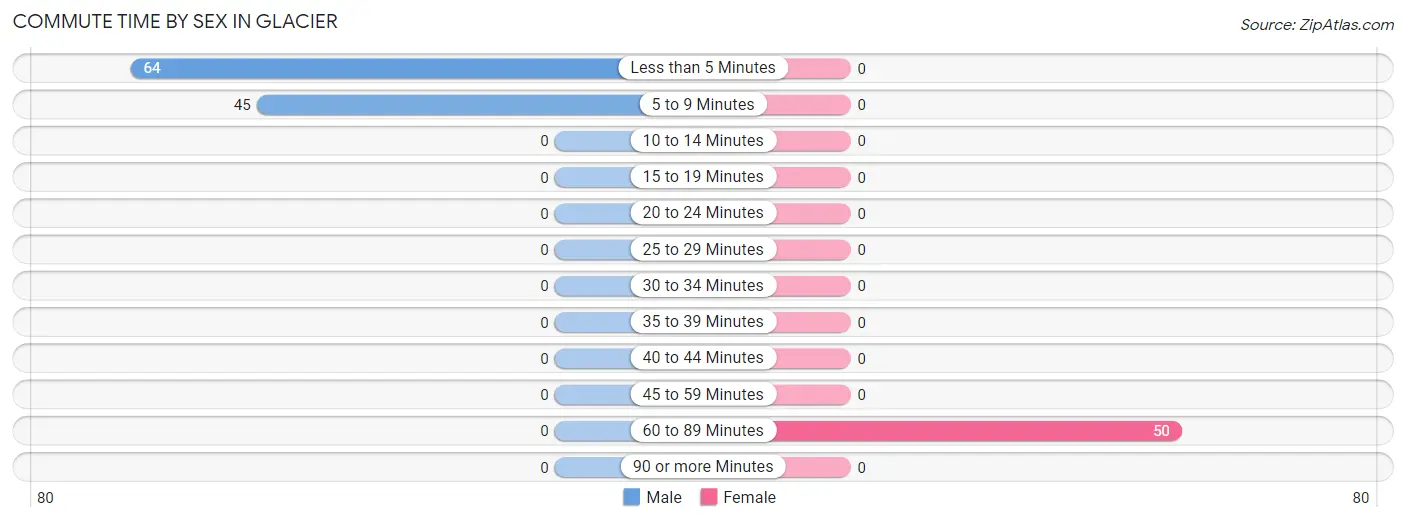
| Commute Time | Male | Female |
| Less than 5 Minutes | 64 (58.7%) | 0 (0.0%) |
| 5 to 9 Minutes | 45 (41.3%) | 0 (0.0%) |
| 10 to 14 Minutes | 0 (0.0%) | 0 (0.0%) |
| 15 to 19 Minutes | 0 (0.0%) | 0 (0.0%) |
| 20 to 24 Minutes | 0 (0.0%) | 0 (0.0%) |
| 25 to 29 Minutes | 0 (0.0%) | 0 (0.0%) |
| 30 to 34 Minutes | 0 (0.0%) | 0 (0.0%) |
| 35 to 39 Minutes | 0 (0.0%) | 0 (0.0%) |
| 40 to 44 Minutes | 0 (0.0%) | 0 (0.0%) |
| 45 to 59 Minutes | 0 (0.0%) | 0 (0.0%) |
| 60 to 89 Minutes | 0 (0.0%) | 50 (100.0%) |
| 90 or more Minutes | 0 (0.0%) | 0 (0.0%) |
Time of Departure to Work by Sex in Glacier
The most frequent times of departure to work in Glacier are 4:00 PM to 11:59 PM (64, 58.7%) for males and 6:30 AM to 6:59 AM (50, 100.0%) for females.
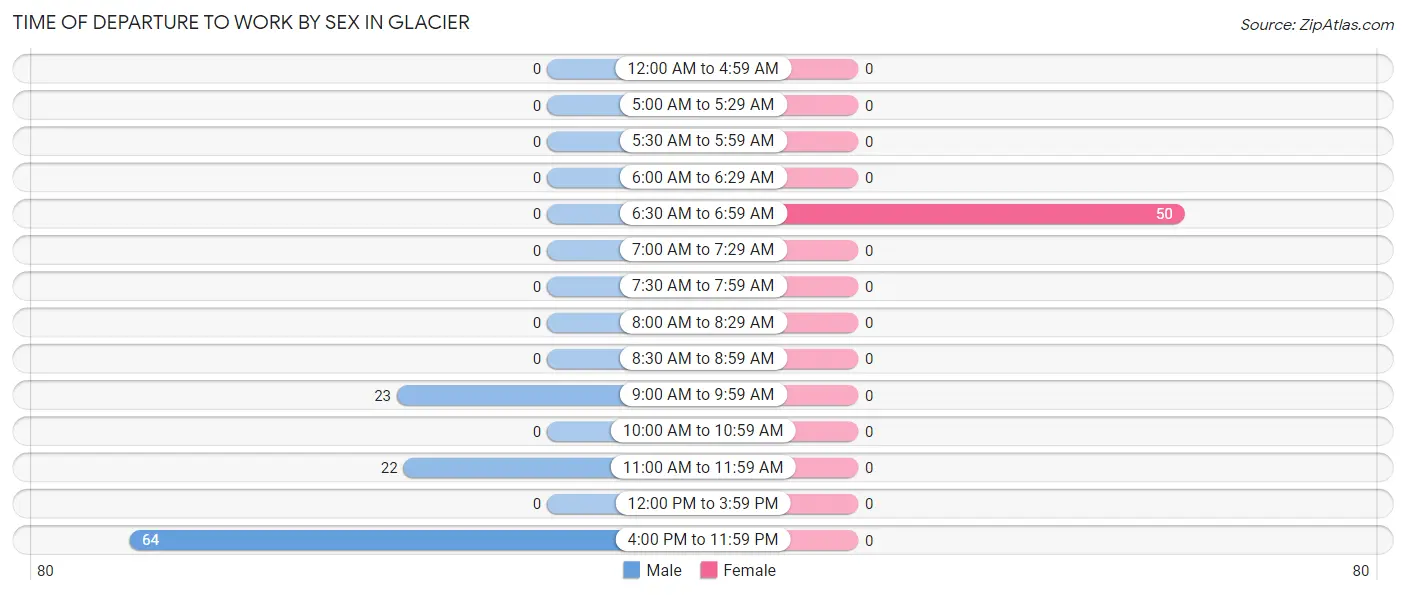
| Time of Departure | Male | Female |
| 12:00 AM to 4:59 AM | 0 (0.0%) | 0 (0.0%) |
| 5:00 AM to 5:29 AM | 0 (0.0%) | 0 (0.0%) |
| 5:30 AM to 5:59 AM | 0 (0.0%) | 0 (0.0%) |
| 6:00 AM to 6:29 AM | 0 (0.0%) | 0 (0.0%) |
| 6:30 AM to 6:59 AM | 0 (0.0%) | 50 (100.0%) |
| 7:00 AM to 7:29 AM | 0 (0.0%) | 0 (0.0%) |
| 7:30 AM to 7:59 AM | 0 (0.0%) | 0 (0.0%) |
| 8:00 AM to 8:29 AM | 0 (0.0%) | 0 (0.0%) |
| 8:30 AM to 8:59 AM | 0 (0.0%) | 0 (0.0%) |
| 9:00 AM to 9:59 AM | 23 (21.1%) | 0 (0.0%) |
| 10:00 AM to 10:59 AM | 0 (0.0%) | 0 (0.0%) |
| 11:00 AM to 11:59 AM | 22 (20.2%) | 0 (0.0%) |
| 12:00 PM to 3:59 PM | 0 (0.0%) | 0 (0.0%) |
| 4:00 PM to 11:59 PM | 64 (58.7%) | 0 (0.0%) |
| Total | 109 (100.0%) | 50 (100.0%) |
Housing Occupancy in Glacier
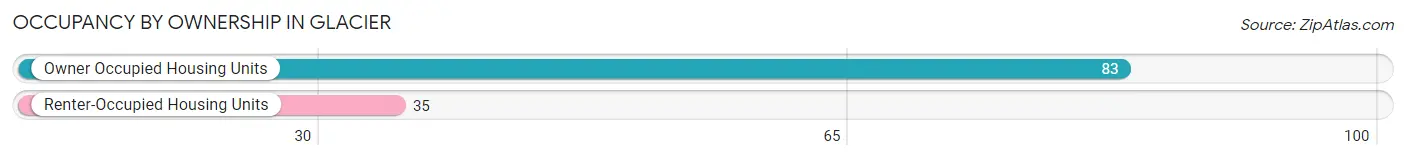
Occupancy by Ownership in Glacier
Of the total 118 dwellings in Glacier, owner-occupied units account for 83 (70.3%), while renter-occupied units make up 35 (29.7%).
| Occupancy | # Housing Units | % Housing Units |
| Owner Occupied Housing Units | 83 | 70.3% |
| Renter-Occupied Housing Units | 35 | 29.7% |
| Total Occupied Housing Units | 118 | 100.0% |
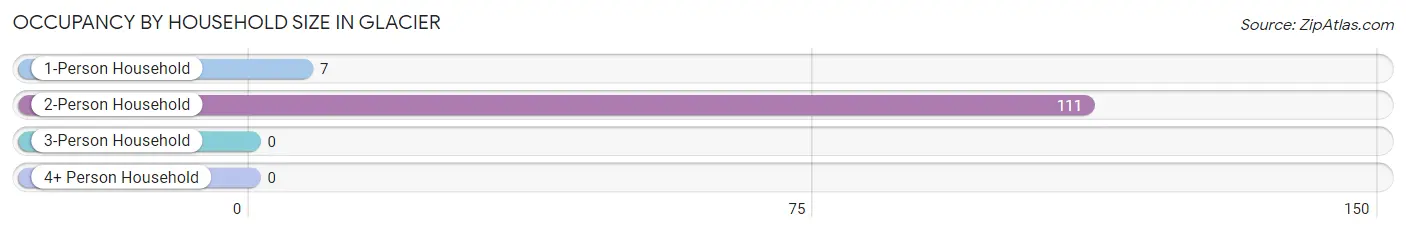
Occupancy by Household Size in Glacier
| Household Size | # Housing Units | % Housing Units |
| 1-Person Household | 7 | 5.9% |
| 2-Person Household | 111 | 94.1% |
| 3-Person Household | 0 | 0.0% |
| 4+ Person Household | 0 | 0.0% |
| Total Housing Units | 118 | 100.0% |
Occupancy by Ownership by Household Size in Glacier
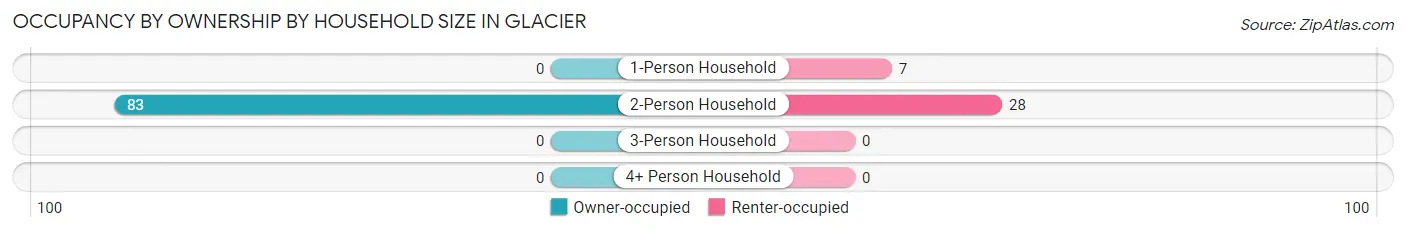
| Household Size | Owner-occupied | Renter-occupied |
| 1-Person Household | 0 (0.0%) | 7 (100.0%) |
| 2-Person Household | 83 (74.8%) | 28 (25.2%) |
| 3-Person Household | 0 (0.0%) | 0 (0.0%) |
| 4+ Person Household | 0 (0.0%) | 0 (0.0%) |
| Total Housing Units | 83 (70.3%) | 35 (29.7%) |
Occupancy by Educational Attainment in Glacier
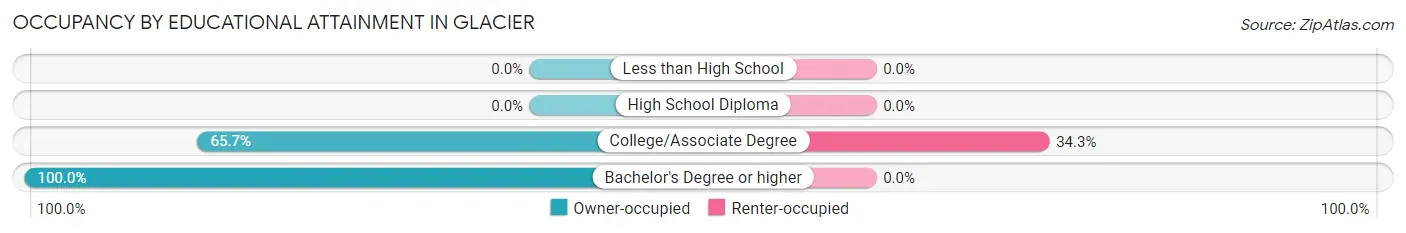
| Household Size | Owner-occupied | Renter-occupied |
| Less than High School | 0 (0.0%) | 0 (0.0%) |
| High School Diploma | 0 (0.0%) | 0 (0.0%) |
| College/Associate Degree | 67 (65.7%) | 35 (34.3%) |
| Bachelor's Degree or higher | 16 (100.0%) | 0 (0.0%) |
Occupancy by Age of Householder in Glacier
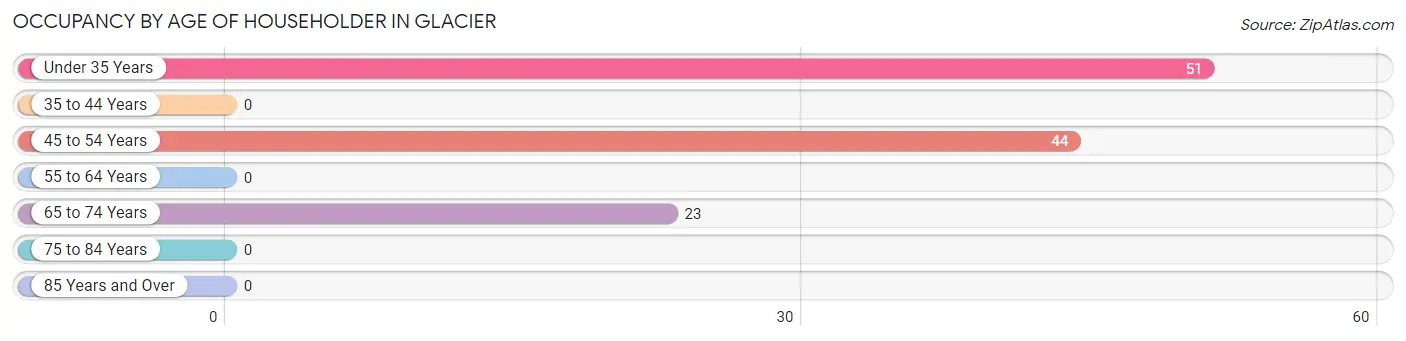
| Age Bracket | # Households | % Households |
| Under 35 Years | 51 | 43.2% |
| 35 to 44 Years | 0 | 0.0% |
| 45 to 54 Years | 44 | 37.3% |
| 55 to 64 Years | 0 | 0.0% |
| 65 to 74 Years | 23 | 19.5% |
| 75 to 84 Years | 0 | 0.0% |
| 85 Years and Over | 0 | 0.0% |
| Total | 118 | 100.0% |
Housing Finances in Glacier
Median Income by Occupancy in Glacier

| Occupancy Type | # Households | Median Income |
| Owner-Occupied | 83 (70.3%) | $0 |
| Renter-Occupied | 35 (29.7%) | $0 |
| Average | 118 (100.0%) | $30,714 |
Occupancy by Householder Income Bracket in Glacier
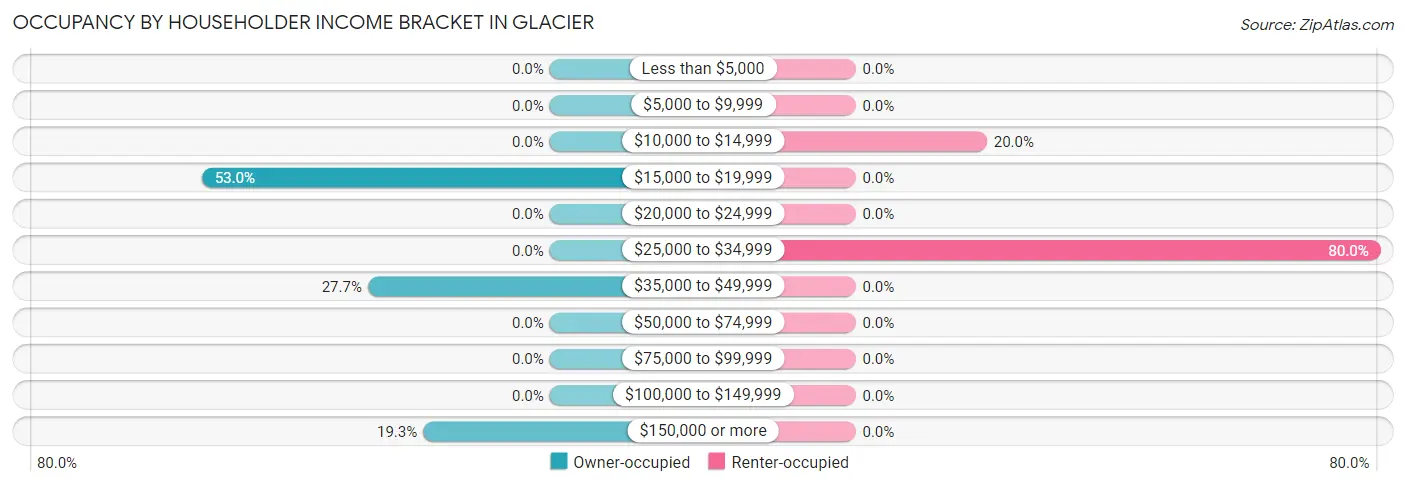
| Income Bracket | Owner-occupied | Renter-occupied |
| Less than $5,000 | 0 (0.0%) | 0 (0.0%) |
| $5,000 to $9,999 | 0 (0.0%) | 0 (0.0%) |
| $10,000 to $14,999 | 0 (0.0%) | 7 (20.0%) |
| $15,000 to $19,999 | 44 (53.0%) | 0 (0.0%) |
| $20,000 to $24,999 | 0 (0.0%) | 0 (0.0%) |
| $25,000 to $34,999 | 0 (0.0%) | 28 (80.0%) |
| $35,000 to $49,999 | 23 (27.7%) | 0 (0.0%) |
| $50,000 to $74,999 | 0 (0.0%) | 0 (0.0%) |
| $75,000 to $99,999 | 0 (0.0%) | 0 (0.0%) |
| $100,000 to $149,999 | 0 (0.0%) | 0 (0.0%) |
| $150,000 or more | 16 (19.3%) | 0 (0.0%) |
| Total | 83 (100.0%) | 35 (100.0%) |
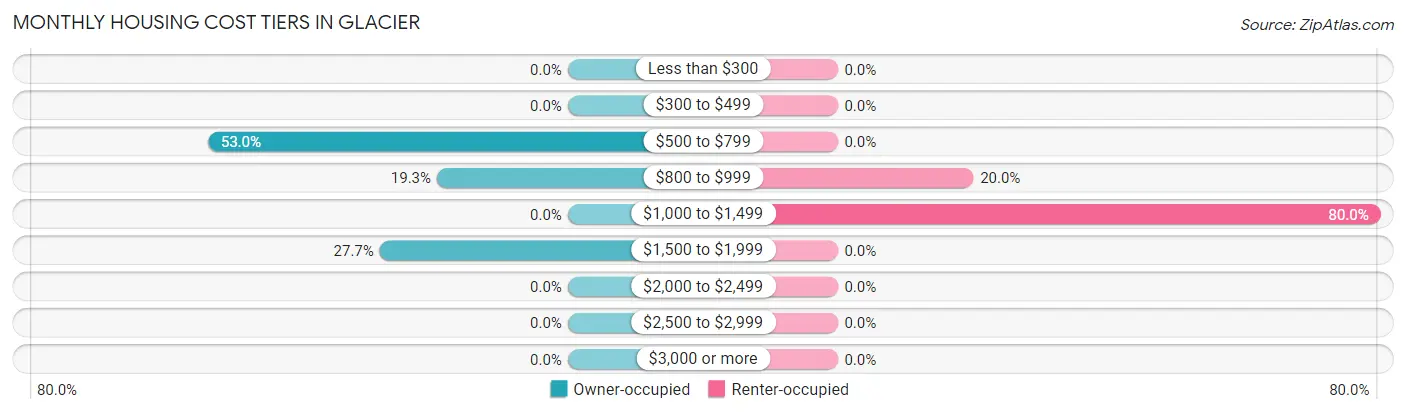
Monthly Housing Cost Tiers in Glacier
| Monthly Cost | Owner-occupied | Renter-occupied |
| Less than $300 | 0 (0.0%) | 0 (0.0%) |
| $300 to $499 | 0 (0.0%) | 0 (0.0%) |
| $500 to $799 | 44 (53.0%) | 0 (0.0%) |
| $800 to $999 | 16 (19.3%) | 7 (20.0%) |
| $1,000 to $1,499 | 0 (0.0%) | 28 (80.0%) |
| $1,500 to $1,999 | 23 (27.7%) | 0 (0.0%) |
| $2,000 to $2,499 | 0 (0.0%) | 0 (0.0%) |
| $2,500 to $2,999 | 0 (0.0%) | 0 (0.0%) |
| $3,000 or more | 0 (0.0%) | 0 (0.0%) |
| Total | 83 (100.0%) | 35 (100.0%) |
Physical Housing Characteristics in Glacier
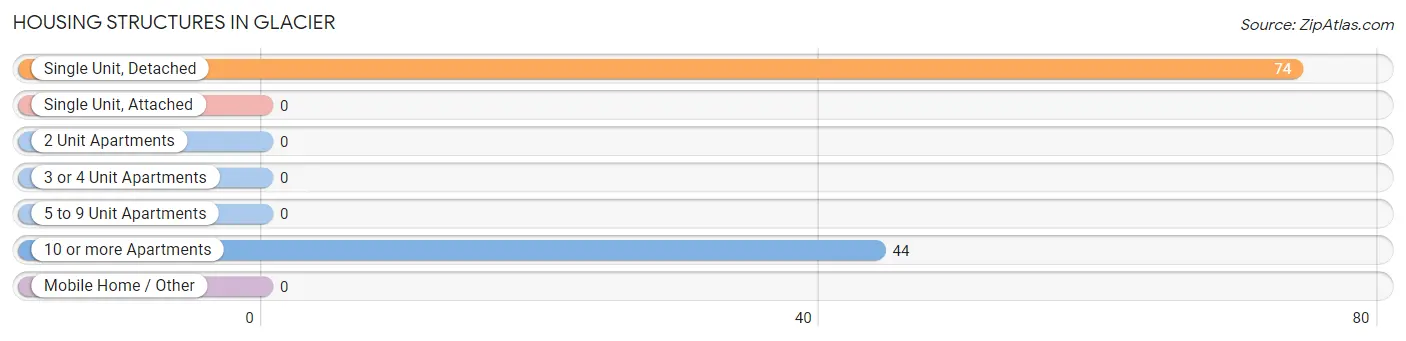
Housing Structures in Glacier
| Structure Type | # Housing Units | % Housing Units |
| Single Unit, Detached | 74 | 62.7% |
| Single Unit, Attached | 0 | 0.0% |
| 2 Unit Apartments | 0 | 0.0% |
| 3 or 4 Unit Apartments | 0 | 0.0% |
| 5 to 9 Unit Apartments | 0 | 0.0% |
| 10 or more Apartments | 44 | 37.3% |
| Mobile Home / Other | 0 | 0.0% |
| Total | 118 | 100.0% |
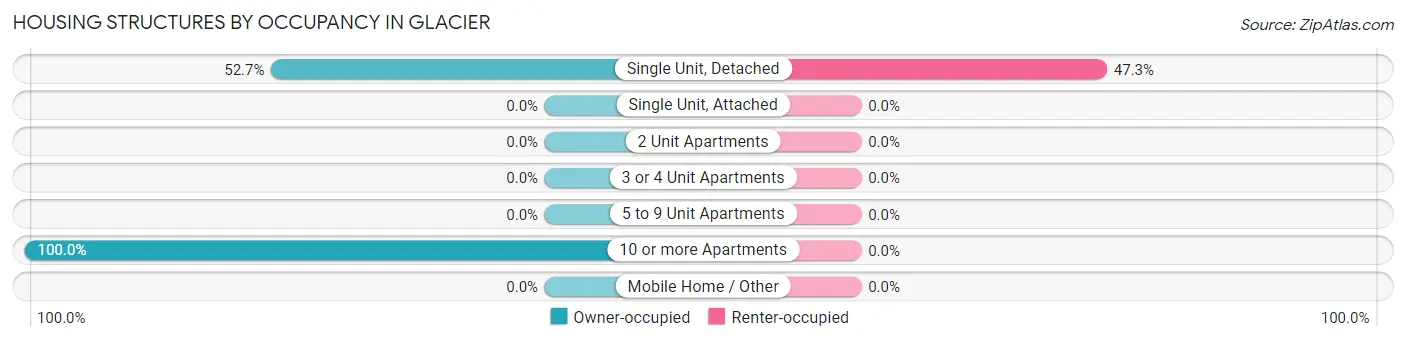
Housing Structures by Occupancy in Glacier
| Structure Type | Owner-occupied | Renter-occupied |
| Single Unit, Detached | 39 (52.7%) | 35 (47.3%) |
| Single Unit, Attached | 0 (0.0%) | 0 (0.0%) |
| 2 Unit Apartments | 0 (0.0%) | 0 (0.0%) |
| 3 or 4 Unit Apartments | 0 (0.0%) | 0 (0.0%) |
| 5 to 9 Unit Apartments | 0 (0.0%) | 0 (0.0%) |
| 10 or more Apartments | 44 (100.0%) | 0 (0.0%) |
| Mobile Home / Other | 0 (0.0%) | 0 (0.0%) |
| Total | 83 (70.3%) | 35 (29.7%) |
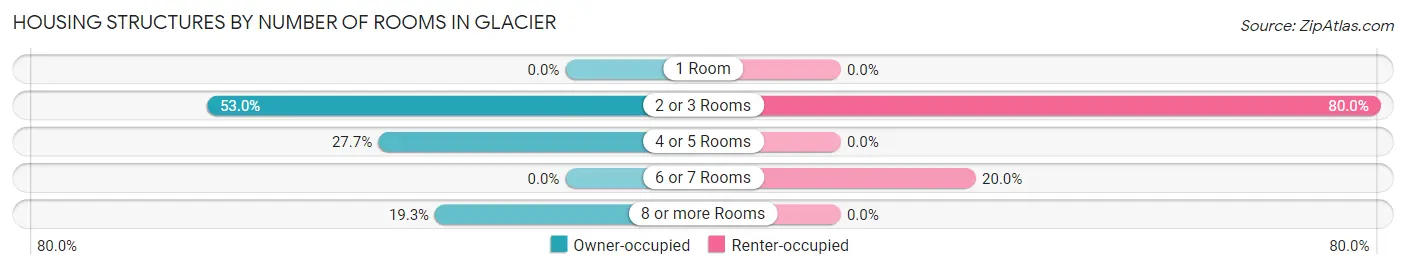
Housing Structures by Number of Rooms in Glacier
| Number of Rooms | Owner-occupied | Renter-occupied |
| 1 Room | 0 (0.0%) | 0 (0.0%) |
| 2 or 3 Rooms | 44 (53.0%) | 28 (80.0%) |
| 4 or 5 Rooms | 23 (27.7%) | 0 (0.0%) |
| 6 or 7 Rooms | 0 (0.0%) | 7 (20.0%) |
| 8 or more Rooms | 16 (19.3%) | 0 (0.0%) |
| Total | 83 (100.0%) | 35 (100.0%) |
Housing Structure by Heating Type in Glacier
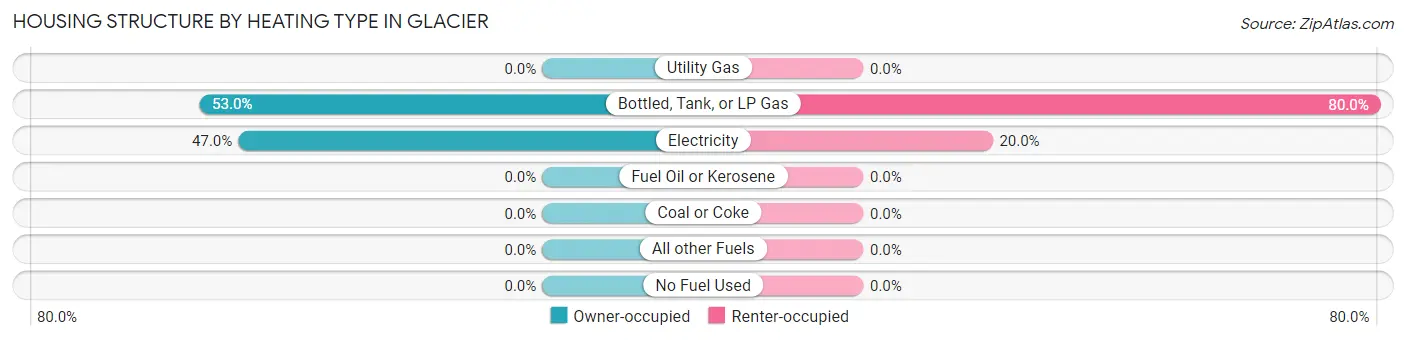
| Heating Type | Owner-occupied | Renter-occupied |
| Utility Gas | 0 (0.0%) | 0 (0.0%) |
| Bottled, Tank, or LP Gas | 44 (53.0%) | 28 (80.0%) |
| Electricity | 39 (47.0%) | 7 (20.0%) |
| Fuel Oil or Kerosene | 0 (0.0%) | 0 (0.0%) |
| Coal or Coke | 0 (0.0%) | 0 (0.0%) |
| All other Fuels | 0 (0.0%) | 0 (0.0%) |
| No Fuel Used | 0 (0.0%) | 0 (0.0%) |
| Total | 83 (100.0%) | 35 (100.0%) |
Household Vehicle Usage in Glacier
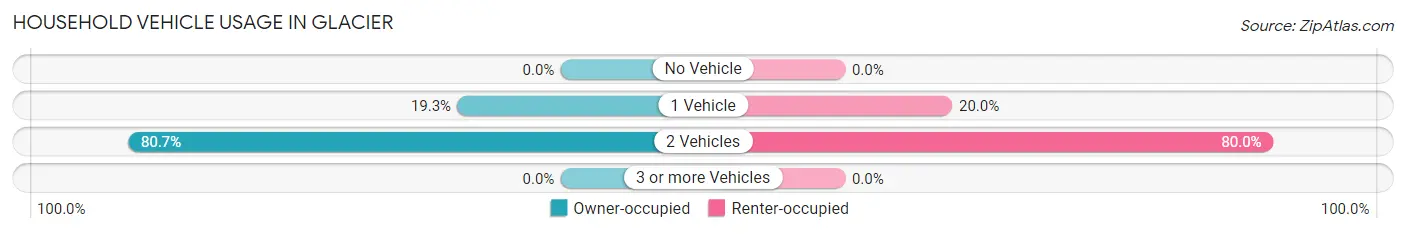
| Vehicles per Household | Owner-occupied | Renter-occupied |
| No Vehicle | 0 (0.0%) | 0 (0.0%) |
| 1 Vehicle | 16 (19.3%) | 7 (20.0%) |
| 2 Vehicles | 67 (80.7%) | 28 (80.0%) |
| 3 or more Vehicles | 0 (0.0%) | 0 (0.0%) |
| Total | 83 (100.0%) | 35 (100.0%) |
Real Estate & Mortgages in Glacier
Real Estate and Mortgage Overview in Glacier
| Characteristic | Without Mortgage | With Mortgage |
| Housing Units | 44 | 39 |
| Median Property Value | - | - |
| Median Household Income | - | - |
| Monthly Housing Costs | - | - |
| Real Estate Taxes | - | - |
Property Value by Mortgage Status in Glacier
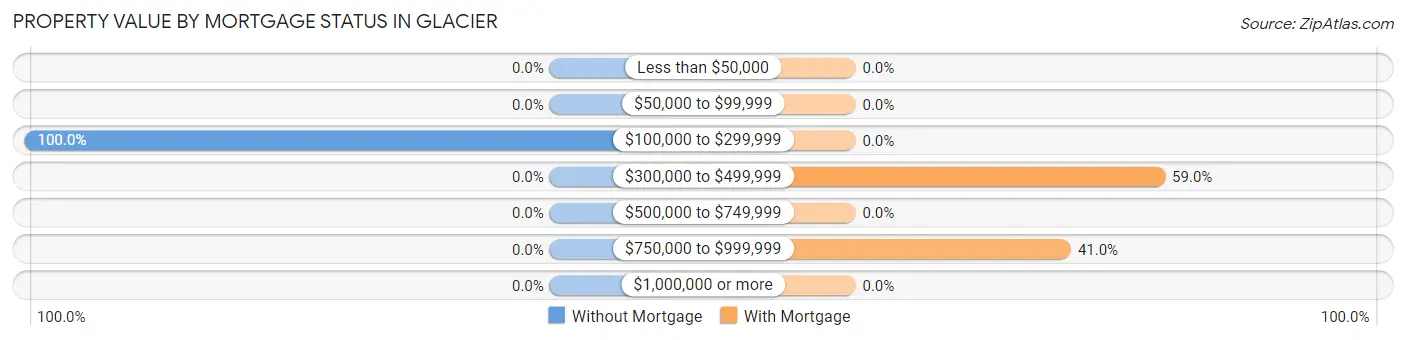
| Property Value | Without Mortgage | With Mortgage |
| Less than $50,000 | 0 (0.0%) | 0 (0.0%) |
| $50,000 to $99,999 | 0 (0.0%) | 0 (0.0%) |
| $100,000 to $299,999 | 44 (100.0%) | 0 (0.0%) |
| $300,000 to $499,999 | 0 (0.0%) | 23 (59.0%) |
| $500,000 to $749,999 | 0 (0.0%) | 0 (0.0%) |
| $750,000 to $999,999 | 0 (0.0%) | 16 (41.0%) |
| $1,000,000 or more | 0 (0.0%) | 0 (0.0%) |
| Total | 44 (100.0%) | 39 (100.0%) |
Household Income by Mortgage Status in Glacier
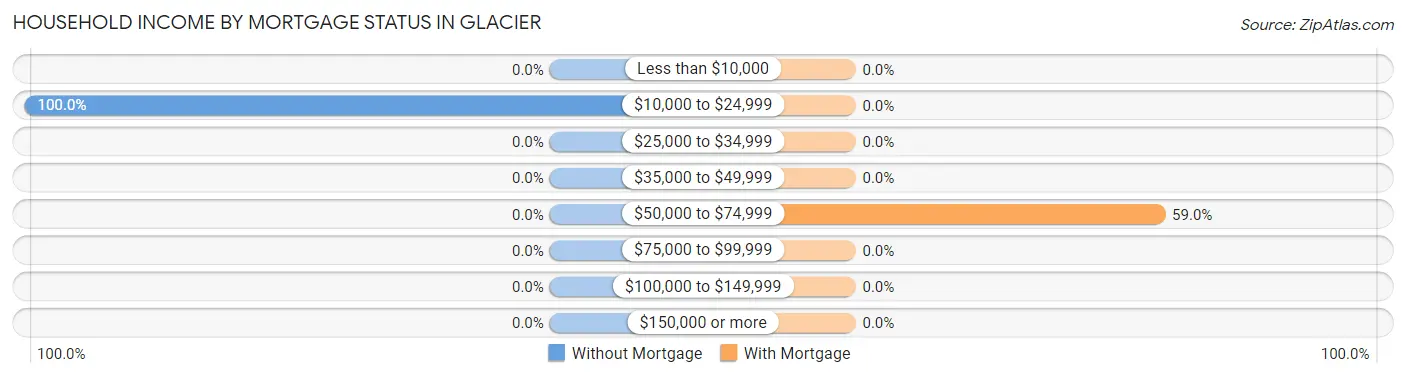
| Household Income | Without Mortgage | With Mortgage |
| Less than $10,000 | 0 (0.0%) | 0 (0.0%) |
| $10,000 to $24,999 | 44 (100.0%) | 0 (0.0%) |
| $25,000 to $34,999 | 0 (0.0%) | 0 (0.0%) |
| $35,000 to $49,999 | 0 (0.0%) | 0 (0.0%) |
| $50,000 to $74,999 | 0 (0.0%) | 23 (59.0%) |
| $75,000 to $99,999 | 0 (0.0%) | 0 (0.0%) |
| $100,000 to $149,999 | 0 (0.0%) | 0 (0.0%) |
| $150,000 or more | 0 (0.0%) | 0 (0.0%) |
| Total | 44 (100.0%) | 39 (100.0%) |
Property Value to Household Income Ratio in Glacier
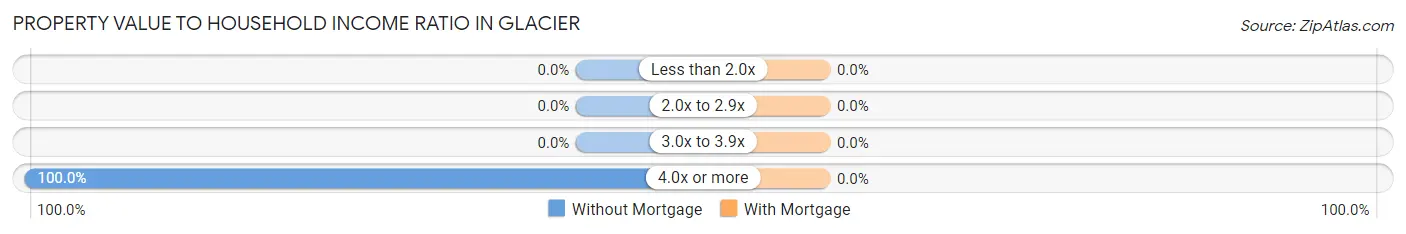
| Value-to-Income Ratio | Without Mortgage | With Mortgage |
| Less than 2.0x | 0 (0.0%) | 0 (0.0%) |
| 2.0x to 2.9x | 0 (0.0%) | 0 (0.0%) |
| 3.0x to 3.9x | 0 (0.0%) | 0 (0.0%) |
| 4.0x or more | 44 (100.0%) | 0 (0.0%) |
| Total | 44 (100.0%) | 39 (100.0%) |
Real Estate Taxes by Mortgage Status in Glacier
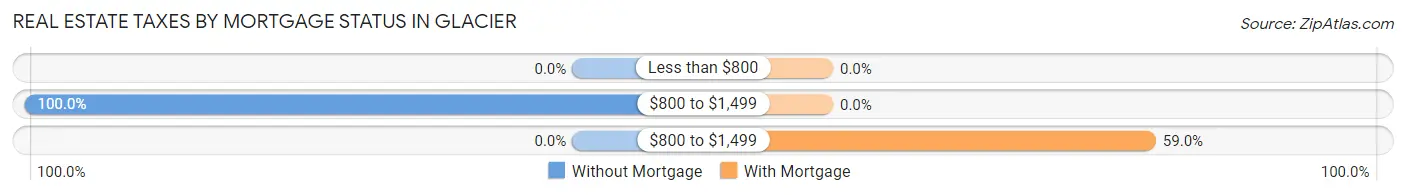
| Property Taxes | Without Mortgage | With Mortgage |
| Less than $800 | 0 (0.0%) | 0 (0.0%) |
| $800 to $1,499 | 44 (100.0%) | 0 (0.0%) |
| $800 to $1,499 | 0 (0.0%) | 23 (59.0%) |
| Total | 44 (100.0%) | 39 (100.0%) |
Health & Disability in Glacier
Health Insurance Coverage by Age in Glacier
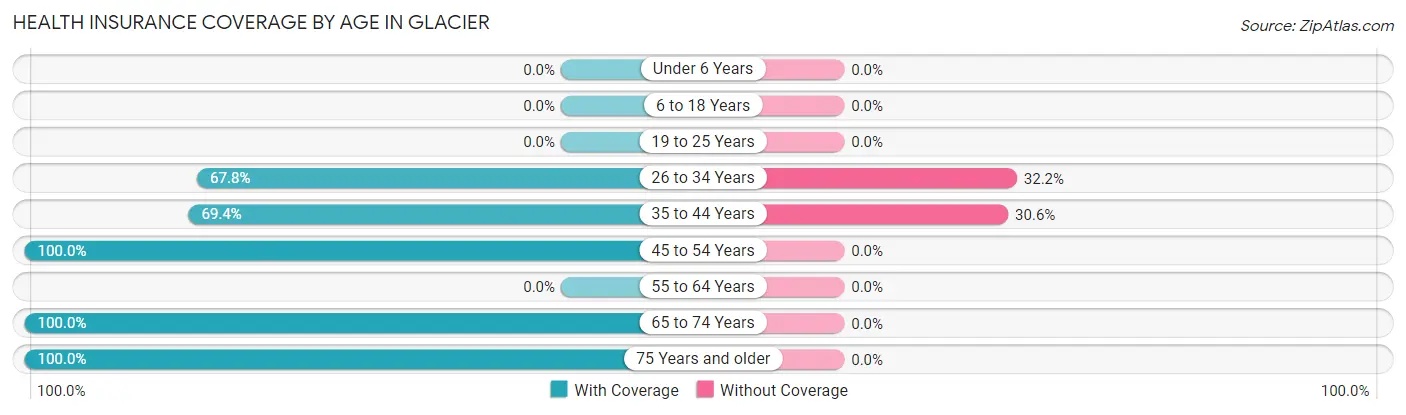
| Age Bracket | With Coverage | Without Coverage |
| Under 6 Years | 0 (0.0%) | 0 (0.0%) |
| 6 to 18 Years | 0 (0.0%) | 0 (0.0%) |
| 19 to 25 Years | 0 (0.0%) | 0 (0.0%) |
| 26 to 34 Years | 59 (67.8%) | 28 (32.2%) |
| 35 to 44 Years | 50 (69.4%) | 22 (30.6%) |
| 45 to 54 Years | 44 (100.0%) | 0 (0.0%) |
| 55 to 64 Years | 0 (0.0%) | 0 (0.0%) |
| 65 to 74 Years | 23 (100.0%) | 0 (0.0%) |
| 75 Years and older | 15 (100.0%) | 0 (0.0%) |
| Total | 191 (79.2%) | 50 (20.7%) |
Health Insurance Coverage by Citizenship Status in Glacier
| Citizenship Status | With Coverage | Without Coverage |
| Native Born | 0 (0.0%) | 0 (0.0%) |
| Foreign Born, Citizen | 0 (0.0%) | 0 (0.0%) |
| Foreign Born, not a Citizen | 0 (0.0%) | 0 (0.0%) |
Health Insurance Coverage by Household Income in Glacier
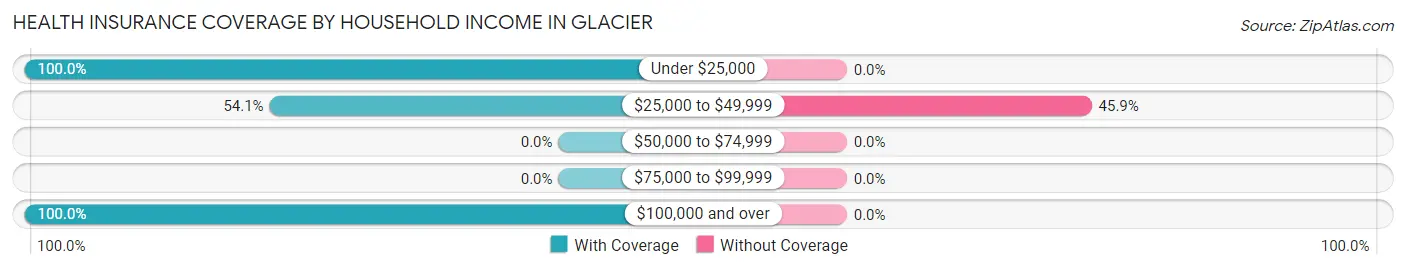
| Household Income | With Coverage | Without Coverage |
| Under $25,000 | 101 (100.0%) | 0 (0.0%) |
| $25,000 to $49,999 | 59 (54.1%) | 50 (45.9%) |
| $50,000 to $74,999 | 0 (0.0%) | 0 (0.0%) |
| $75,000 to $99,999 | 0 (0.0%) | 0 (0.0%) |
| $100,000 and over | 31 (100.0%) | 0 (0.0%) |
Public vs Private Health Insurance Coverage by Age in Glacier
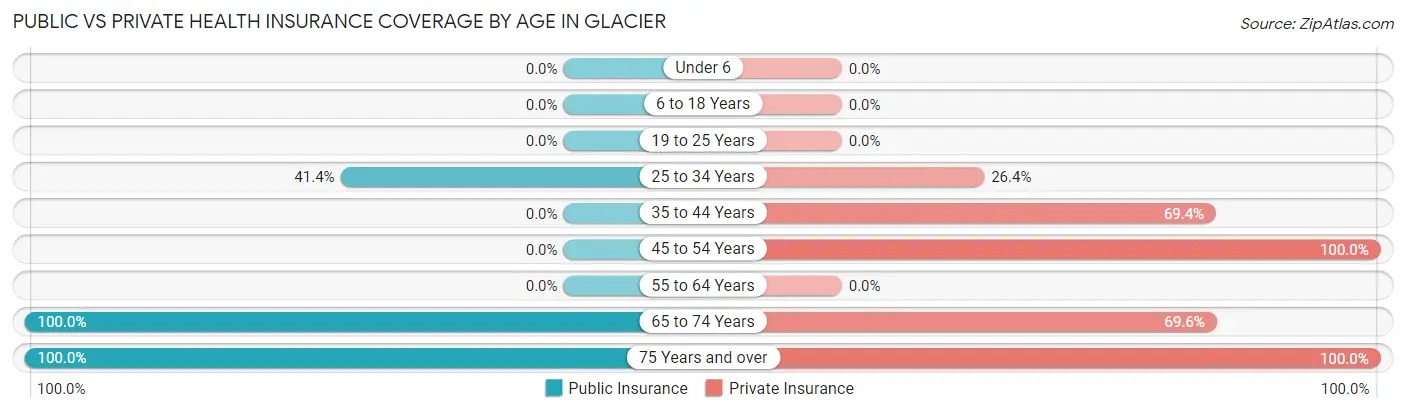
| Age Bracket | Public Insurance | Private Insurance |
| Under 6 | 0 (0.0%) | 0 (0.0%) |
| 6 to 18 Years | 0 (0.0%) | 0 (0.0%) |
| 19 to 25 Years | 0 (0.0%) | 0 (0.0%) |
| 25 to 34 Years | 36 (41.4%) | 23 (26.4%) |
| 35 to 44 Years | 0 (0.0%) | 50 (69.4%) |
| 45 to 54 Years | 0 (0.0%) | 44 (100.0%) |
| 55 to 64 Years | 0 (0.0%) | 0 (0.0%) |
| 65 to 74 Years | 23 (100.0%) | 16 (69.6%) |
| 75 Years and over | 15 (100.0%) | 15 (100.0%) |
| Total | 74 (30.7%) | 148 (61.4%) |
Disability Status by Sex by Age in Glacier
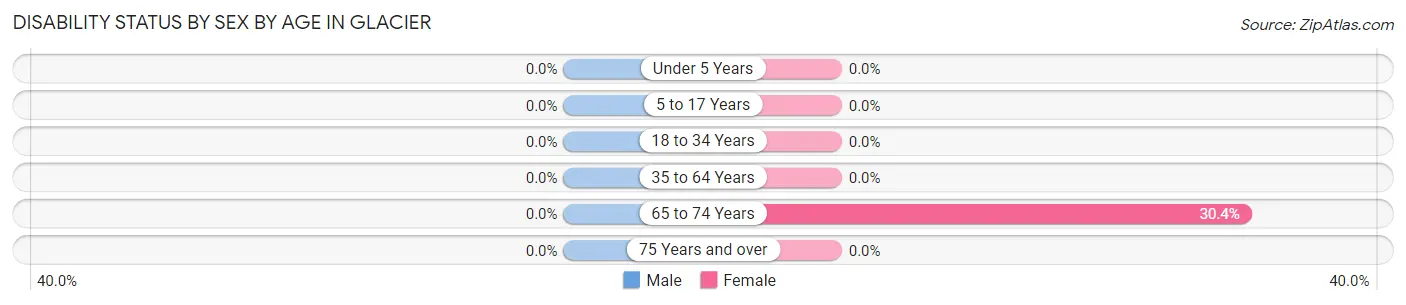
| Age Bracket | Male | Female |
| Under 5 Years | 0 (0.0%) | 0 (0.0%) |
| 5 to 17 Years | 0 (0.0%) | 0 (0.0%) |
| 18 to 34 Years | 0 (0.0%) | 0 (0.0%) |
| 35 to 64 Years | 0 (0.0%) | 0 (0.0%) |
| 65 to 74 Years | 0 (0.0%) | 7 (30.4%) |
| 75 Years and over | 0 (0.0%) | 0 (0.0%) |
Disability Class by Sex by Age in Glacier
Disability Class: Hearing Difficulty
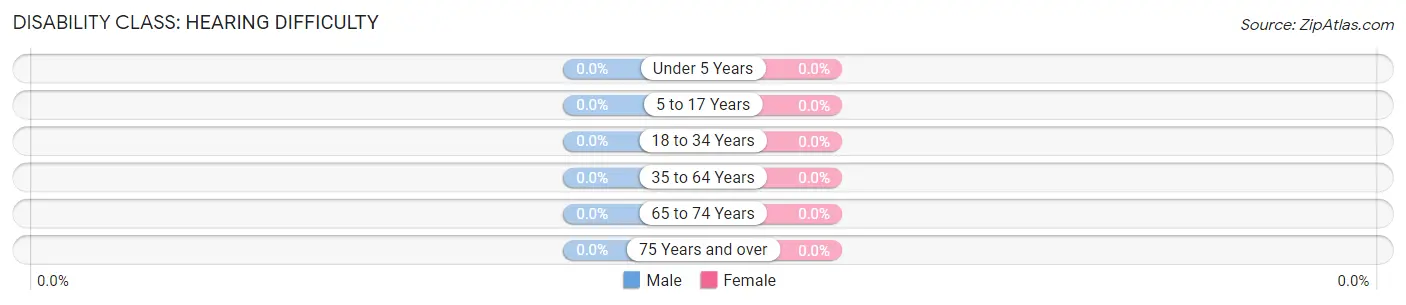
| Age Bracket | Male | Female |
| Under 5 Years | 0 (0.0%) | 0 (0.0%) |
| 5 to 17 Years | 0 (0.0%) | 0 (0.0%) |
| 18 to 34 Years | 0 (0.0%) | 0 (0.0%) |
| 35 to 64 Years | 0 (0.0%) | 0 (0.0%) |
| 65 to 74 Years | 0 (0.0%) | 0 (0.0%) |
| 75 Years and over | 0 (0.0%) | 0 (0.0%) |
Disability Class: Vision Difficulty
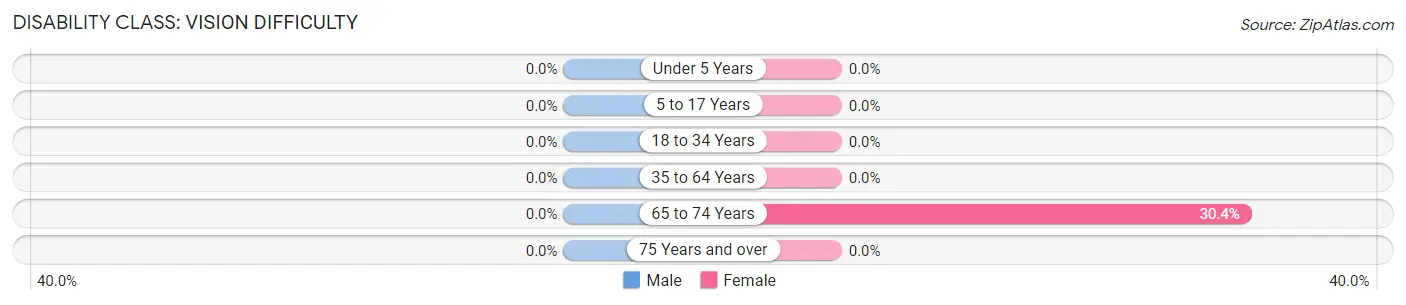
| Age Bracket | Male | Female |
| Under 5 Years | 0 (0.0%) | 0 (0.0%) |
| 5 to 17 Years | 0 (0.0%) | 0 (0.0%) |
| 18 to 34 Years | 0 (0.0%) | 0 (0.0%) |
| 35 to 64 Years | 0 (0.0%) | 0 (0.0%) |
| 65 to 74 Years | 0 (0.0%) | 7 (30.4%) |
| 75 Years and over | 0 (0.0%) | 0 (0.0%) |
Disability Class: Cognitive Difficulty
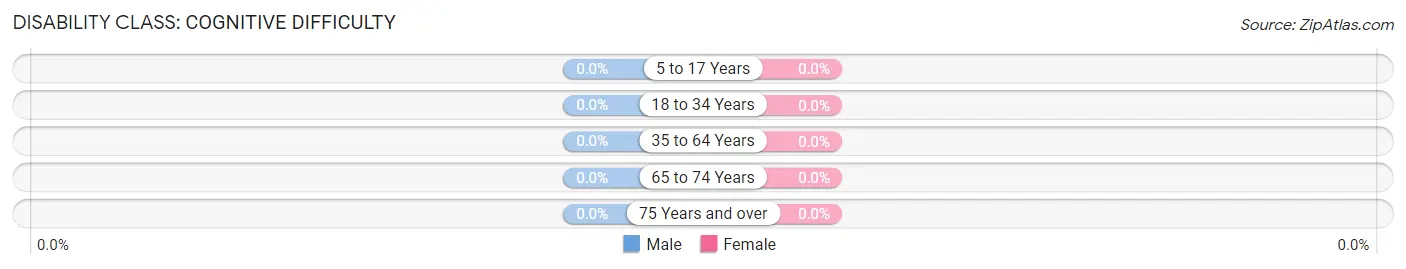
| Age Bracket | Male | Female |
| 5 to 17 Years | 0 (0.0%) | 0 (0.0%) |
| 18 to 34 Years | 0 (0.0%) | 0 (0.0%) |
| 35 to 64 Years | 0 (0.0%) | 0 (0.0%) |
| 65 to 74 Years | 0 (0.0%) | 0 (0.0%) |
| 75 Years and over | 0 (0.0%) | 0 (0.0%) |
Disability Class: Ambulatory Difficulty

| Age Bracket | Male | Female |
| 5 to 17 Years | 0 (0.0%) | 0 (0.0%) |
| 18 to 34 Years | 0 (0.0%) | 0 (0.0%) |
| 35 to 64 Years | 0 (0.0%) | 0 (0.0%) |
| 65 to 74 Years | 0 (0.0%) | 7 (30.4%) |
| 75 Years and over | 0 (0.0%) | 0 (0.0%) |
Disability Class: Self-Care Difficulty
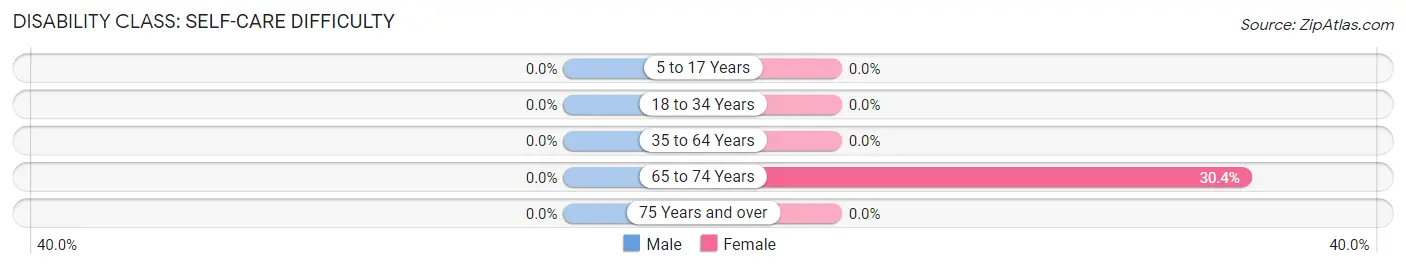
| Age Bracket | Male | Female |
| 5 to 17 Years | 0 (0.0%) | 0 (0.0%) |
| 18 to 34 Years | 0 (0.0%) | 0 (0.0%) |
| 35 to 64 Years | 0 (0.0%) | 0 (0.0%) |
| 65 to 74 Years | 0 (0.0%) | 7 (30.4%) |
| 75 Years and over | 0 (0.0%) | 0 (0.0%) |
Technology Access in Glacier
Computing Device Access in Glacier
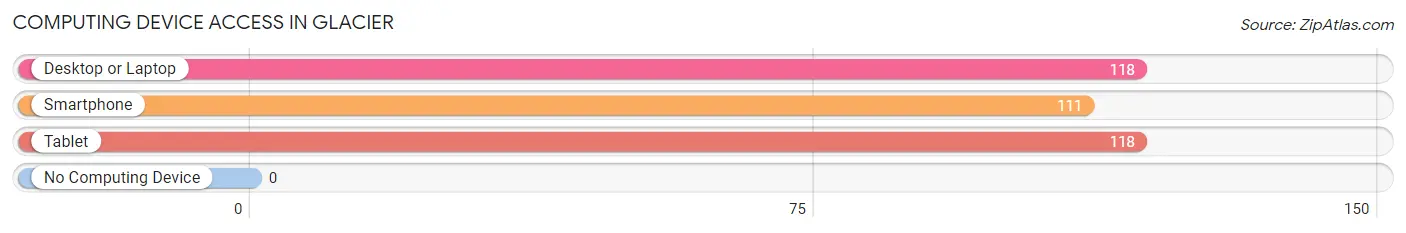
| Device Type | # Households | % Households |
| Desktop or Laptop | 118 | 100.0% |
| Smartphone | 111 | 94.1% |
| Tablet | 118 | 100.0% |
| No Computing Device | 0 | 0.0% |
| Total | 118 | 100.0% |
Internet Access in Glacier
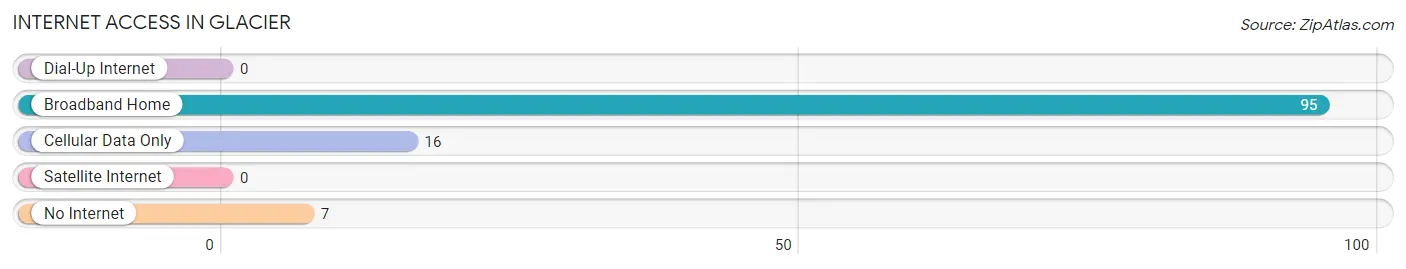
| Internet Type | # Households | % Households |
| Dial-Up Internet | 0 | 0.0% |
| Broadband Home | 95 | 80.5% |
| Cellular Data Only | 16 | 13.6% |
| Satellite Internet | 0 | 0.0% |
| No Internet | 7 | 5.9% |
| Total | 118 | 100.0% |
Glacier Summary
Glacier, Washington is a small town located in Whatcom County, Washington, United States. It is situated on the banks of the Nooksack River, approximately 20 miles east of Bellingham. The town was founded in 1891 and was originally known as Nooksack City. The name was changed to Glacier in 1895, after the nearby glacier.
Geography
Glacier is located in the foothills of the Cascade Mountains, at an elevation of 1,000 feet. The town is surrounded by lush forests and is home to several small lakes, including Lake Shannon and Lake Whatcom. The Nooksack River runs through the town, providing a source of recreation and fishing. The climate in Glacier is mild, with temperatures ranging from the mid-30s in the winter to the mid-70s in the summer.
Economy
The economy of Glacier is largely based on tourism and recreation. The town is home to several ski resorts, including Mount Baker Ski Area and Mount Shuksan Ski Area. The town also has several restaurants, shops, and lodging options. In addition, the town is home to several small businesses, including a lumber mill, a sawmill, and a logging company.
Demographics
As of the 2010 census, the population of Glacier was 1,845. The racial makeup of the town was 94.3% White, 0.7% African American, 0.7% Native American, 0.7% Asian, 0.2% Pacific Islander, 0.7% from other races, and 2.4% from two or more races. The median household income was $45,000, and the median family income was $50,000.
History
Glacier was founded in 1891 by a group of settlers from the Midwest. The town was originally known as Nooksack City, but the name was changed to Glacier in 1895. The town was initially a logging and lumber town, but it soon became a popular tourist destination. In the early 1900s, the town was home to several ski resorts, including Mount Baker Ski Area and Mount Shuksan Ski Area. The town also had several restaurants, shops, and lodging options.
In the 1950s, Glacier began to experience a decline in population as people moved away from the area. However, in the late 1970s, the town began to experience a resurgence in popularity as people began to move back to the area. Today, Glacier is a popular tourist destination, with several ski resorts, restaurants, shops, and lodging options.
Common Questions
What is Per Capita Income in Glacier?
Per Capita income in Glacier is $24,057.
What is the Median Household income in Glacier?
Median Household Income in Glacier is $30,714.
What is Inequality or Gini Index in Glacier?
Inequality or Gini Index in Glacier is 0.47.
What is the Total Population of Glacier?
Total Population of Glacier is 241.
What is the Total Male Population of Glacier?
Total Male Population of Glacier is 168.
What is the Total Female Population of Glacier?
Total Female Population of Glacier is 73.
What is the Ratio of Males per 100 Females in Glacier?
There are 230.14 Males per 100 Females in Glacier.
What is the Ratio of Females per 100 Males in Glacier?
There are 43.45 Females per 100 Males in Glacier.
What is the Median Population Age in Glacier?
Median Population Age in Glacier is 44.2 Years.
What is the Average Family Size in Glacier
Average Family Size in Glacier is 2.1 People.
What is the Average Household Size in Glacier
Average Household Size in Glacier is 2.0 People.
How Large is the Labor Force in Glacier?
There are 219 People in the Labor Forcein in Glacier.
What is the Percentage of People in the Labor Force in Glacier?
90.9% of People are in the Labor Force in Glacier.