Darrington, WA Map & Demographics
Darrington Map
Darrington Overview
$29,540
PER CAPITA INCOME
$69,028
AVG FAMILY INCOME
$48,750
AVG HOUSEHOLD INCOME
59.6%
WAGE / INCOME GAP [ % ]
40.4¢/ $1
WAGE / INCOME GAP [ $ ]
0.42
INEQUALITY / GINI INDEX
1,233
TOTAL POPULATION
636
MALE POPULATION
597
FEMALE POPULATION
106.53
MALES / 100 FEMALES
93.87
FEMALES / 100 MALES
45.0
MEDIAN AGE
2.8
AVG FAMILY SIZE
2.2
AVG HOUSEHOLD SIZE
500
LABOR FORCE [ PEOPLE ]
48.2%
PERCENT IN LABOR FORCE
13.8%
UNEMPLOYMENT RATE
Darrington Zip Codes
Darrington Area Codes
Income in Darrington
Income Overview in Darrington
Per Capita Income in Darrington is $29,540, while median incomes of families and households are $69,028 and $48,750 respectively.
| Characteristic | Number | Measure |
| Per Capita Income | 1,233 | $29,540 |
| Median Family Income | 302 | $69,028 |
| Mean Family Income | 302 | $79,432 |
| Median Household Income | 566 | $48,750 |
| Mean Household Income | 566 | $63,763 |
| Income Deficit | 302 | $0 |
| Wage / Income Gap (%) | 1,233 | 59.63% |
| Wage / Income Gap ($) | 1,233 | 40.37¢ per $1 |
| Gini / Inequality Index | 1,233 | 0.42 |
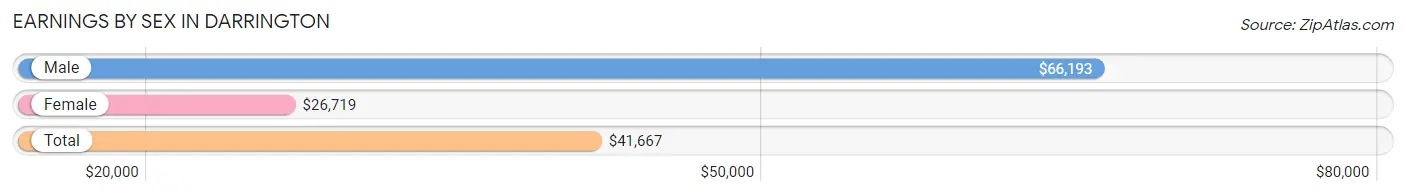
Earnings by Sex in Darrington
Average Earnings in Darrington are $41,667, $66,193 for men and $26,719 for women, a difference of 59.6%.
| Sex | Number | Average Earnings |
| Male | 265 (53.4%) | $66,193 |
| Female | 231 (46.6%) | $26,719 |
| Total | 496 (100.0%) | $41,667 |
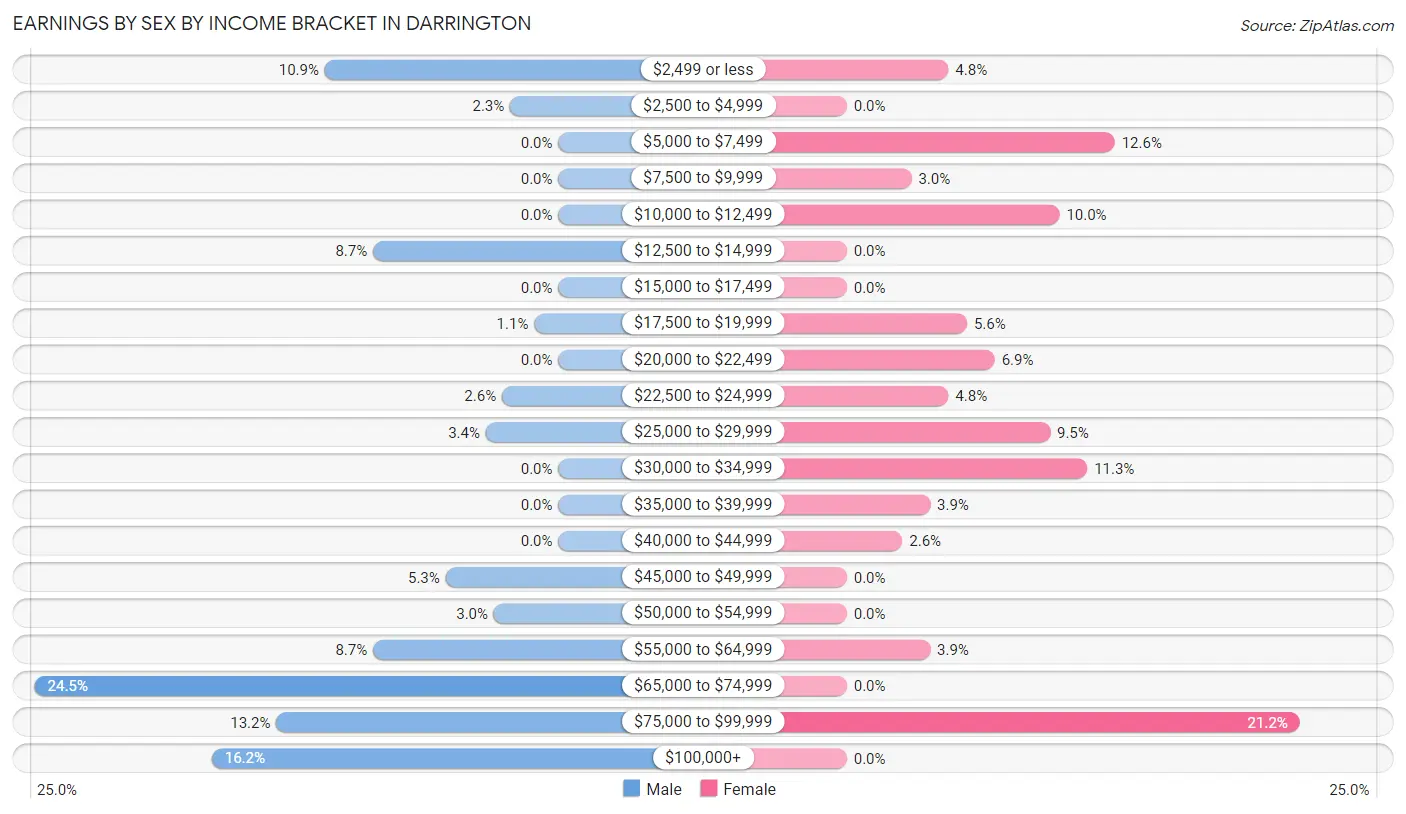
Earnings by Sex by Income Bracket in Darrington
The most common earnings brackets in Darrington are $65,000 to $74,999 for men (65 | 24.5%) and $75,000 to $99,999 for women (49 | 21.2%).
| Income | Male | Female |
| $2,499 or less | 29 (10.9%) | 11 (4.8%) |
| $2,500 to $4,999 | 6 (2.3%) | 0 (0.0%) |
| $5,000 to $7,499 | 0 (0.0%) | 29 (12.6%) |
| $7,500 to $9,999 | 0 (0.0%) | 7 (3.0%) |
| $10,000 to $12,499 | 0 (0.0%) | 23 (10.0%) |
| $12,500 to $14,999 | 23 (8.7%) | 0 (0.0%) |
| $15,000 to $17,499 | 0 (0.0%) | 0 (0.0%) |
| $17,500 to $19,999 | 3 (1.1%) | 13 (5.6%) |
| $20,000 to $22,499 | 0 (0.0%) | 16 (6.9%) |
| $22,500 to $24,999 | 7 (2.6%) | 11 (4.8%) |
| $25,000 to $29,999 | 9 (3.4%) | 22 (9.5%) |
| $30,000 to $34,999 | 0 (0.0%) | 26 (11.3%) |
| $35,000 to $39,999 | 0 (0.0%) | 9 (3.9%) |
| $40,000 to $44,999 | 0 (0.0%) | 6 (2.6%) |
| $45,000 to $49,999 | 14 (5.3%) | 0 (0.0%) |
| $50,000 to $54,999 | 8 (3.0%) | 0 (0.0%) |
| $55,000 to $64,999 | 23 (8.7%) | 9 (3.9%) |
| $65,000 to $74,999 | 65 (24.5%) | 0 (0.0%) |
| $75,000 to $99,999 | 35 (13.2%) | 49 (21.2%) |
| $100,000+ | 43 (16.2%) | 0 (0.0%) |
| Total | 265 (100.0%) | 231 (100.0%) |
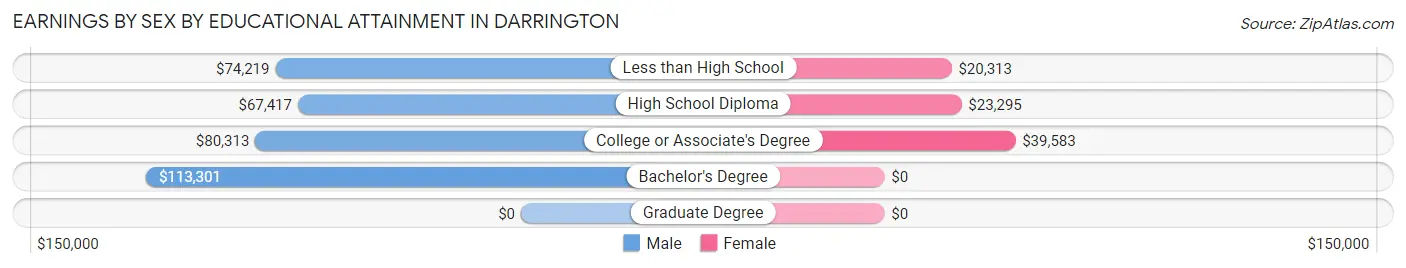
Earnings by Sex by Educational Attainment in Darrington
Average earnings in Darrington are $68,200 for men and $27,679 for women, a difference of 59.4%. Men with an educational attainment of bachelor's degree enjoy the highest average annual earnings of $113,301, while those with high school diploma education earn the least with $67,417. Women with an educational attainment of college or associate's degree earn the most with the average annual earnings of $39,583, while those with less than high school education have the smallest earnings of $20,313.
| Educational Attainment | Male Income | Female Income |
| Less than High School | $74,219 | $20,313 |
| High School Diploma | $67,417 | $23,295 |
| College or Associate's Degree | $80,313 | $39,583 |
| Bachelor's Degree | $113,301 | $0 |
| Graduate Degree | - | - |
| Total | $68,200 | $27,679 |
Family Income in Darrington
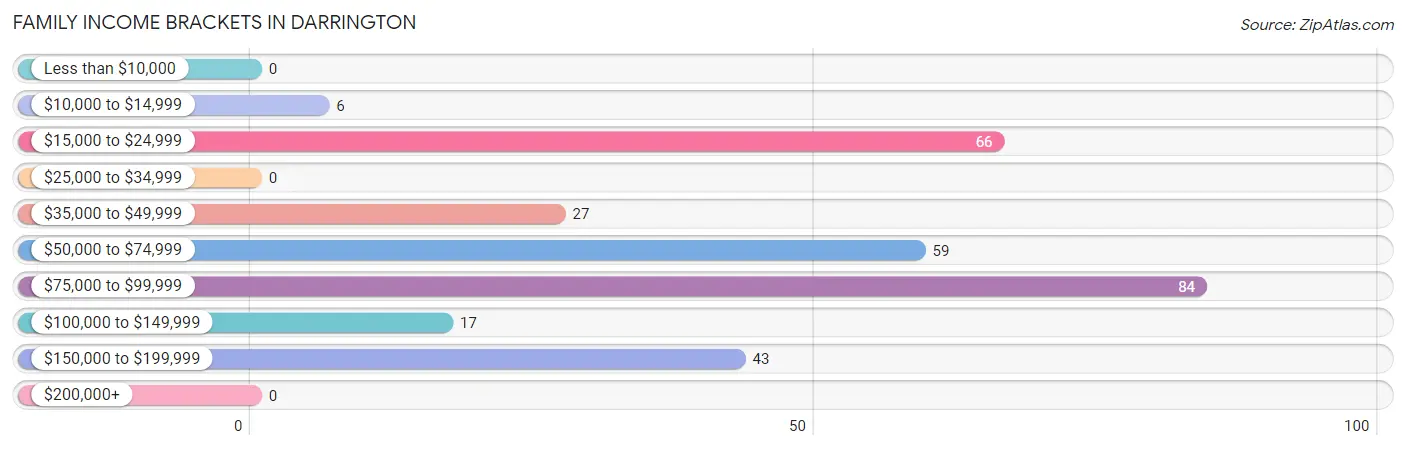
Family Income Brackets in Darrington
According to the Darrington family income data, there are 84 families falling into the $75,000 to $99,999 income range, which is the most common income bracket and makes up 27.8% of all families.
| Income Bracket | # Families | % Families |
| Less than $10,000 | 0 | 0.0% |
| $10,000 to $14,999 | 6 | 2.0% |
| $15,000 to $24,999 | 66 | 21.9% |
| $25,000 to $34,999 | 0 | 0.0% |
| $35,000 to $49,999 | 27 | 8.9% |
| $50,000 to $74,999 | 59 | 19.5% |
| $75,000 to $99,999 | 84 | 27.8% |
| $100,000 to $149,999 | 17 | 5.6% |
| $150,000 to $199,999 | 43 | 14.2% |
| $200,000+ | 0 | 0.0% |
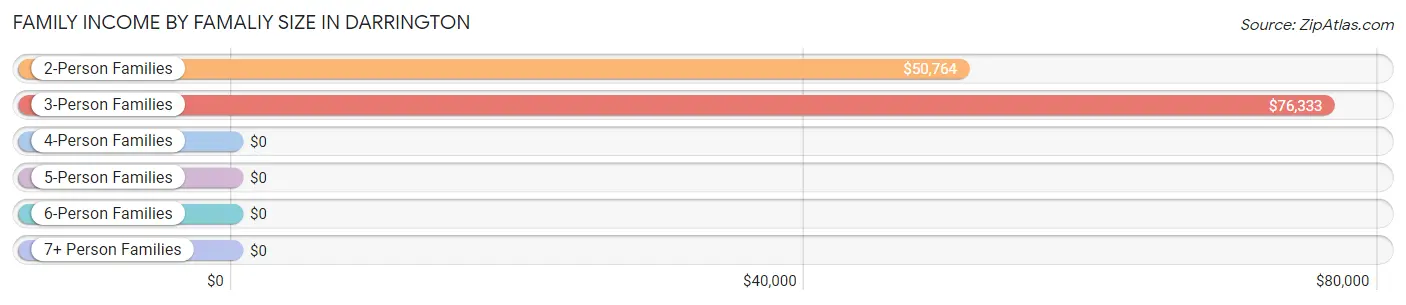
Family Income by Famaliy Size in Darrington
3-person families (42 | 13.9%) account for the highest median family income in Darrington with $76,333 per family, while 3-person families (42 | 13.9%) have the highest median income of $25,444 per family member.
| Income Bracket | # Families | Median Income |
| 2-Person Families | 151 (50.0%) | $50,764 |
| 3-Person Families | 42 (13.9%) | $76,333 |
| 4-Person Families | 95 (31.5%) | $0 |
| 5-Person Families | 14 (4.6%) | $0 |
| 6-Person Families | 0 (0.0%) | $0 |
| 7+ Person Families | 0 (0.0%) | $0 |
| Total | 302 (100.0%) | $69,028 |
Family Income by Number of Earners in Darrington
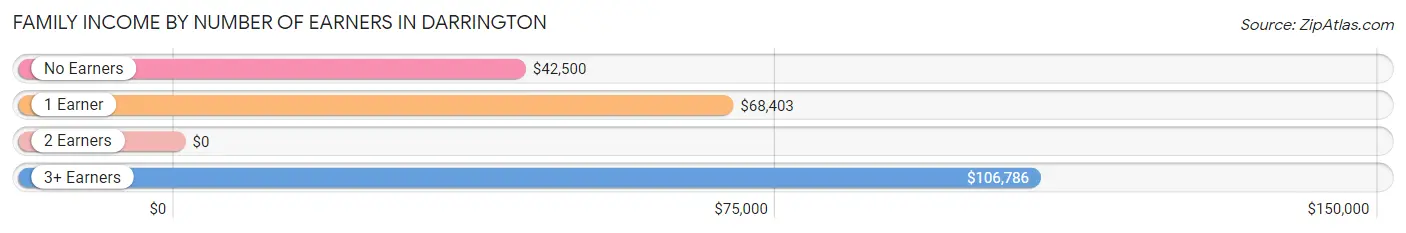
| Number of Earners | # Families | Median Income |
| No Earners | 72 (23.8%) | $42,500 |
| 1 Earner | 101 (33.4%) | $68,403 |
| 2 Earners | 105 (34.8%) | $0 |
| 3+ Earners | 24 (8.0%) | $106,786 |
| Total | 302 (100.0%) | $69,028 |
Household Income in Darrington
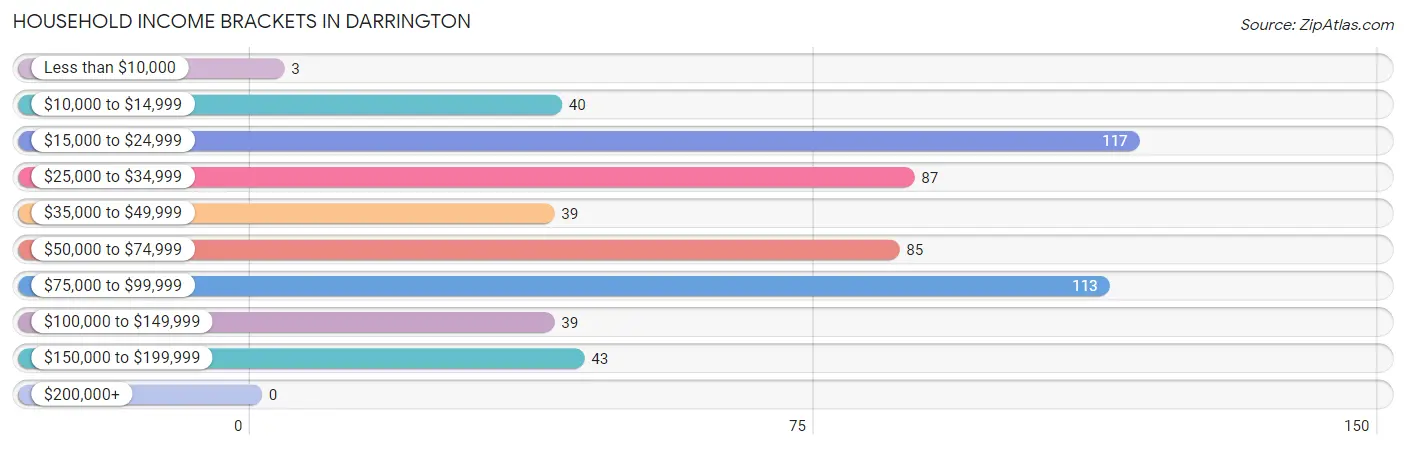
Household Income Brackets in Darrington
With 117 households falling in the category, the $15,000 to $24,999 income range is the most frequent in Darrington, accounting for 20.7% of all households.
| Income Bracket | # Households | % Households |
| Less than $10,000 | 3 | 0.5% |
| $10,000 to $14,999 | 40 | 7.1% |
| $15,000 to $24,999 | 117 | 20.7% |
| $25,000 to $34,999 | 87 | 15.4% |
| $35,000 to $49,999 | 39 | 6.9% |
| $50,000 to $74,999 | 85 | 15.0% |
| $75,000 to $99,999 | 113 | 20.0% |
| $100,000 to $149,999 | 39 | 6.9% |
| $150,000 to $199,999 | 43 | 7.6% |
| $200,000+ | 0 | 0.0% |
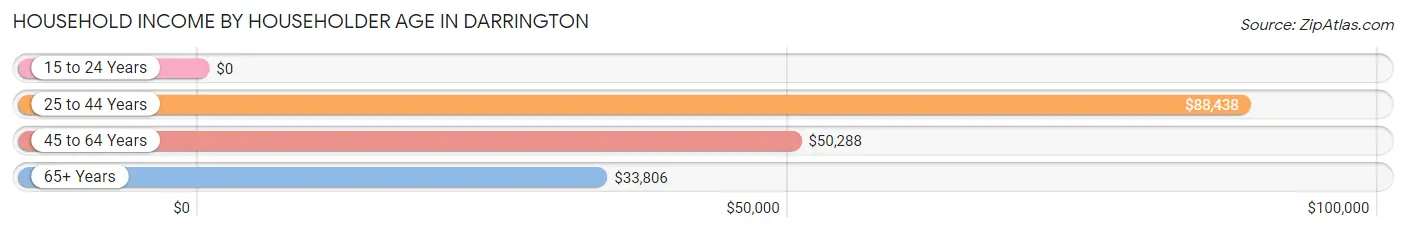
Household Income by Householder Age in Darrington
The median household income in Darrington is $48,750, with the highest median household income of $88,438 found in the 25 to 44 years age bracket for the primary householder. A total of 151 households (26.7%) fall into this category. Meanwhile, the 15 to 24 years age bracket for the primary householder has the lowest median household income of $0, with 8 households (1.4%) in this group.
| Income Bracket | # Households | Median Income |
| 15 to 24 Years | 8 (1.4%) | $0 |
| 25 to 44 Years | 151 (26.7%) | $88,438 |
| 45 to 64 Years | 149 (26.3%) | $50,288 |
| 65+ Years | 258 (45.6%) | $33,806 |
| Total | 566 (100.0%) | $48,750 |
Poverty in Darrington
Income Below Poverty by Sex and Age in Darrington
With 22.3% poverty level for males and 15.0% for females among the residents of Darrington, 6 to 11 year old males and 45 to 54 year old females are the most vulnerable to poverty, with 42 males (89.4%) and 14 females (32.6%) in their respective age groups living below the poverty level.
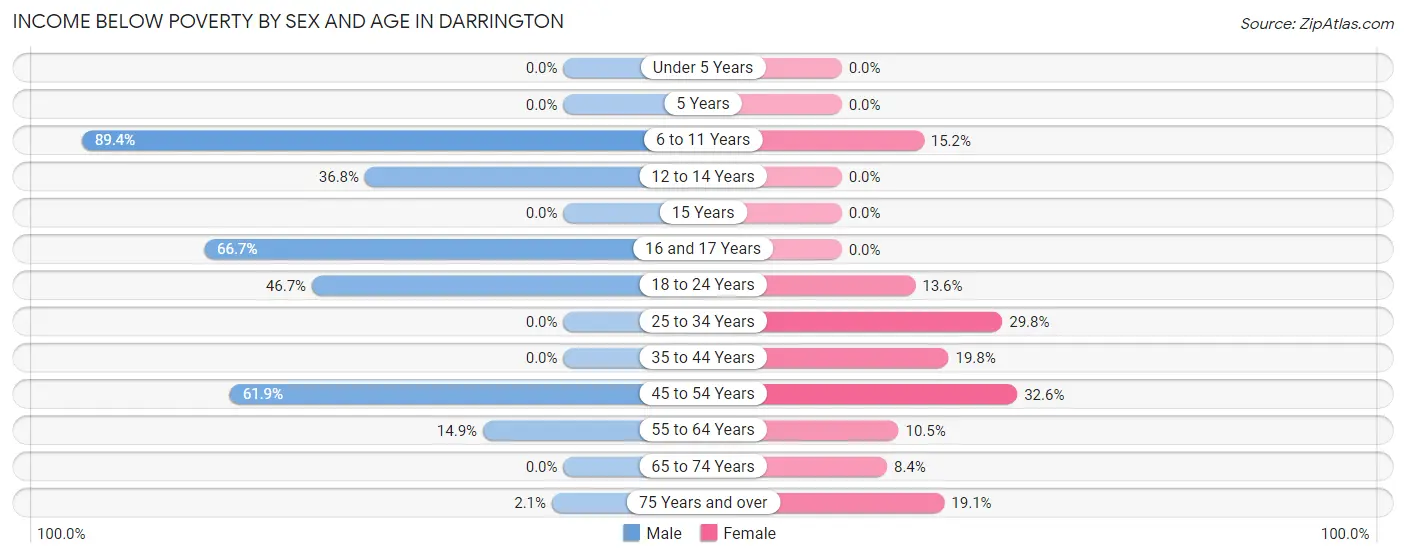
| Age Bracket | Male | Female |
| Under 5 Years | 0 (0.0%) | 0 (0.0%) |
| 5 Years | 0 (0.0%) | 0 (0.0%) |
| 6 to 11 Years | 42 (89.4%) | 7 (15.2%) |
| 12 to 14 Years | 7 (36.8%) | 0 (0.0%) |
| 15 Years | 0 (0.0%) | 0 (0.0%) |
| 16 and 17 Years | 22 (66.7%) | 0 (0.0%) |
| 18 to 24 Years | 7 (46.7%) | 6 (13.6%) |
| 25 to 34 Years | 0 (0.0%) | 14 (29.8%) |
| 35 to 44 Years | 0 (0.0%) | 22 (19.8%) |
| 45 to 54 Years | 52 (61.9%) | 14 (32.6%) |
| 55 to 64 Years | 10 (14.9%) | 6 (10.5%) |
| 65 to 74 Years | 0 (0.0%) | 11 (8.4%) |
| 75 Years and over | 2 (2.1%) | 8 (19.1%) |
| Total | 142 (22.3%) | 88 (15.0%) |
Income Above Poverty by Sex and Age in Darrington
According to the poverty statistics in Darrington, males aged under 5 years and females aged under 5 years are the age groups that are most secure financially, with 100.0% of males and 100.0% of females in these age groups living above the poverty line.
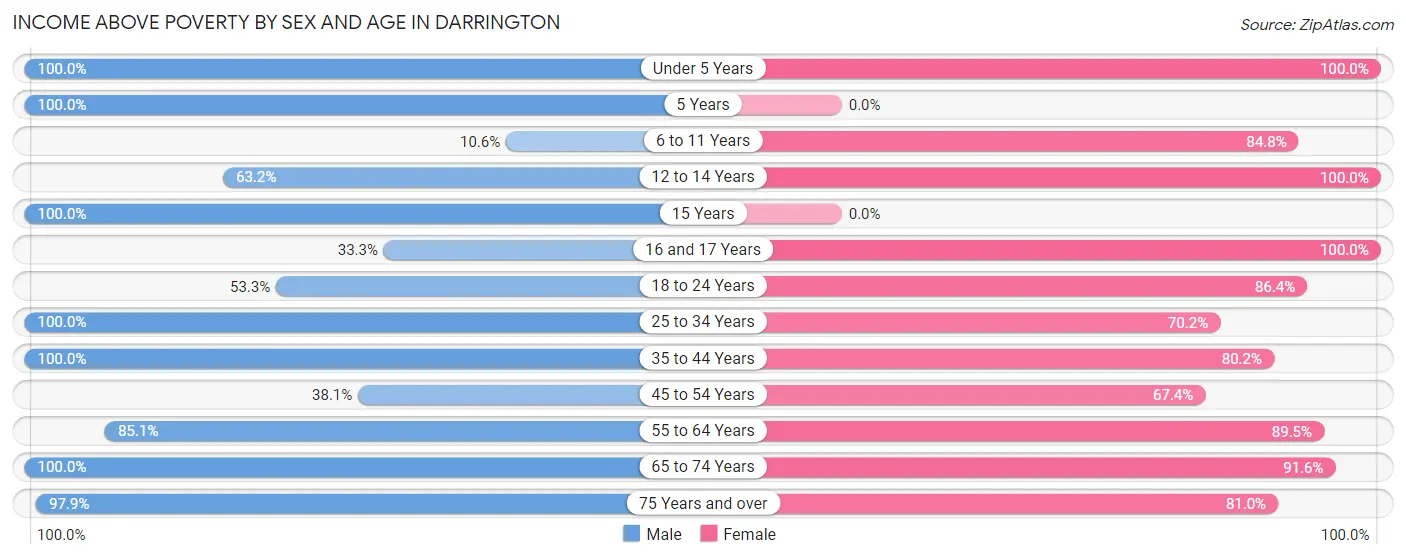
| Age Bracket | Male | Female |
| Under 5 Years | 26 (100.0%) | 10 (100.0%) |
| 5 Years | 10 (100.0%) | 0 (0.0%) |
| 6 to 11 Years | 5 (10.6%) | 39 (84.8%) |
| 12 to 14 Years | 12 (63.2%) | 34 (100.0%) |
| 15 Years | 4 (100.0%) | 0 (0.0%) |
| 16 and 17 Years | 11 (33.3%) | 21 (100.0%) |
| 18 to 24 Years | 8 (53.3%) | 38 (86.4%) |
| 25 to 34 Years | 90 (100.0%) | 33 (70.2%) |
| 35 to 44 Years | 59 (100.0%) | 89 (80.2%) |
| 45 to 54 Years | 32 (38.1%) | 29 (67.4%) |
| 55 to 64 Years | 57 (85.1%) | 51 (89.5%) |
| 65 to 74 Years | 88 (100.0%) | 120 (91.6%) |
| 75 Years and over | 92 (97.9%) | 34 (80.9%) |
| Total | 494 (77.7%) | 498 (85.0%) |
Income Below Poverty Among Married-Couple Families in Darrington
The poverty statistics for married-couple families in Darrington show that 4.1% or 8 of the total 197 families live below the poverty line. Families with 1 or 2 children have the highest poverty rate of 7.4%, comprising of 6 families. On the other hand, families with 3 or 4 children have the lowest poverty rate of 0.0%, which includes 0 families.
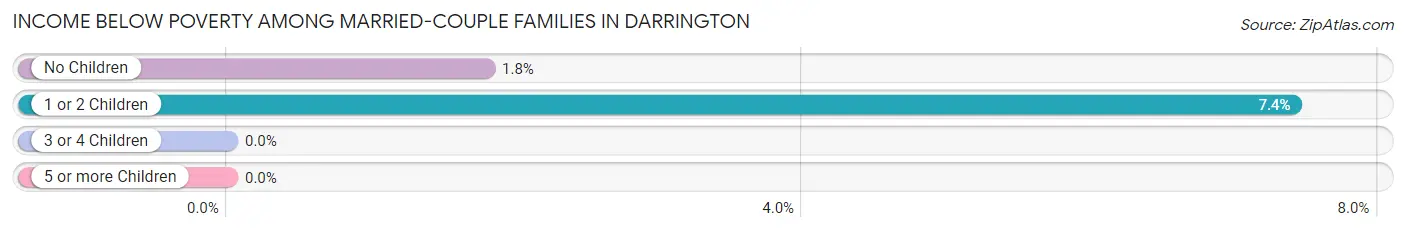
| Children | Above Poverty | Below Poverty |
| No Children | 110 (98.2%) | 2 (1.8%) |
| 1 or 2 Children | 75 (92.6%) | 6 (7.4%) |
| 3 or 4 Children | 4 (100.0%) | 0 (0.0%) |
| 5 or more Children | 0 (0.0%) | 0 (0.0%) |
| Total | 189 (95.9%) | 8 (4.1%) |
Income Below Poverty Among Single-Parent Households in Darrington
According to the poverty data in Darrington, 39.7% or 23 single-father households and 21.3% or 10 single-mother households are living below the poverty line. Among single-father households, those with 3 or 4 children have the highest poverty rate, with 23 households (100.0%) experiencing poverty. Likewise, among single-mother households, those with no children have the highest poverty rate, with 10 households (40.0%) falling below the poverty line.
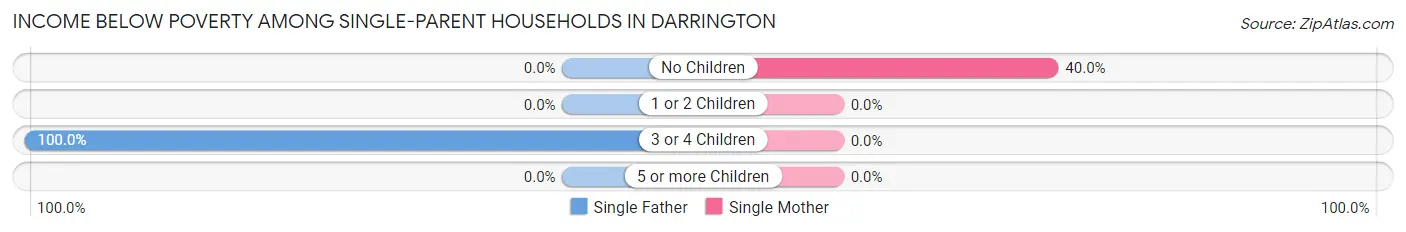
| Children | Single Father | Single Mother |
| No Children | 0 (0.0%) | 10 (40.0%) |
| 1 or 2 Children | 0 (0.0%) | 0 (0.0%) |
| 3 or 4 Children | 23 (100.0%) | 0 (0.0%) |
| 5 or more Children | 0 (0.0%) | 0 (0.0%) |
| Total | 23 (39.7%) | 10 (21.3%) |
Income Below Poverty Among Married-Couple vs Single-Parent Households in Darrington
The poverty data for Darrington shows that 8 of the married-couple family households (4.1%) and 33 of the single-parent households (31.4%) are living below the poverty level. Within the married-couple family households, those with 1 or 2 children have the highest poverty rate, with 6 households (7.4%) falling below the poverty line. Among the single-parent households, those with 3 or 4 children have the highest poverty rate, with 23 household (100.0%) living below poverty.
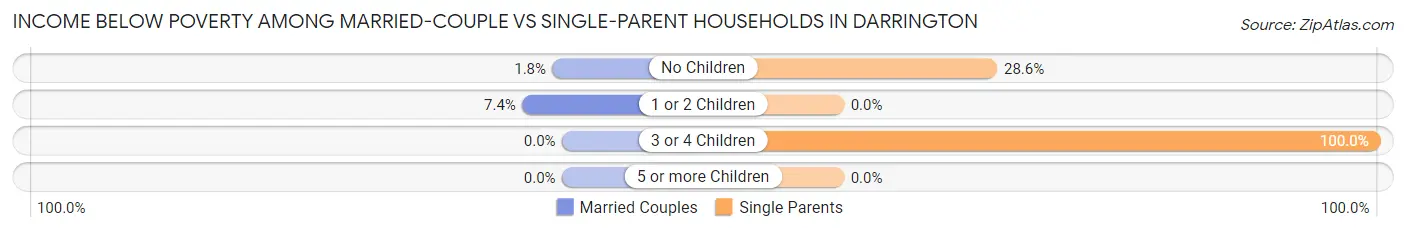
| Children | Married-Couple Families | Single-Parent Households |
| No Children | 2 (1.8%) | 10 (28.6%) |
| 1 or 2 Children | 6 (7.4%) | 0 (0.0%) |
| 3 or 4 Children | 0 (0.0%) | 23 (100.0%) |
| 5 or more Children | 0 (0.0%) | 0 (0.0%) |
| Total | 8 (4.1%) | 33 (31.4%) |
Race in Darrington
The most populous races in Darrington are White / Caucasian (1,145 | 92.9%), Hispanic or Latino (106 | 8.6%), and Two or more Races (61 | 5.0%).
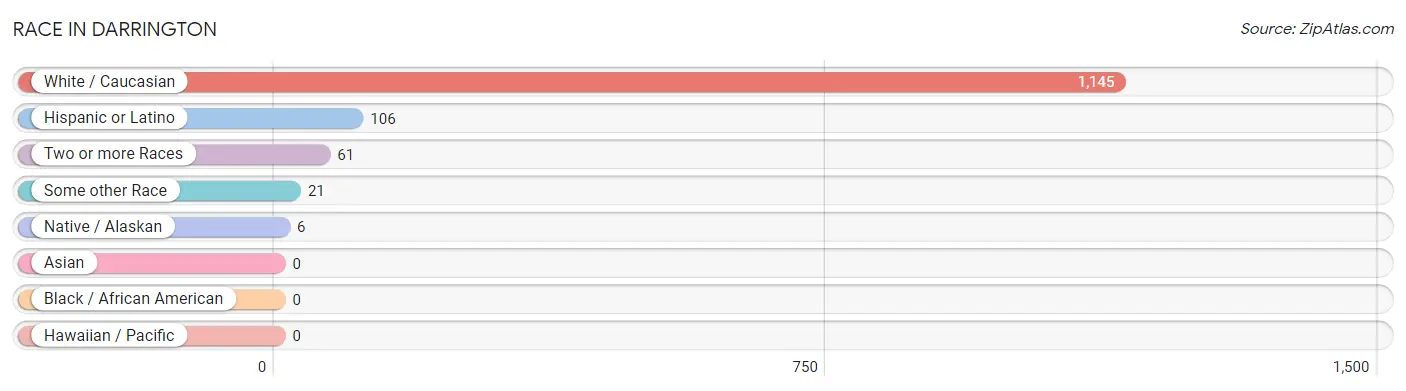
| Race | # Population | % Population |
| Asian | 0 | 0.0% |
| Black / African American | 0 | 0.0% |
| Hawaiian / Pacific | 0 | 0.0% |
| Hispanic or Latino | 106 | 8.6% |
| Native / Alaskan | 6 | 0.5% |
| White / Caucasian | 1,145 | 92.9% |
| Two or more Races | 61 | 5.0% |
| Some other Race | 21 | 1.7% |
| Total | 1,233 | 100.0% |
Ancestry in Darrington
The most populous ancestries reported in Darrington are German (241 | 19.6%), Irish (221 | 17.9%), English (150 | 12.2%), Norwegian (117 | 9.5%), and Scottish (117 | 9.5%), together accounting for 68.6% of all Darrington residents.
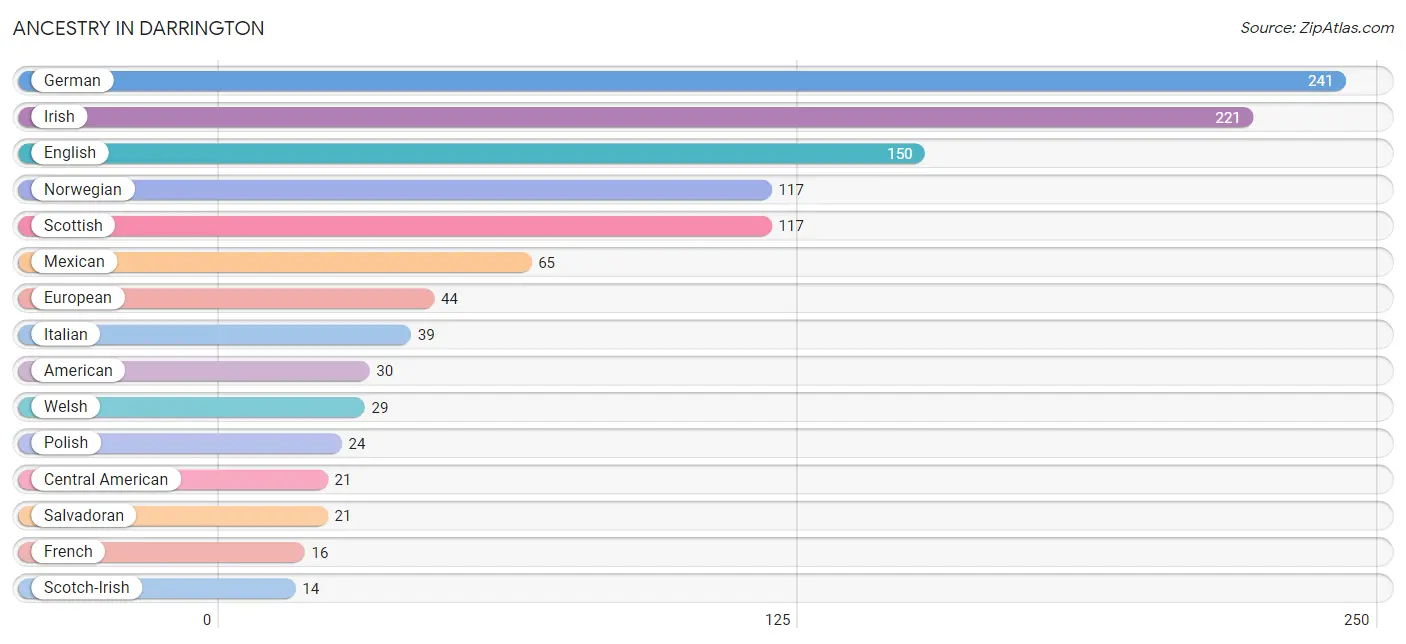
| Ancestry | # Population | % Population |
| African | 3 | 0.2% |
| Aleut | 1 | 0.1% |
| American | 30 | 2.4% |
| British | 8 | 0.6% |
| Central American | 21 | 1.7% |
| Colville | 1 | 0.1% |
| Danish | 6 | 0.5% |
| Dutch | 2 | 0.2% |
| English | 150 | 12.2% |
| European | 44 | 3.6% |
| Finnish | 13 | 1.1% |
| French | 16 | 1.3% |
| German | 241 | 19.6% |
| Irish | 221 | 17.9% |
| Italian | 39 | 3.2% |
| Mexican | 65 | 5.3% |
| Norwegian | 117 | 9.5% |
| Polish | 24 | 1.9% |
| Portuguese | 7 | 0.6% |
| Puget Sound Salish | 4 | 0.3% |
| Salvadoran | 21 | 1.7% |
| Scotch-Irish | 14 | 1.1% |
| Scottish | 117 | 9.5% |
| Spaniard | 13 | 1.1% |
| Spanish | 7 | 0.6% |
| Subsaharan African | 3 | 0.2% |
| Swedish | 4 | 0.3% |
| Swiss | 13 | 1.1% |
| Ukrainian | 7 | 0.6% |
| Welsh | 29 | 2.4% | View All 30 Rows |
Immigrants in Darrington
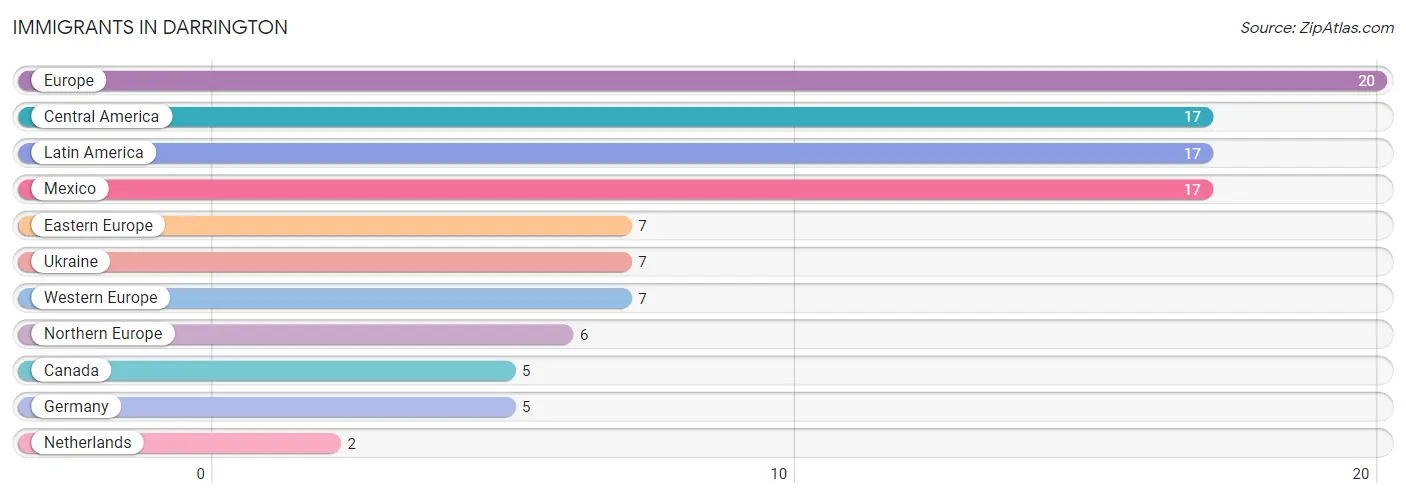
The most numerous immigrant groups reported in Darrington came from Europe (20 | 1.6%), Central America (17 | 1.4%), Latin America (17 | 1.4%), Mexico (17 | 1.4%), and Eastern Europe (7 | 0.6%), together accounting for 6.3% of all Darrington residents.
| Immigration Origin | # Population | % Population |
| Canada | 5 | 0.4% |
| Central America | 17 | 1.4% |
| Eastern Europe | 7 | 0.6% |
| Europe | 20 | 1.6% |
| Germany | 5 | 0.4% |
| Latin America | 17 | 1.4% |
| Mexico | 17 | 1.4% |
| Netherlands | 2 | 0.2% |
| Northern Europe | 6 | 0.5% |
| Ukraine | 7 | 0.6% |
| Western Europe | 7 | 0.6% | View All 11 Rows |
Sex and Age in Darrington
Sex and Age in Darrington
The most populous age groups in Darrington are 80 to 84 Years (74 | 11.6%) for men and 10 to 14 Years (73 | 12.2%) for women.
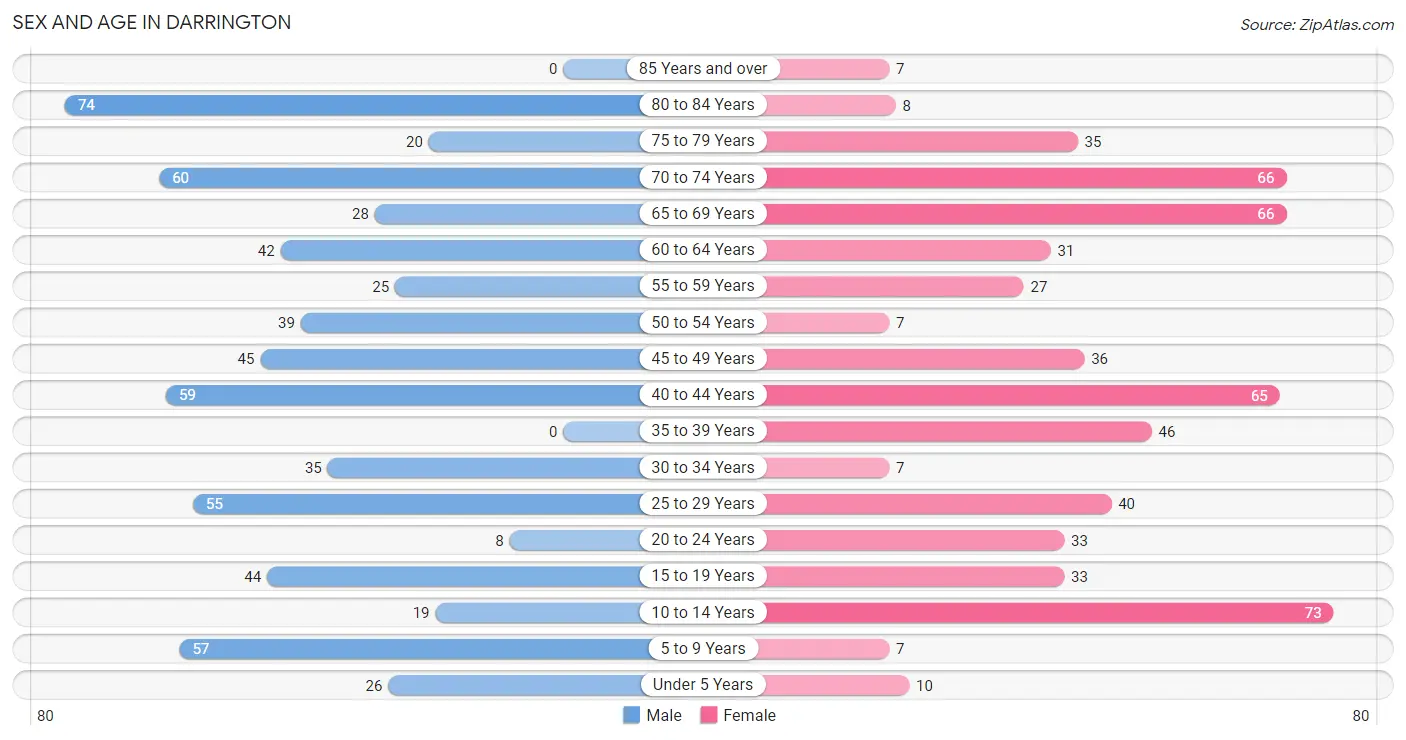
| Age Bracket | Male | Female |
| Under 5 Years | 26 (4.1%) | 10 (1.7%) |
| 5 to 9 Years | 57 (9.0%) | 7 (1.2%) |
| 10 to 14 Years | 19 (3.0%) | 73 (12.2%) |
| 15 to 19 Years | 44 (6.9%) | 33 (5.5%) |
| 20 to 24 Years | 8 (1.3%) | 33 (5.5%) |
| 25 to 29 Years | 55 (8.6%) | 40 (6.7%) |
| 30 to 34 Years | 35 (5.5%) | 7 (1.2%) |
| 35 to 39 Years | 0 (0.0%) | 46 (7.7%) |
| 40 to 44 Years | 59 (9.3%) | 65 (10.9%) |
| 45 to 49 Years | 45 (7.1%) | 36 (6.0%) |
| 50 to 54 Years | 39 (6.1%) | 7 (1.2%) |
| 55 to 59 Years | 25 (3.9%) | 27 (4.5%) |
| 60 to 64 Years | 42 (6.6%) | 31 (5.2%) |
| 65 to 69 Years | 28 (4.4%) | 66 (11.1%) |
| 70 to 74 Years | 60 (9.4%) | 66 (11.1%) |
| 75 to 79 Years | 20 (3.1%) | 35 (5.9%) |
| 80 to 84 Years | 74 (11.6%) | 8 (1.3%) |
| 85 Years and over | 0 (0.0%) | 7 (1.2%) |
| Total | 636 (100.0%) | 597 (100.0%) |
Families and Households in Darrington
Median Family Size in Darrington
The median family size in Darrington is 2.83 persons per family, with single male/father families (58 | 19.2%) accounting for the largest median family size of 3.57 persons per family. On the other hand, single female/mother families (47 | 15.6%) represent the smallest median family size with 2.28 persons per family.
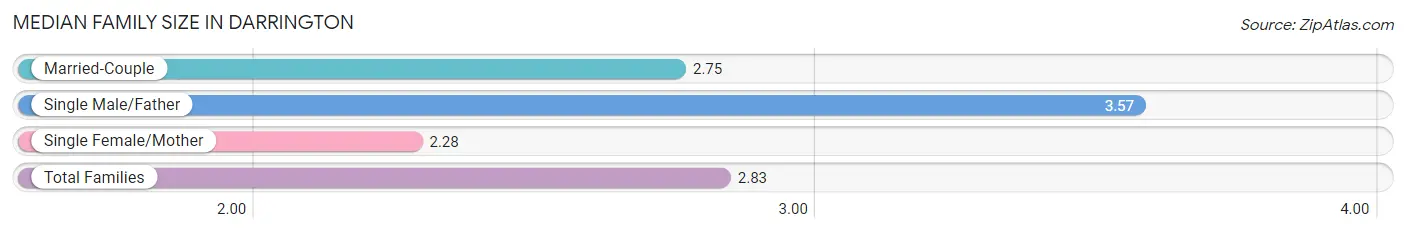
| Family Type | # Families | Family Size |
| Married-Couple | 197 (65.2%) | 2.75 |
| Single Male/Father | 58 (19.2%) | 3.57 |
| Single Female/Mother | 47 (15.6%) | 2.28 |
| Total Families | 302 (100.0%) | 2.83 |
Median Household Size in Darrington
The median household size in Darrington is 2.16 persons per household, with single male/father households (58 | 10.2%) accounting for the largest median household size of 3.67 persons per household. non-family households (264 | 46.6%) represent the smallest median household size with 1.37 persons per household.
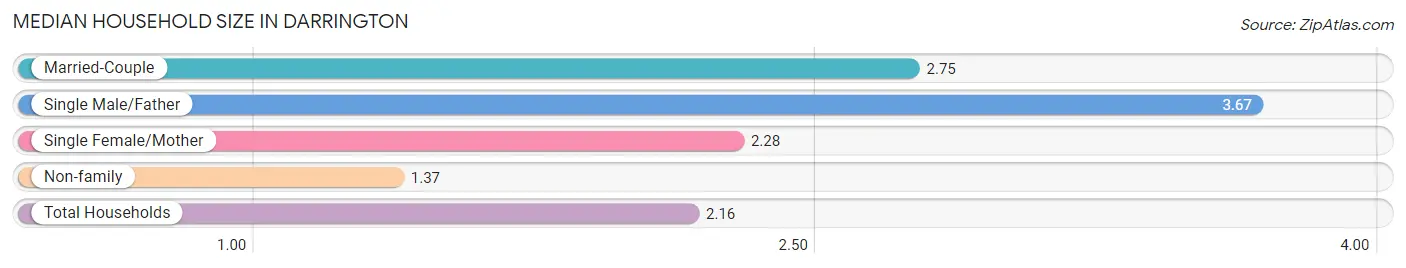
| Household Type | # Households | Household Size |
| Married-Couple | 197 (34.8%) | 2.75 |
| Single Male/Father | 58 (10.2%) | 3.67 |
| Single Female/Mother | 47 (8.3%) | 2.28 |
| Non-family | 264 (46.6%) | 1.37 |
| Total Households | 566 (100.0%) | 2.16 |
Household Size by Marriage Status in Darrington
Out of a total of 566 households in Darrington, 302 (53.4%) are family households, while 264 (46.6%) are nonfamily households. The most numerous type of family households are 2-person households, comprising 141, and the most common type of nonfamily households are 1-person households, comprising 201.
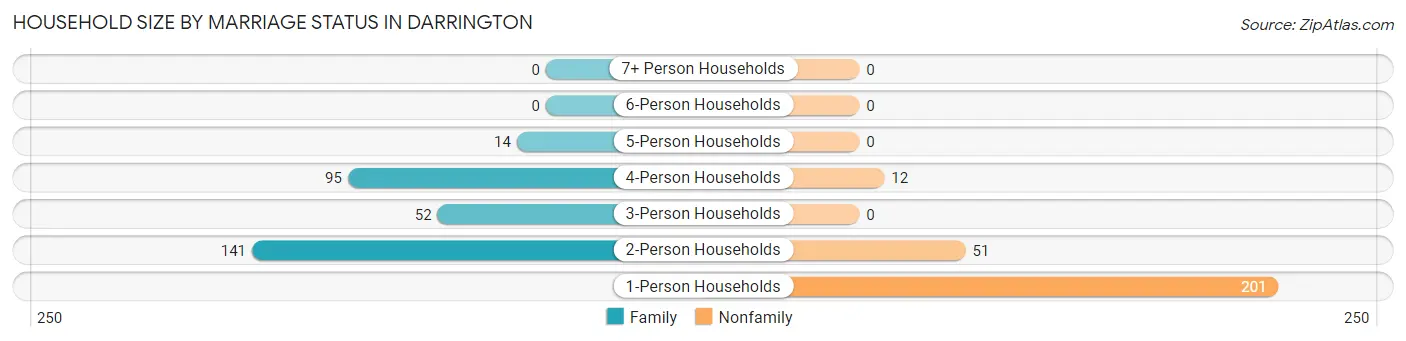
| Household Size | Family Households | Nonfamily Households |
| 1-Person Households | - | 201 (35.5%) |
| 2-Person Households | 141 (24.9%) | 51 (9.0%) |
| 3-Person Households | 52 (9.2%) | 0 (0.0%) |
| 4-Person Households | 95 (16.8%) | 12 (2.1%) |
| 5-Person Households | 14 (2.5%) | 0 (0.0%) |
| 6-Person Households | 0 (0.0%) | 0 (0.0%) |
| 7+ Person Households | 0 (0.0%) | 0 (0.0%) |
| Total | 302 (53.4%) | 264 (46.6%) |
Female Fertility in Darrington
Fertility by Age in Darrington
| Age Bracket | Women with Births | Births / 1,000 Women |
| 15 to 19 years | 0 (0.0%) | 0.0 |
| 20 to 34 years | 0 (0.0%) | 0.0 |
| 35 to 50 years | 0 (0.0%) | 0.0 |
| Total | 0 (0.0%) | 0.0 |
Fertility by Age by Marriage Status in Darrington
| Age Bracket | Married | Unmarried |
| 15 to 19 years | 0 (0.0%) | 0 (0.0%) |
| 20 to 34 years | 0 (0.0%) | 0 (0.0%) |
| 35 to 50 years | 0 (0.0%) | 0 (0.0%) |
| Total | 0 (0.0%) | 0 (0.0%) |
Fertility by Education in Darrington
| Educational Attainment | Women with Births | Births / 1,000 Women |
| Less than High School | 0 (0.0%) | 0.0 |
| High School Diploma | 0 (0.0%) | 0.0 |
| College or Associate's Degree | 0 (0.0%) | 0.0 |
| Bachelor's Degree | 0 (0.0%) | 0.0 |
| Graduate Degree | 0 (0.0%) | 0.0 |
| Total | 0 (0.0%) | 0.0 |
Fertility by Education by Marriage Status in Darrington
| Educational Attainment | Married | Unmarried |
| Less than High School | 0 (0.0%) | 0 (0.0%) |
| High School Diploma | 0 (0.0%) | 0 (0.0%) |
| College or Associate's Degree | 0 (0.0%) | 0 (0.0%) |
| Bachelor's Degree | 0 (0.0%) | 0 (0.0%) |
| Graduate Degree | 0 (0.0%) | 0 (0.0%) |
| Total | 0 (0.0%) | 0 (0.0%) |
Employment Characteristics in Darrington
Employment by Class of Employer in Darrington
Among the 421 employed individuals in Darrington, private company employees (241 | 57.2%), local government employees (87 | 20.7%), and state government employees (40 | 9.5%) make up the most common classes of employment.
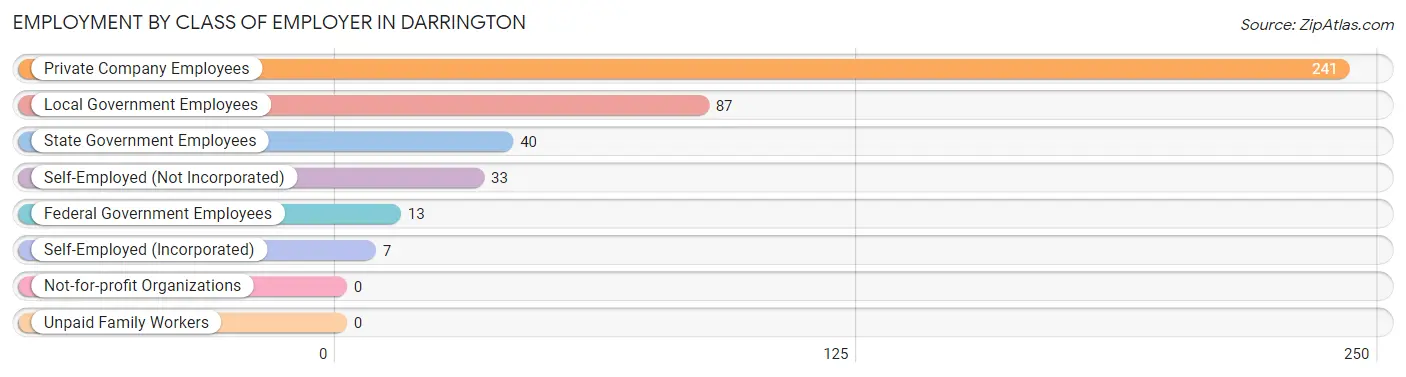
| Employer Class | # Employees | % Employees |
| Private Company Employees | 241 | 57.2% |
| Self-Employed (Incorporated) | 7 | 1.7% |
| Self-Employed (Not Incorporated) | 33 | 7.8% |
| Not-for-profit Organizations | 0 | 0.0% |
| Local Government Employees | 87 | 20.7% |
| State Government Employees | 40 | 9.5% |
| Federal Government Employees | 13 | 3.1% |
| Unpaid Family Workers | 0 | 0.0% |
| Total | 421 | 100.0% |
Employment Status by Age in Darrington
According to the labor force statistics for Darrington, out of the total population over 16 years of age (1,037), 48.2% or 500 individuals are in the labor force, with 13.8% or 69 of them unemployed. The age group with the highest labor force participation rate is 20 to 24 years, with 100.0% or 41 individuals in the labor force. Within the labor force, the 30 to 34 years age range has the highest percentage of unemployed individuals, with 40.5% or 17 of them being unemployed.
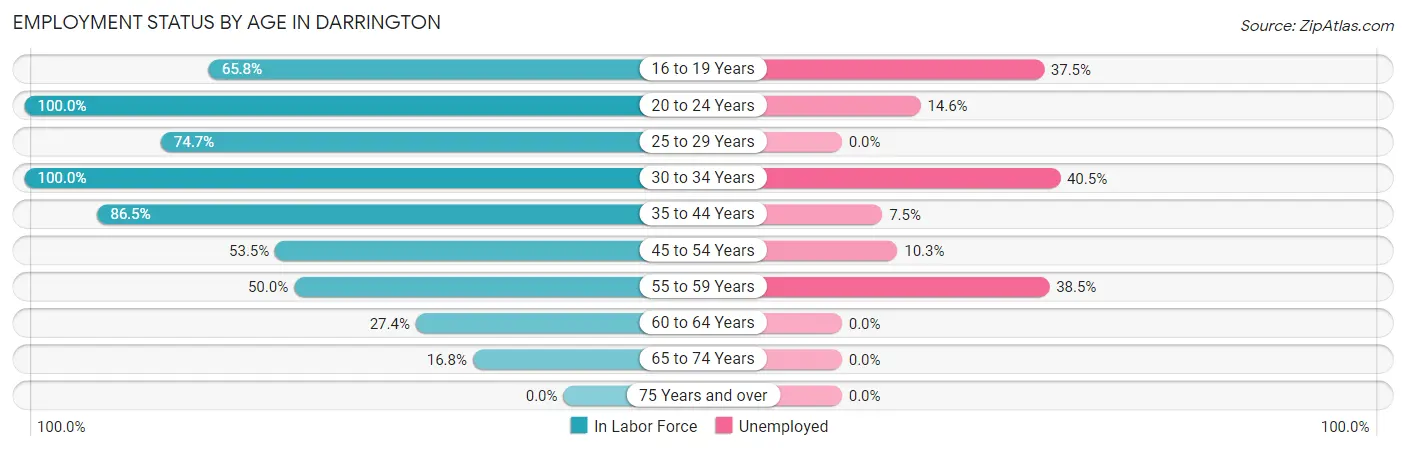
| Age Bracket | In Labor Force | Unemployed |
| 16 to 19 Years | 48 (65.8%) | 18 (37.5%) |
| 20 to 24 Years | 41 (100.0%) | 6 (14.6%) |
| 25 to 29 Years | 71 (74.7%) | 0 (0.0%) |
| 30 to 34 Years | 42 (100.0%) | 17 (40.5%) |
| 35 to 44 Years | 147 (86.5%) | 11 (7.5%) |
| 45 to 54 Years | 68 (53.5%) | 7 (10.3%) |
| 55 to 59 Years | 26 (50.0%) | 10 (38.5%) |
| 60 to 64 Years | 20 (27.4%) | 0 (0.0%) |
| 65 to 74 Years | 37 (16.8%) | 0 (0.0%) |
| 75 Years and over | 0 (0.0%) | 0 (0.0%) |
| Total | 500 (48.2%) | 69 (13.8%) |
Employment Status by Educational Attainment in Darrington
According to labor force statistics for Darrington, 66.9% of individuals (374) out of the total population between 25 and 64 years of age (559) are in the labor force, with 12.0% or 45 of them being unemployed. The group with the highest labor force participation rate are those with the educational attainment of college / associate degree, with 75.9% or 60 individuals in the labor force. Within the labor force, individuals with less than high school education have the highest percentage of unemployment, with 62.5% or 35 of them being unemployed.
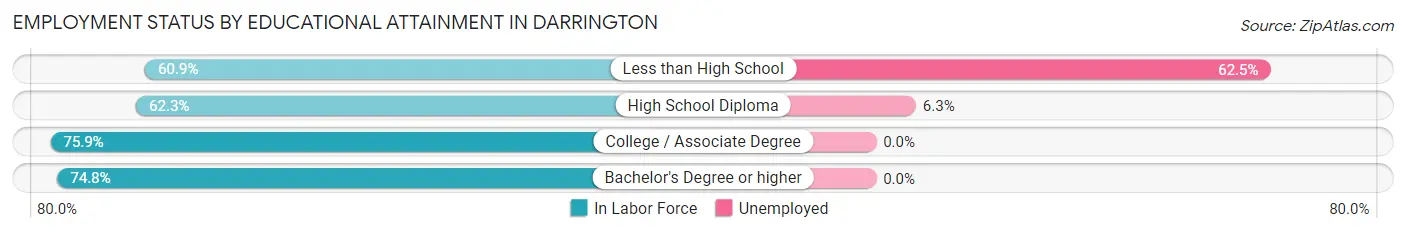
| Educational Attainment | In Labor Force | Unemployed |
| Less than High School | 56 (60.9%) | 58 (62.5%) |
| High School Diploma | 160 (62.3%) | 16 (6.3%) |
| College / Associate Degree | 60 (75.9%) | 0 (0.0%) |
| Bachelor's Degree or higher | 98 (74.8%) | 0 (0.0%) |
| Total | 374 (66.9%) | 67 (12.0%) |
Employment Occupations by Sex in Darrington
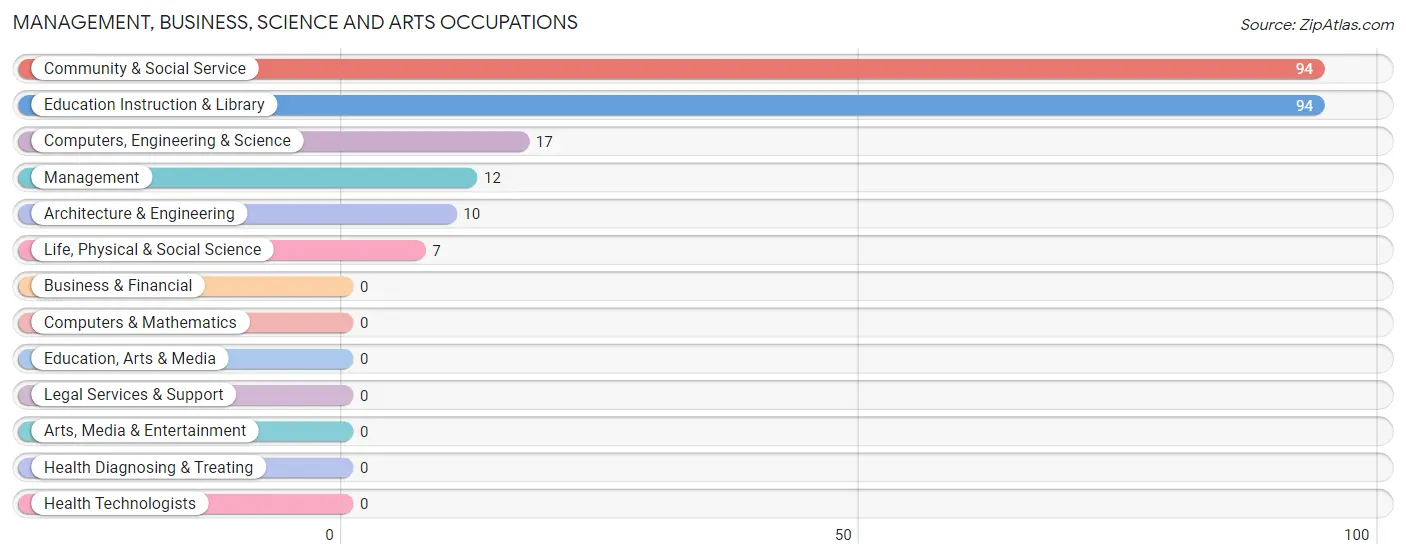
Management, Business, Science and Arts Occupations
The most common Management, Business, Science and Arts occupations in Darrington are Community & Social Service (94 | 21.8%), Education Instruction & Library (94 | 21.8%), Computers, Engineering & Science (17 | 3.9%), Management (12 | 2.8%), and Architecture & Engineering (10 | 2.3%).
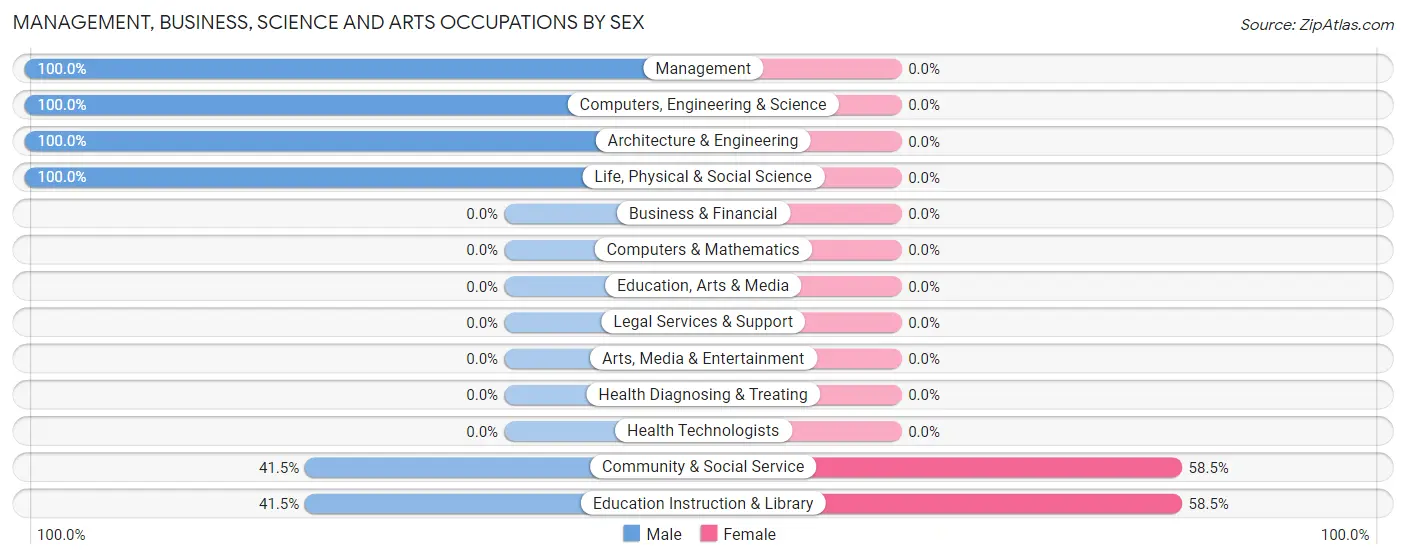
Management, Business, Science and Arts Occupations by Sex
Within the Management, Business, Science and Arts occupations in Darrington, the most male-oriented occupations are Management (100.0%), Computers, Engineering & Science (100.0%), and Architecture & Engineering (100.0%), while the most female-oriented occupations are Community & Social Service (58.5%), and Education Instruction & Library (58.5%).
| Occupation | Male | Female |
| Management | 12 (100.0%) | 0 (0.0%) |
| Business & Financial | 0 (0.0%) | 0 (0.0%) |
| Computers, Engineering & Science | 17 (100.0%) | 0 (0.0%) |
| Computers & Mathematics | 0 (0.0%) | 0 (0.0%) |
| Architecture & Engineering | 10 (100.0%) | 0 (0.0%) |
| Life, Physical & Social Science | 7 (100.0%) | 0 (0.0%) |
| Community & Social Service | 39 (41.5%) | 55 (58.5%) |
| Education, Arts & Media | 0 (0.0%) | 0 (0.0%) |
| Legal Services & Support | 0 (0.0%) | 0 (0.0%) |
| Education Instruction & Library | 39 (41.5%) | 55 (58.5%) |
| Arts, Media & Entertainment | 0 (0.0%) | 0 (0.0%) |
| Health Diagnosing & Treating | 0 (0.0%) | 0 (0.0%) |
| Health Technologists | 0 (0.0%) | 0 (0.0%) |
| Total (Category) | 68 (55.3%) | 55 (44.7%) |
| Total (Overall) | 212 (49.2%) | 219 (50.8%) |
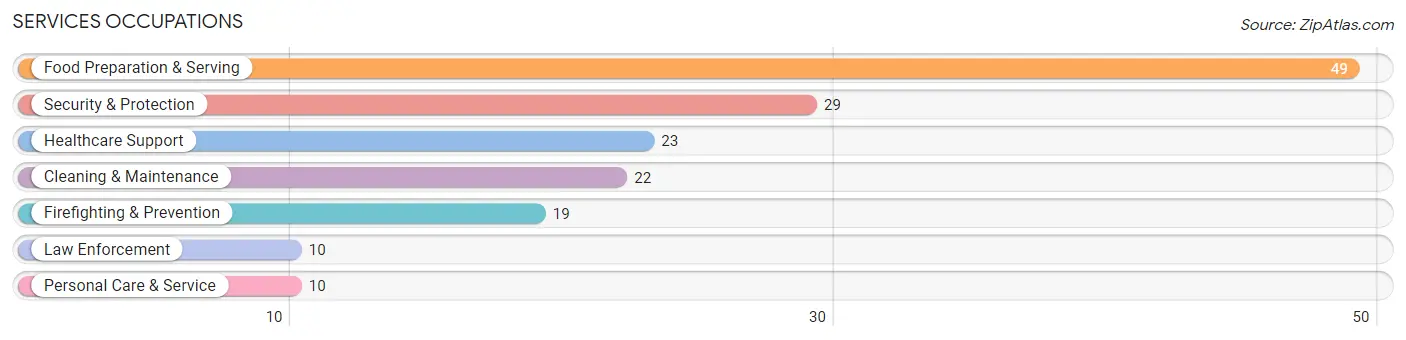
Services Occupations
The most common Services occupations in Darrington are Food Preparation & Serving (49 | 11.4%), Security & Protection (29 | 6.7%), Healthcare Support (23 | 5.3%), Cleaning & Maintenance (22 | 5.1%), and Firefighting & Prevention (19 | 4.4%).
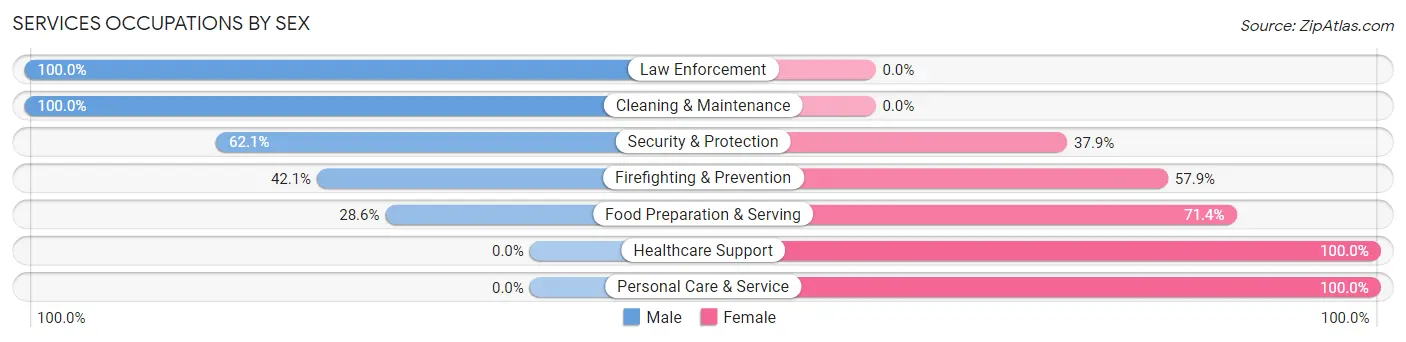
Services Occupations by Sex
Within the Services occupations in Darrington, the most male-oriented occupations are Law Enforcement (100.0%), Cleaning & Maintenance (100.0%), and Security & Protection (62.1%), while the most female-oriented occupations are Healthcare Support (100.0%), Personal Care & Service (100.0%), and Food Preparation & Serving (71.4%).
| Occupation | Male | Female |
| Healthcare Support | 0 (0.0%) | 23 (100.0%) |
| Security & Protection | 18 (62.1%) | 11 (37.9%) |
| Firefighting & Prevention | 8 (42.1%) | 11 (57.9%) |
| Law Enforcement | 10 (100.0%) | 0 (0.0%) |
| Food Preparation & Serving | 14 (28.6%) | 35 (71.4%) |
| Cleaning & Maintenance | 22 (100.0%) | 0 (0.0%) |
| Personal Care & Service | 0 (0.0%) | 10 (100.0%) |
| Total (Category) | 54 (40.6%) | 79 (59.4%) |
| Total (Overall) | 212 (49.2%) | 219 (50.8%) |
Sales and Office Occupations
The most common Sales and Office occupations in Darrington are Office & Administration (44 | 10.2%), and Sales & Related (23 | 5.3%).
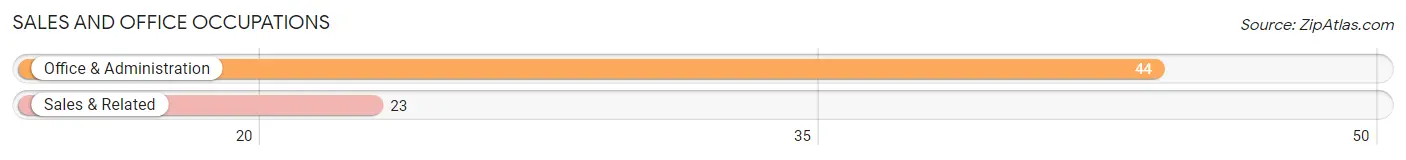
Sales and Office Occupations by Sex
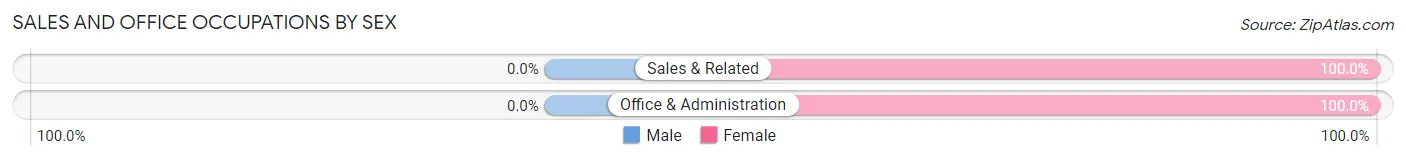
| Occupation | Male | Female |
| Sales & Related | 0 (0.0%) | 23 (100.0%) |
| Office & Administration | 0 (0.0%) | 44 (100.0%) |
| Total (Category) | 0 (0.0%) | 67 (100.0%) |
| Total (Overall) | 212 (49.2%) | 219 (50.8%) |
Natural Resources, Construction and Maintenance Occupations
The most common Natural Resources, Construction and Maintenance occupations in Darrington are Construction & Extraction (28 | 6.5%), and Installation, Maintenance & Repair (17 | 3.9%).
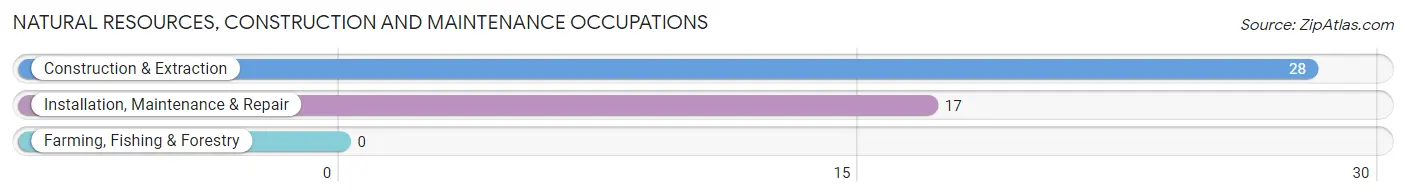
Natural Resources, Construction and Maintenance Occupations by Sex
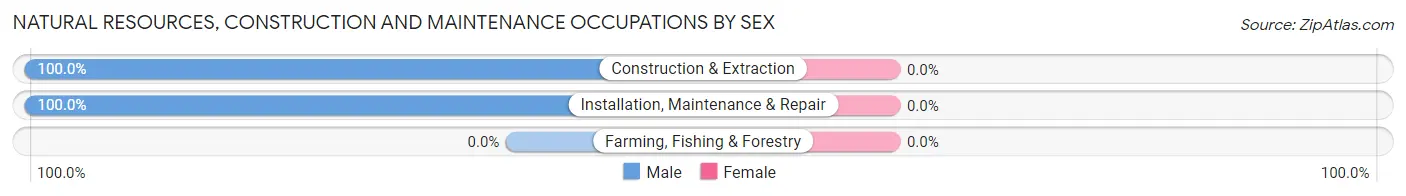
| Occupation | Male | Female |
| Farming, Fishing & Forestry | 0 (0.0%) | 0 (0.0%) |
| Construction & Extraction | 28 (100.0%) | 0 (0.0%) |
| Installation, Maintenance & Repair | 17 (100.0%) | 0 (0.0%) |
| Total (Category) | 45 (100.0%) | 0 (0.0%) |
| Total (Overall) | 212 (49.2%) | 219 (50.8%) |
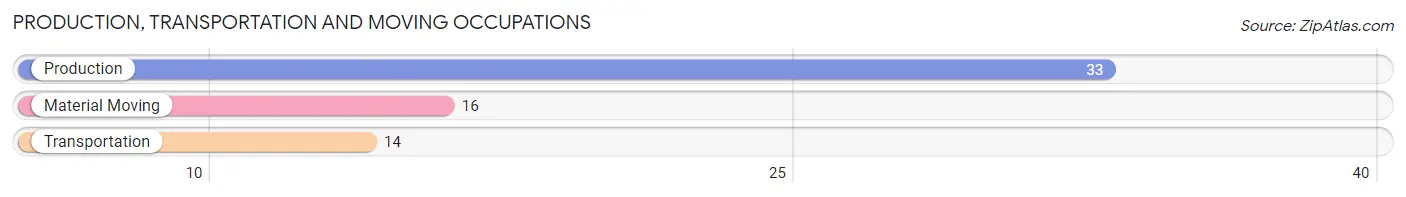
Production, Transportation and Moving Occupations
The most common Production, Transportation and Moving occupations in Darrington are Production (33 | 7.7%), Material Moving (16 | 3.7%), and Transportation (14 | 3.3%).
Production, Transportation and Moving Occupations by Sex
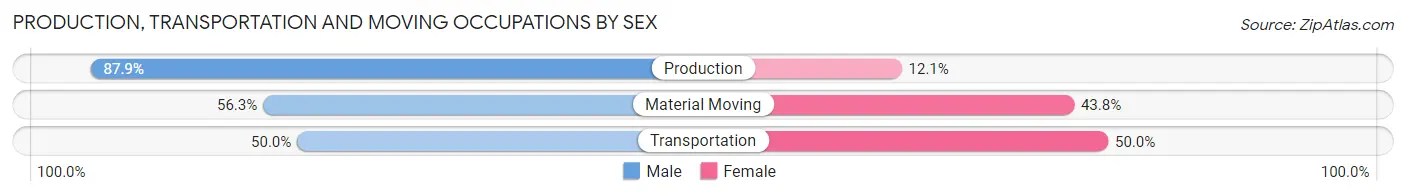
| Occupation | Male | Female |
| Production | 29 (87.9%) | 4 (12.1%) |
| Transportation | 7 (50.0%) | 7 (50.0%) |
| Material Moving | 9 (56.2%) | 7 (43.8%) |
| Total (Category) | 45 (71.4%) | 18 (28.6%) |
| Total (Overall) | 212 (49.2%) | 219 (50.8%) |
Employment Industries by Sex in Darrington
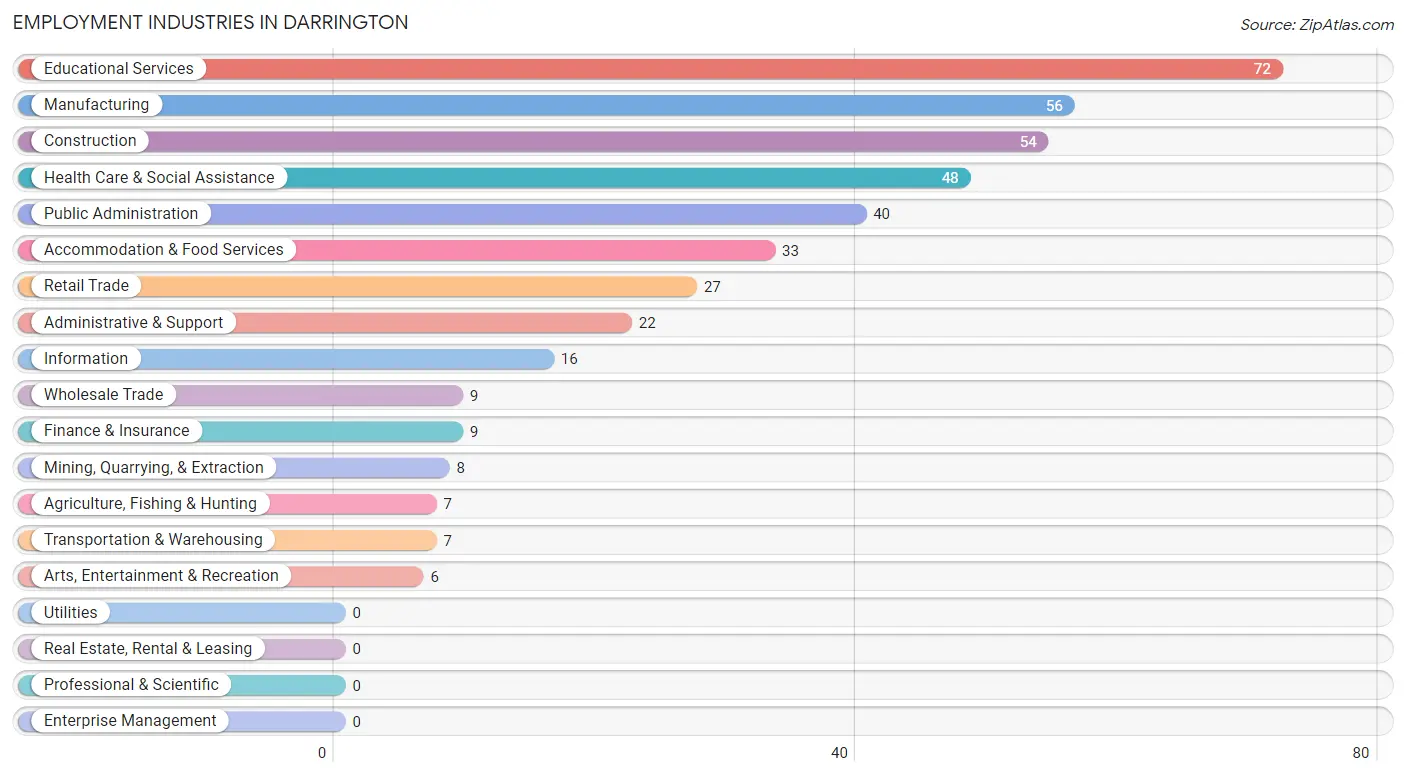
Employment Industries in Darrington
The major employment industries in Darrington include Educational Services (72 | 16.7%), Manufacturing (56 | 13.0%), Construction (54 | 12.5%), Health Care & Social Assistance (48 | 11.1%), and Public Administration (40 | 9.3%).
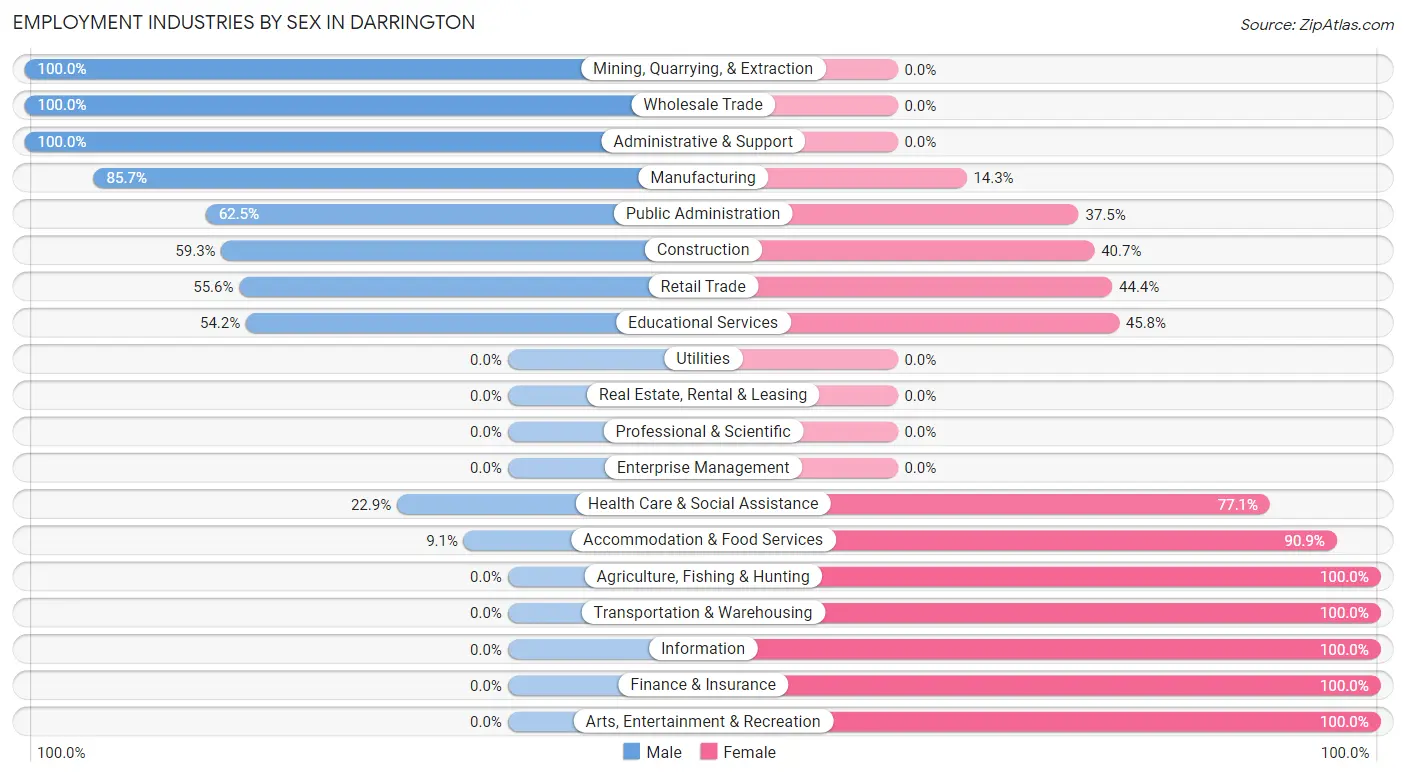
Employment Industries by Sex in Darrington
The Darrington industries that see more men than women are Mining, Quarrying, & Extraction (100.0%), Wholesale Trade (100.0%), and Administrative & Support (100.0%), whereas the industries that tend to have a higher number of women are Agriculture, Fishing & Hunting (100.0%), Transportation & Warehousing (100.0%), and Information (100.0%).
| Industry | Male | Female |
| Agriculture, Fishing & Hunting | 0 (0.0%) | 7 (100.0%) |
| Mining, Quarrying, & Extraction | 8 (100.0%) | 0 (0.0%) |
| Construction | 32 (59.3%) | 22 (40.7%) |
| Manufacturing | 48 (85.7%) | 8 (14.3%) |
| Wholesale Trade | 9 (100.0%) | 0 (0.0%) |
| Retail Trade | 15 (55.6%) | 12 (44.4%) |
| Transportation & Warehousing | 0 (0.0%) | 7 (100.0%) |
| Utilities | 0 (0.0%) | 0 (0.0%) |
| Information | 0 (0.0%) | 16 (100.0%) |
| Finance & Insurance | 0 (0.0%) | 9 (100.0%) |
| Real Estate, Rental & Leasing | 0 (0.0%) | 0 (0.0%) |
| Professional & Scientific | 0 (0.0%) | 0 (0.0%) |
| Enterprise Management | 0 (0.0%) | 0 (0.0%) |
| Administrative & Support | 22 (100.0%) | 0 (0.0%) |
| Educational Services | 39 (54.2%) | 33 (45.8%) |
| Health Care & Social Assistance | 11 (22.9%) | 37 (77.1%) |
| Arts, Entertainment & Recreation | 0 (0.0%) | 6 (100.0%) |
| Accommodation & Food Services | 3 (9.1%) | 30 (90.9%) |
| Public Administration | 25 (62.5%) | 15 (37.5%) |
| Total | 212 (49.2%) | 219 (50.8%) |
Education in Darrington
School Enrollment in Darrington
The most common levels of schooling among the 234 students in Darrington are middle school (87 | 37.2%), high school (75 | 32.1%), and elementary school (33 | 14.1%).
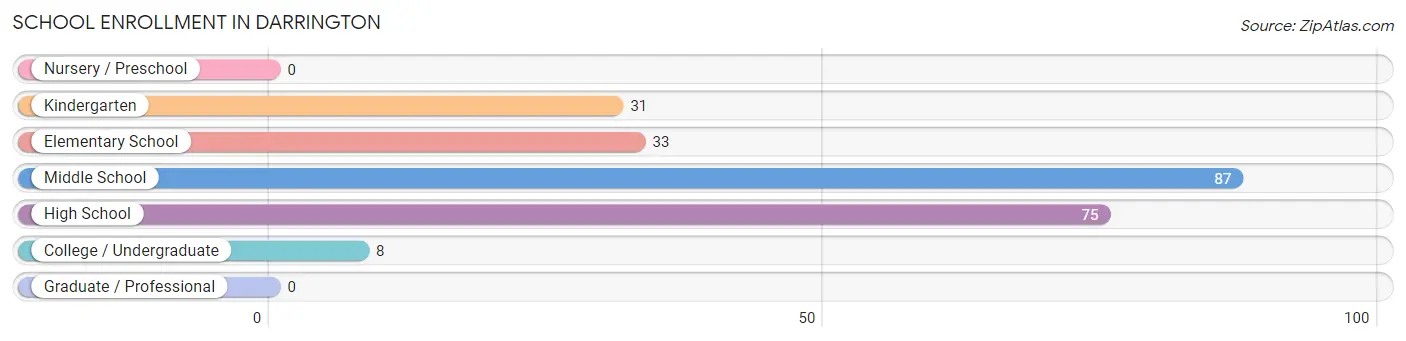
| School Level | # Students | % Students |
| Nursery / Preschool | 0 | 0.0% |
| Kindergarten | 31 | 13.3% |
| Elementary School | 33 | 14.1% |
| Middle School | 87 | 37.2% |
| High School | 75 | 32.1% |
| College / Undergraduate | 8 | 3.4% |
| Graduate / Professional | 0 | 0.0% |
| Total | 234 | 100.0% |
School Enrollment by Age by Funding Source in Darrington
Out of a total of 234 students who are enrolled in schools in Darrington, 6 (2.6%) attend a private institution, while the remaining 228 (97.4%) are enrolled in public schools. The age group of 15 to 17 year olds has the highest likelihood of being enrolled in private schools, with 6 (10.2% in the age bracket) enrolled. Conversely, the age group of 5 to 9 year old has the lowest likelihood of being enrolled in a private school, with 64 (100.0% in the age bracket) attending a public institution.
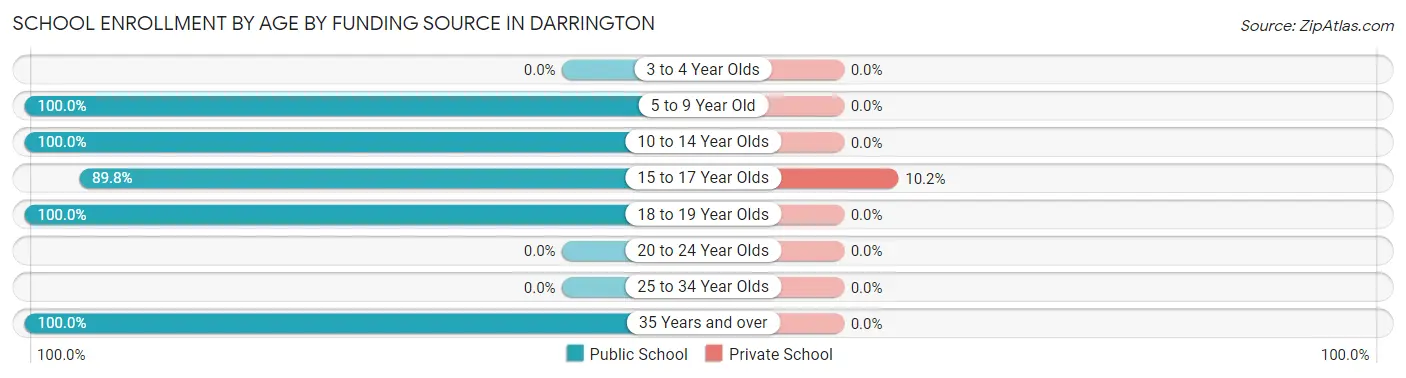
| Age Bracket | Public School | Private School |
| 3 to 4 Year Olds | 0 (0.0%) | 0 (0.0%) |
| 5 to 9 Year Old | 64 (100.0%) | 0 (0.0%) |
| 10 to 14 Year Olds | 92 (100.0%) | 0 (0.0%) |
| 15 to 17 Year Olds | 53 (89.8%) | 6 (10.2%) |
| 18 to 19 Year Olds | 11 (100.0%) | 0 (0.0%) |
| 20 to 24 Year Olds | 0 (0.0%) | 0 (0.0%) |
| 25 to 34 Year Olds | 0 (0.0%) | 0 (0.0%) |
| 35 Years and over | 8 (100.0%) | 0 (0.0%) |
| Total | 228 (97.4%) | 6 (2.6%) |
Educational Attainment by Field of Study in Darrington
Education (82 | 26.6%), physical & health sciences (67 | 21.7%), engineering (67 | 21.7%), business (34 | 11.0%), and bio, nature & agricultural (21 | 6.8%) are the most common fields of study among 308 individuals in Darrington who have obtained a bachelor's degree or higher.
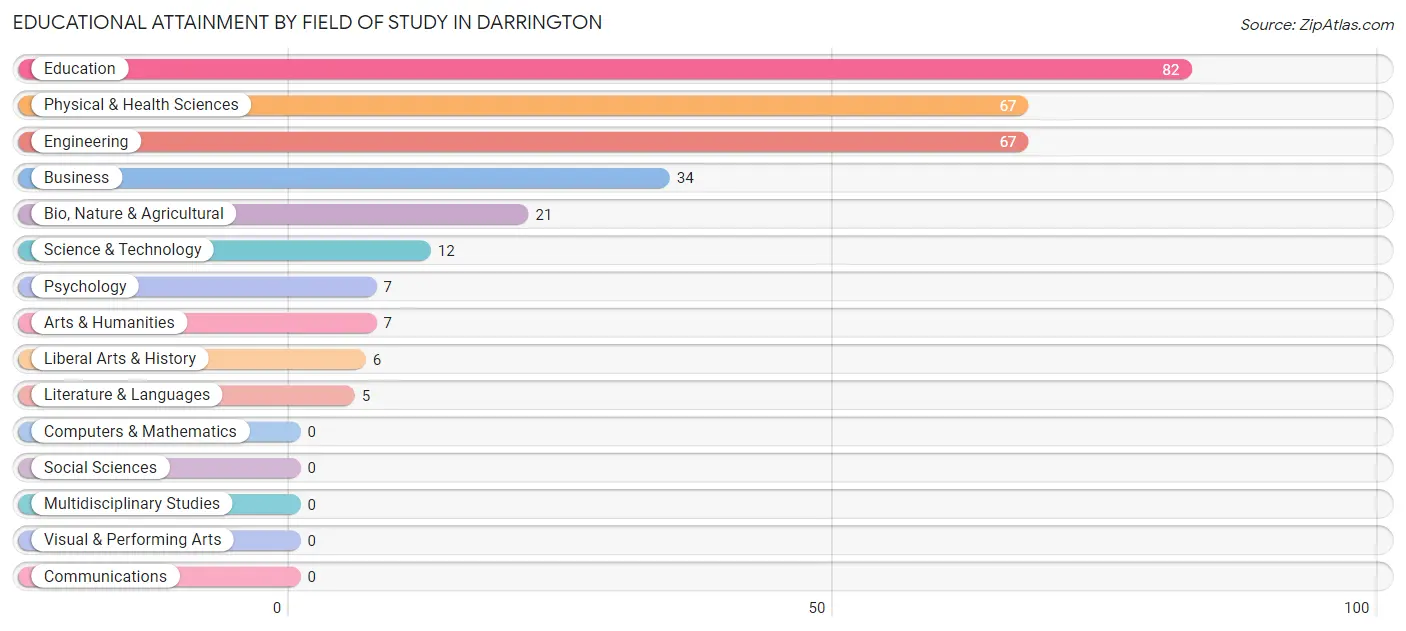
| Field of Study | # Graduates | % Graduates |
| Computers & Mathematics | 0 | 0.0% |
| Bio, Nature & Agricultural | 21 | 6.8% |
| Physical & Health Sciences | 67 | 21.7% |
| Psychology | 7 | 2.3% |
| Social Sciences | 0 | 0.0% |
| Engineering | 67 | 21.7% |
| Multidisciplinary Studies | 0 | 0.0% |
| Science & Technology | 12 | 3.9% |
| Business | 34 | 11.0% |
| Education | 82 | 26.6% |
| Literature & Languages | 5 | 1.6% |
| Liberal Arts & History | 6 | 1.9% |
| Visual & Performing Arts | 0 | 0.0% |
| Communications | 0 | 0.0% |
| Arts & Humanities | 7 | 2.3% |
| Total | 308 | 100.0% |
Transportation & Commute in Darrington
Vehicle Availability by Sex in Darrington
The most prevalent vehicle ownership categories in Darrington are males with 2 vehicles (96, accounting for 45.3%) and females with 2 vehicles (53, making up 45.9%).
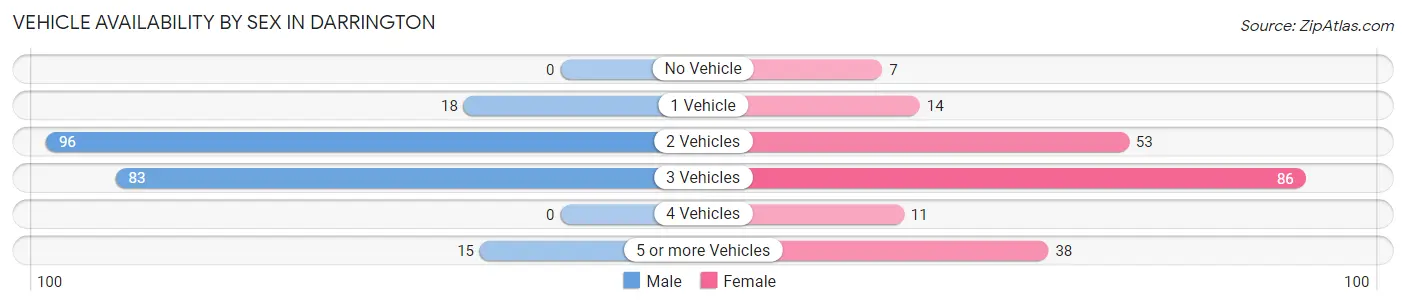
| Vehicles Available | Male | Female |
| No Vehicle | 0 (0.0%) | 7 (3.4%) |
| 1 Vehicle | 18 (8.5%) | 14 (6.7%) |
| 2 Vehicles | 96 (45.3%) | 53 (25.4%) |
| 3 Vehicles | 83 (39.2%) | 86 (41.1%) |
| 4 Vehicles | 0 (0.0%) | 11 (5.3%) |
| 5 or more Vehicles | 15 (7.1%) | 38 (18.2%) |
| Total | 212 (100.0%) | 209 (100.0%) |
Commute Time in Darrington
The most frequently occuring commute durations in Darrington are less than 5 minutes (146 commuters, 38.7%), 5 to 9 minutes (82 commuters, 21.7%), and 60 to 89 minutes (40 commuters, 10.6%).
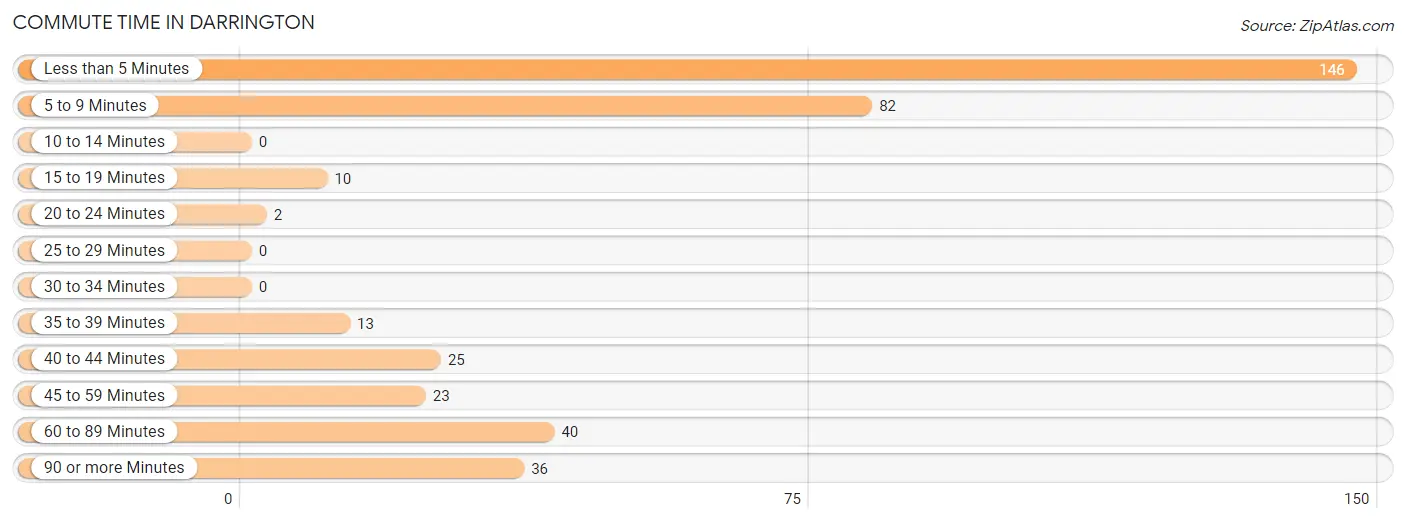
| Commute Time | # Commuters | % Commuters |
| Less than 5 Minutes | 146 | 38.7% |
| 5 to 9 Minutes | 82 | 21.7% |
| 10 to 14 Minutes | 0 | 0.0% |
| 15 to 19 Minutes | 10 | 2.6% |
| 20 to 24 Minutes | 2 | 0.5% |
| 25 to 29 Minutes | 0 | 0.0% |
| 30 to 34 Minutes | 0 | 0.0% |
| 35 to 39 Minutes | 13 | 3.5% |
| 40 to 44 Minutes | 25 | 6.6% |
| 45 to 59 Minutes | 23 | 6.1% |
| 60 to 89 Minutes | 40 | 10.6% |
| 90 or more Minutes | 36 | 9.6% |
Commute Time by Sex in Darrington
The most common commute times in Darrington are less than 5 minutes (101 commuters, 54.6%) for males and 5 to 9 minutes (59 commuters, 30.7%) for females.
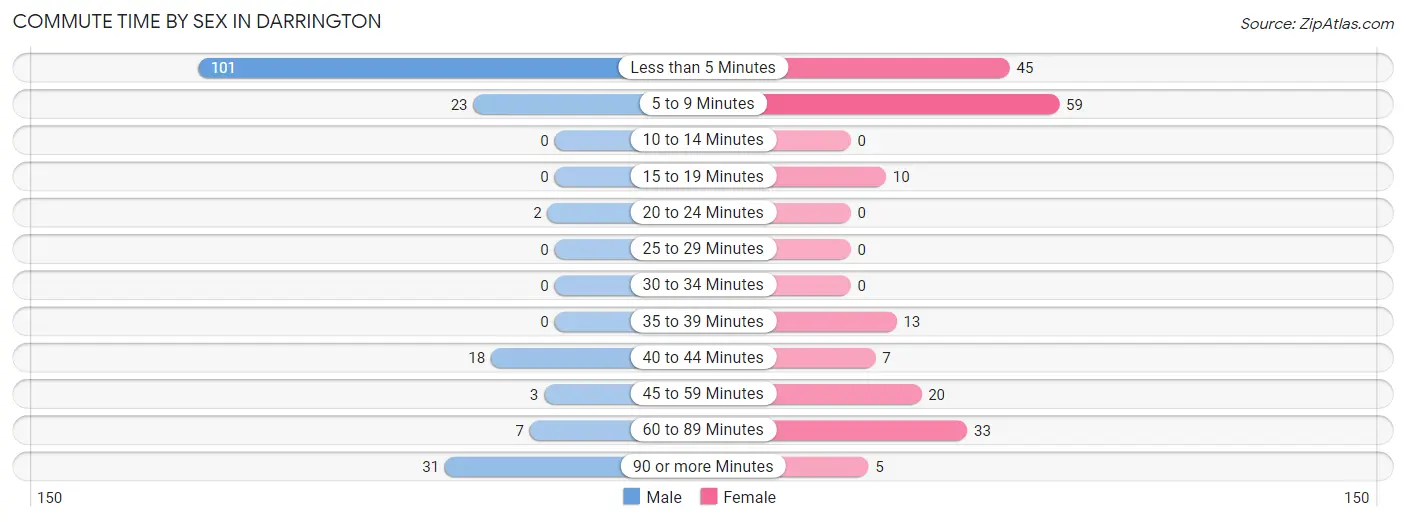
| Commute Time | Male | Female |
| Less than 5 Minutes | 101 (54.6%) | 45 (23.4%) |
| 5 to 9 Minutes | 23 (12.4%) | 59 (30.7%) |
| 10 to 14 Minutes | 0 (0.0%) | 0 (0.0%) |
| 15 to 19 Minutes | 0 (0.0%) | 10 (5.2%) |
| 20 to 24 Minutes | 2 (1.1%) | 0 (0.0%) |
| 25 to 29 Minutes | 0 (0.0%) | 0 (0.0%) |
| 30 to 34 Minutes | 0 (0.0%) | 0 (0.0%) |
| 35 to 39 Minutes | 0 (0.0%) | 13 (6.8%) |
| 40 to 44 Minutes | 18 (9.7%) | 7 (3.6%) |
| 45 to 59 Minutes | 3 (1.6%) | 20 (10.4%) |
| 60 to 89 Minutes | 7 (3.8%) | 33 (17.2%) |
| 90 or more Minutes | 31 (16.8%) | 5 (2.6%) |
Time of Departure to Work by Sex in Darrington
The most frequent times of departure to work in Darrington are 7:00 AM to 7:29 AM (73, 39.5%) for males and 7:00 AM to 7:29 AM (40, 20.8%) for females.
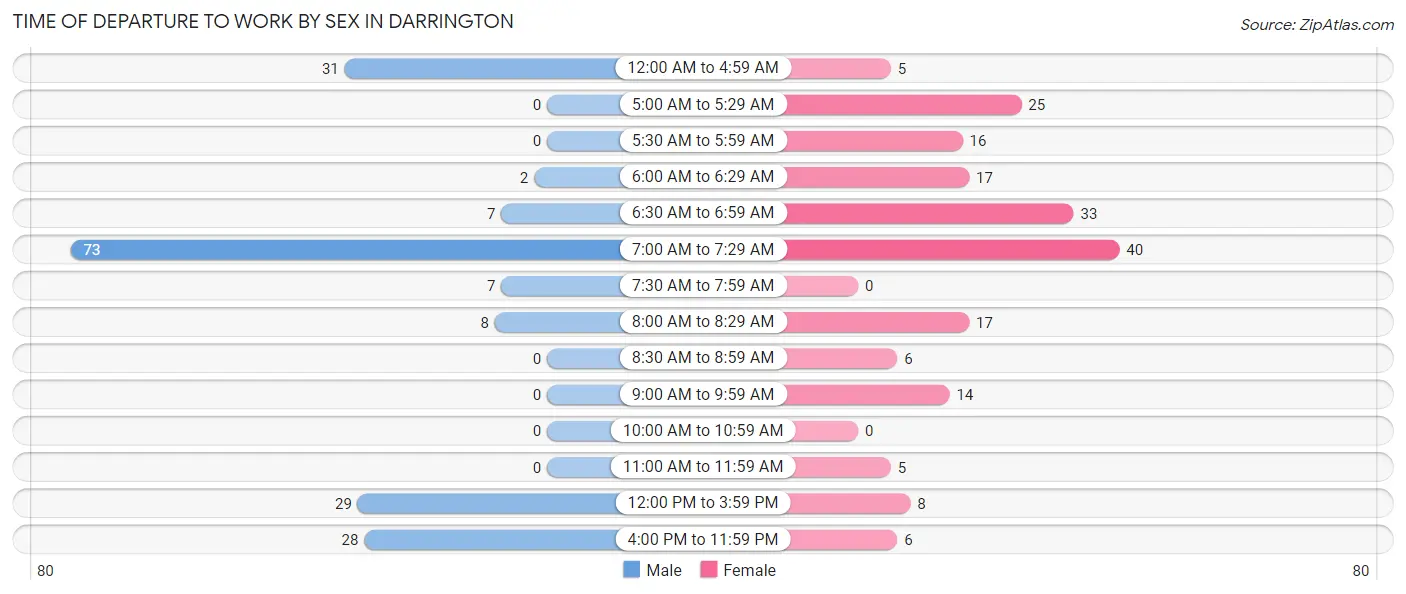
| Time of Departure | Male | Female |
| 12:00 AM to 4:59 AM | 31 (16.8%) | 5 (2.6%) |
| 5:00 AM to 5:29 AM | 0 (0.0%) | 25 (13.0%) |
| 5:30 AM to 5:59 AM | 0 (0.0%) | 16 (8.3%) |
| 6:00 AM to 6:29 AM | 2 (1.1%) | 17 (8.8%) |
| 6:30 AM to 6:59 AM | 7 (3.8%) | 33 (17.2%) |
| 7:00 AM to 7:29 AM | 73 (39.5%) | 40 (20.8%) |
| 7:30 AM to 7:59 AM | 7 (3.8%) | 0 (0.0%) |
| 8:00 AM to 8:29 AM | 8 (4.3%) | 17 (8.8%) |
| 8:30 AM to 8:59 AM | 0 (0.0%) | 6 (3.1%) |
| 9:00 AM to 9:59 AM | 0 (0.0%) | 14 (7.3%) |
| 10:00 AM to 10:59 AM | 0 (0.0%) | 0 (0.0%) |
| 11:00 AM to 11:59 AM | 0 (0.0%) | 5 (2.6%) |
| 12:00 PM to 3:59 PM | 29 (15.7%) | 8 (4.2%) |
| 4:00 PM to 11:59 PM | 28 (15.1%) | 6 (3.1%) |
| Total | 185 (100.0%) | 192 (100.0%) |
Housing Occupancy in Darrington
Occupancy by Ownership in Darrington
Of the total 566 dwellings in Darrington, owner-occupied units account for 360 (63.6%), while renter-occupied units make up 206 (36.4%).
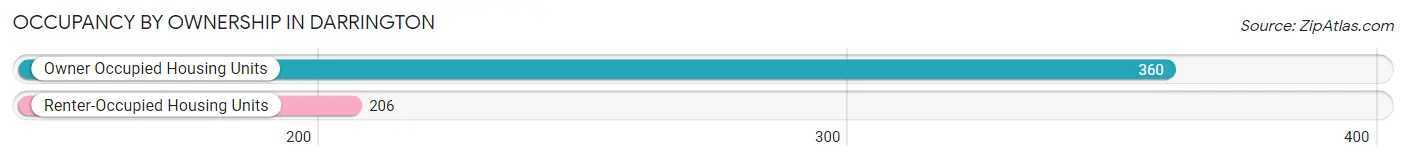
| Occupancy | # Housing Units | % Housing Units |
| Owner Occupied Housing Units | 360 | 63.6% |
| Renter-Occupied Housing Units | 206 | 36.4% |
| Total Occupied Housing Units | 566 | 100.0% |
Occupancy by Household Size in Darrington
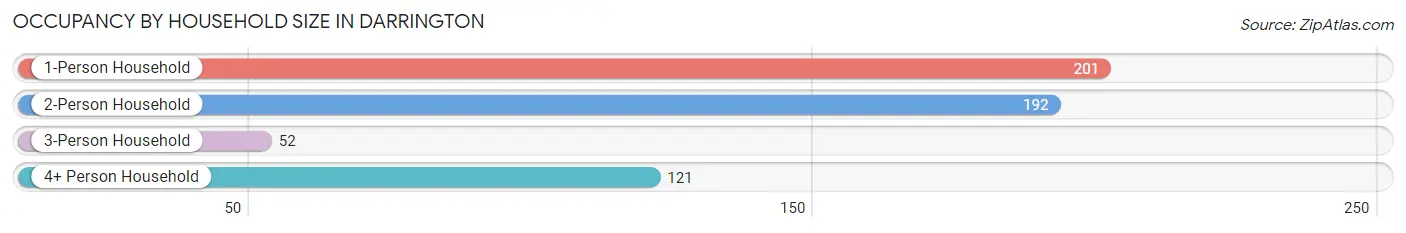
| Household Size | # Housing Units | % Housing Units |
| 1-Person Household | 201 | 35.5% |
| 2-Person Household | 192 | 33.9% |
| 3-Person Household | 52 | 9.2% |
| 4+ Person Household | 121 | 21.4% |
| Total Housing Units | 566 | 100.0% |
Occupancy by Ownership by Household Size in Darrington
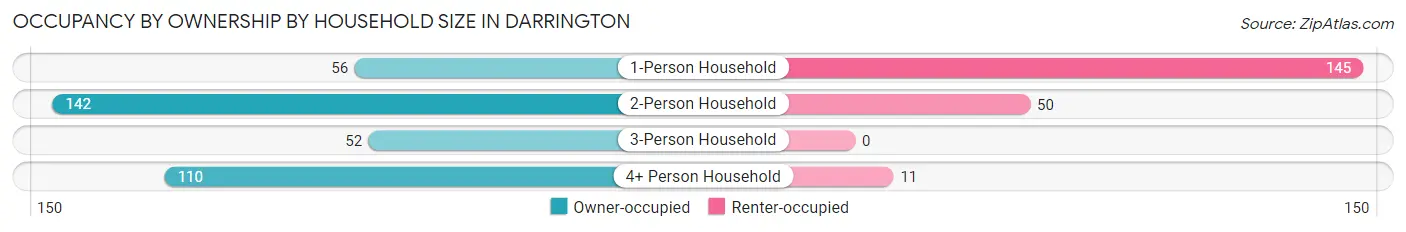
| Household Size | Owner-occupied | Renter-occupied |
| 1-Person Household | 56 (27.9%) | 145 (72.1%) |
| 2-Person Household | 142 (74.0%) | 50 (26.0%) |
| 3-Person Household | 52 (100.0%) | 0 (0.0%) |
| 4+ Person Household | 110 (90.9%) | 11 (9.1%) |
| Total Housing Units | 360 (63.6%) | 206 (36.4%) |
Occupancy by Educational Attainment in Darrington
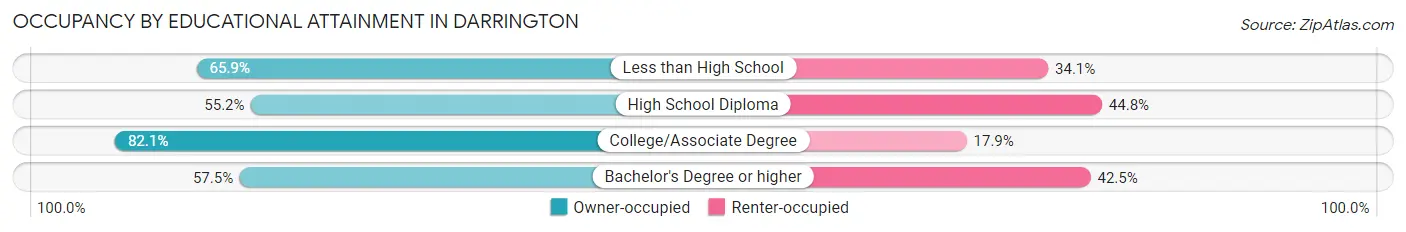
| Household Size | Owner-occupied | Renter-occupied |
| Less than High School | 29 (65.9%) | 15 (34.1%) |
| High School Diploma | 116 (55.2%) | 94 (44.8%) |
| College/Associate Degree | 119 (82.1%) | 26 (17.9%) |
| Bachelor's Degree or higher | 96 (57.5%) | 71 (42.5%) |
Occupancy by Age of Householder in Darrington
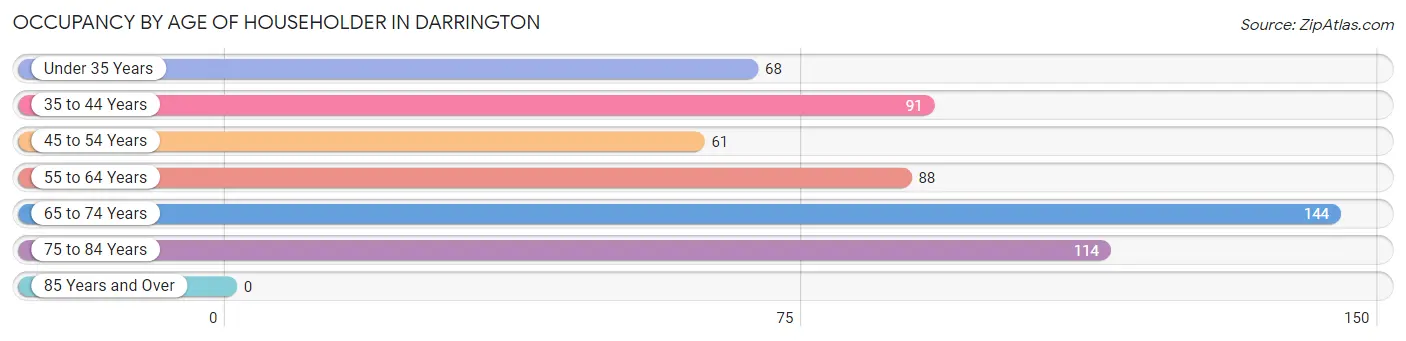
| Age Bracket | # Households | % Households |
| Under 35 Years | 68 | 12.0% |
| 35 to 44 Years | 91 | 16.1% |
| 45 to 54 Years | 61 | 10.8% |
| 55 to 64 Years | 88 | 15.5% |
| 65 to 74 Years | 144 | 25.4% |
| 75 to 84 Years | 114 | 20.1% |
| 85 Years and Over | 0 | 0.0% |
| Total | 566 | 100.0% |
Housing Finances in Darrington
Median Income by Occupancy in Darrington
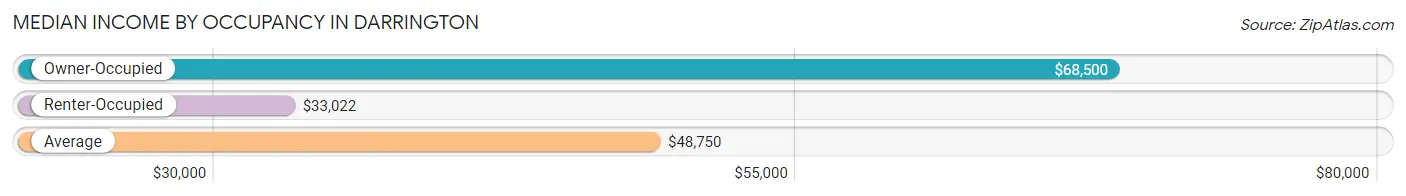
| Occupancy Type | # Households | Median Income |
| Owner-Occupied | 360 (63.6%) | $68,500 |
| Renter-Occupied | 206 (36.4%) | $33,022 |
| Average | 566 (100.0%) | $48,750 |
Occupancy by Householder Income Bracket in Darrington
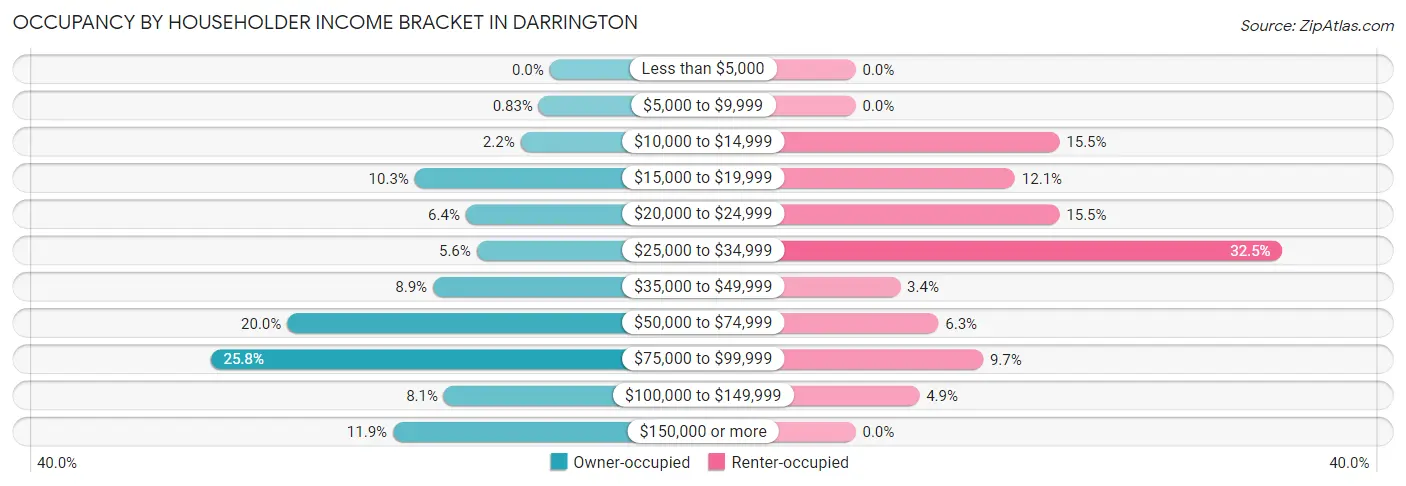
| Income Bracket | Owner-occupied | Renter-occupied |
| Less than $5,000 | 0 (0.0%) | 0 (0.0%) |
| $5,000 to $9,999 | 3 (0.8%) | 0 (0.0%) |
| $10,000 to $14,999 | 8 (2.2%) | 32 (15.5%) |
| $15,000 to $19,999 | 37 (10.3%) | 25 (12.1%) |
| $20,000 to $24,999 | 23 (6.4%) | 32 (15.5%) |
| $25,000 to $34,999 | 20 (5.6%) | 67 (32.5%) |
| $35,000 to $49,999 | 32 (8.9%) | 7 (3.4%) |
| $50,000 to $74,999 | 72 (20.0%) | 13 (6.3%) |
| $75,000 to $99,999 | 93 (25.8%) | 20 (9.7%) |
| $100,000 to $149,999 | 29 (8.1%) | 10 (4.9%) |
| $150,000 or more | 43 (11.9%) | 0 (0.0%) |
| Total | 360 (100.0%) | 206 (100.0%) |
Monthly Housing Cost Tiers in Darrington
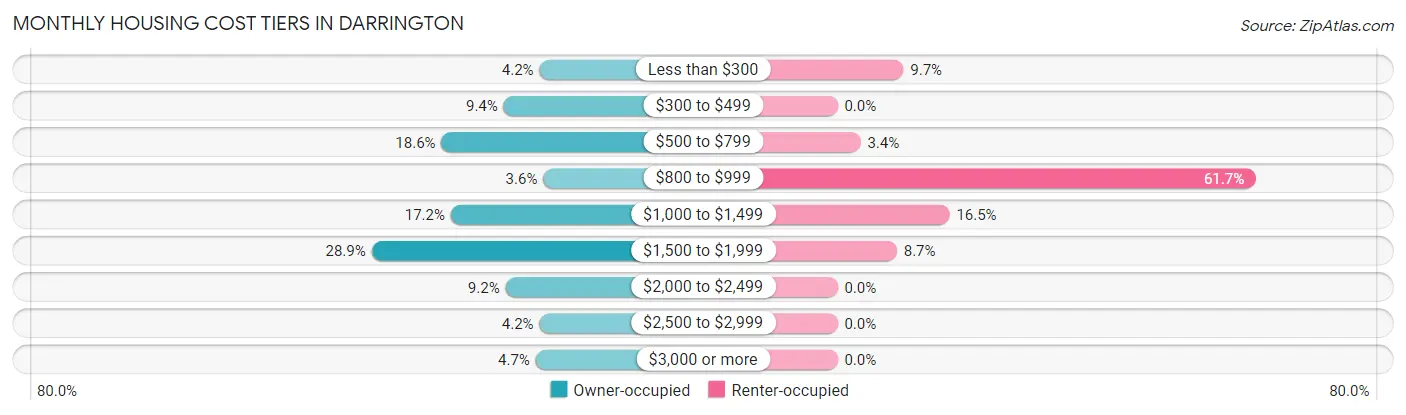
| Monthly Cost | Owner-occupied | Renter-occupied |
| Less than $300 | 15 (4.2%) | 20 (9.7%) |
| $300 to $499 | 34 (9.4%) | 0 (0.0%) |
| $500 to $799 | 67 (18.6%) | 7 (3.4%) |
| $800 to $999 | 13 (3.6%) | 127 (61.7%) |
| $1,000 to $1,499 | 62 (17.2%) | 34 (16.5%) |
| $1,500 to $1,999 | 104 (28.9%) | 18 (8.7%) |
| $2,000 to $2,499 | 33 (9.2%) | 0 (0.0%) |
| $2,500 to $2,999 | 15 (4.2%) | 0 (0.0%) |
| $3,000 or more | 17 (4.7%) | 0 (0.0%) |
| Total | 360 (100.0%) | 206 (100.0%) |
Physical Housing Characteristics in Darrington
Housing Structures in Darrington
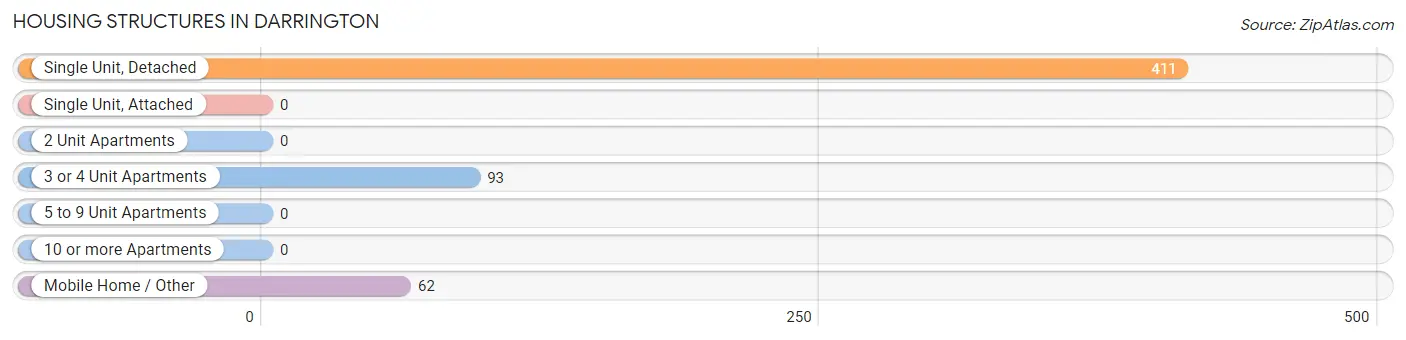
| Structure Type | # Housing Units | % Housing Units |
| Single Unit, Detached | 411 | 72.6% |
| Single Unit, Attached | 0 | 0.0% |
| 2 Unit Apartments | 0 | 0.0% |
| 3 or 4 Unit Apartments | 93 | 16.4% |
| 5 to 9 Unit Apartments | 0 | 0.0% |
| 10 or more Apartments | 0 | 0.0% |
| Mobile Home / Other | 62 | 11.0% |
| Total | 566 | 100.0% |
Housing Structures by Occupancy in Darrington
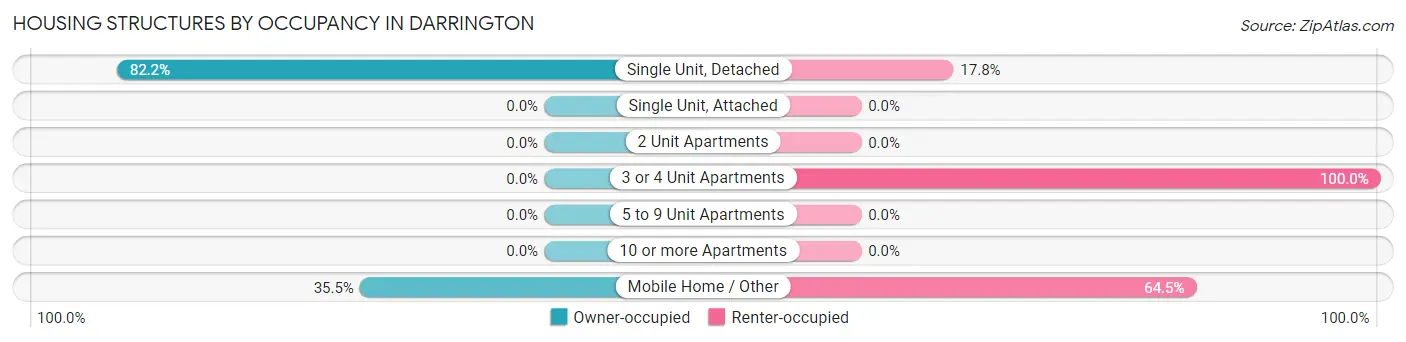
| Structure Type | Owner-occupied | Renter-occupied |
| Single Unit, Detached | 338 (82.2%) | 73 (17.8%) |
| Single Unit, Attached | 0 (0.0%) | 0 (0.0%) |
| 2 Unit Apartments | 0 (0.0%) | 0 (0.0%) |
| 3 or 4 Unit Apartments | 0 (0.0%) | 93 (100.0%) |
| 5 to 9 Unit Apartments | 0 (0.0%) | 0 (0.0%) |
| 10 or more Apartments | 0 (0.0%) | 0 (0.0%) |
| Mobile Home / Other | 22 (35.5%) | 40 (64.5%) |
| Total | 360 (63.6%) | 206 (36.4%) |
Housing Structures by Number of Rooms in Darrington
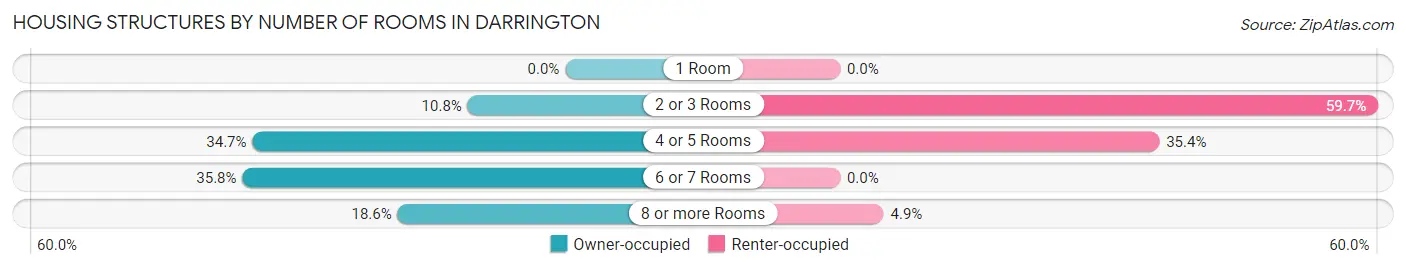
| Number of Rooms | Owner-occupied | Renter-occupied |
| 1 Room | 0 (0.0%) | 0 (0.0%) |
| 2 or 3 Rooms | 39 (10.8%) | 123 (59.7%) |
| 4 or 5 Rooms | 125 (34.7%) | 73 (35.4%) |
| 6 or 7 Rooms | 129 (35.8%) | 0 (0.0%) |
| 8 or more Rooms | 67 (18.6%) | 10 (4.9%) |
| Total | 360 (100.0%) | 206 (100.0%) |
Housing Structure by Heating Type in Darrington
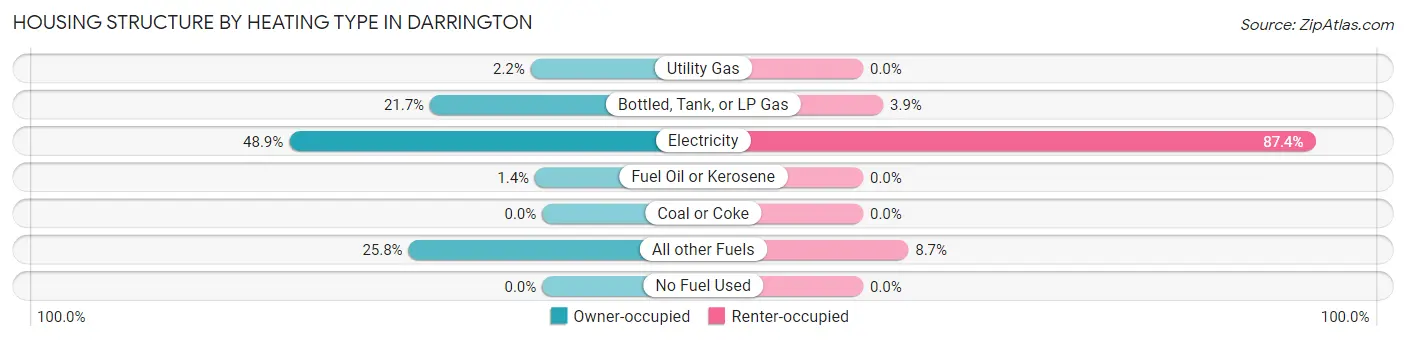
| Heating Type | Owner-occupied | Renter-occupied |
| Utility Gas | 8 (2.2%) | 0 (0.0%) |
| Bottled, Tank, or LP Gas | 78 (21.7%) | 8 (3.9%) |
| Electricity | 176 (48.9%) | 180 (87.4%) |
| Fuel Oil or Kerosene | 5 (1.4%) | 0 (0.0%) |
| Coal or Coke | 0 (0.0%) | 0 (0.0%) |
| All other Fuels | 93 (25.8%) | 18 (8.7%) |
| No Fuel Used | 0 (0.0%) | 0 (0.0%) |
| Total | 360 (100.0%) | 206 (100.0%) |
Household Vehicle Usage in Darrington
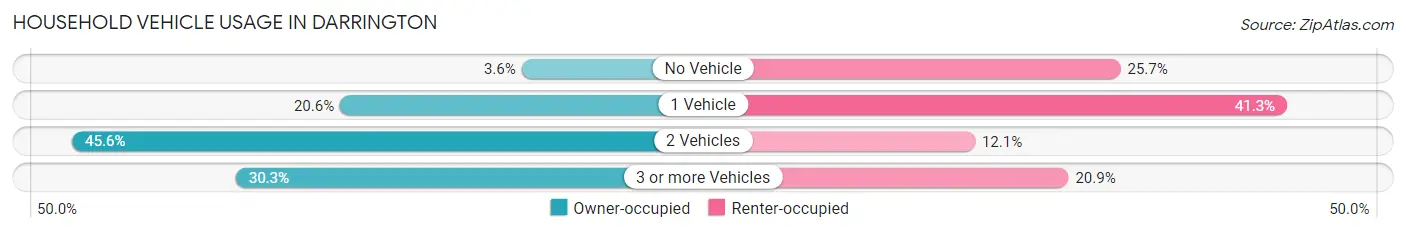
| Vehicles per Household | Owner-occupied | Renter-occupied |
| No Vehicle | 13 (3.6%) | 53 (25.7%) |
| 1 Vehicle | 74 (20.6%) | 85 (41.3%) |
| 2 Vehicles | 164 (45.6%) | 25 (12.1%) |
| 3 or more Vehicles | 109 (30.3%) | 43 (20.9%) |
| Total | 360 (100.0%) | 206 (100.0%) |
Real Estate & Mortgages in Darrington
Real Estate and Mortgage Overview in Darrington
| Characteristic | Without Mortgage | With Mortgage |
| Housing Units | 107 | 253 |
| Median Property Value | $272,400 | $346,600 |
| Median Household Income | $41,250 | $43 |
| Monthly Housing Costs | $511 | $17 |
| Real Estate Taxes | $2,203 | $5 |
Property Value by Mortgage Status in Darrington
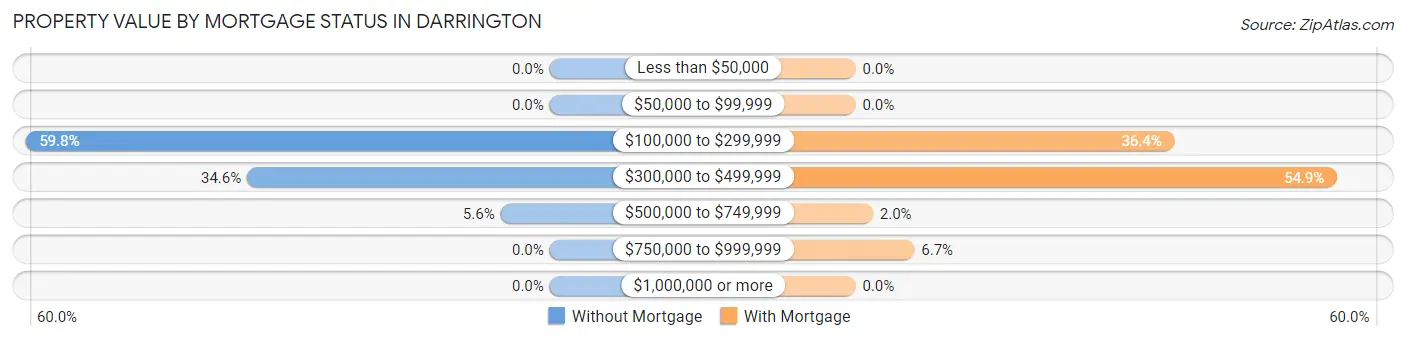
| Property Value | Without Mortgage | With Mortgage |
| Less than $50,000 | 0 (0.0%) | 0 (0.0%) |
| $50,000 to $99,999 | 0 (0.0%) | 0 (0.0%) |
| $100,000 to $299,999 | 64 (59.8%) | 92 (36.4%) |
| $300,000 to $499,999 | 37 (34.6%) | 139 (54.9%) |
| $500,000 to $749,999 | 6 (5.6%) | 5 (2.0%) |
| $750,000 to $999,999 | 0 (0.0%) | 17 (6.7%) |
| $1,000,000 or more | 0 (0.0%) | 0 (0.0%) |
| Total | 107 (100.0%) | 253 (100.0%) |
Household Income by Mortgage Status in Darrington
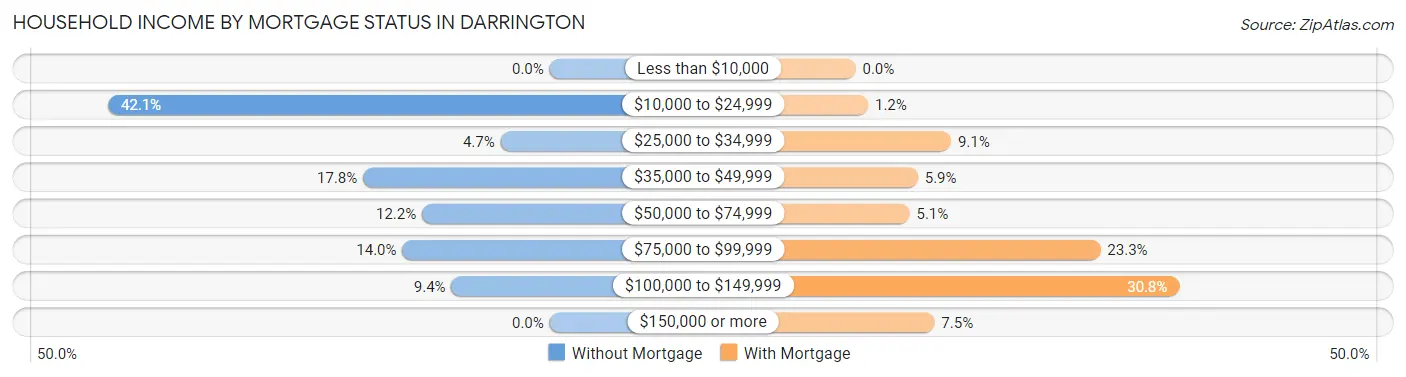
| Household Income | Without Mortgage | With Mortgage |
| Less than $10,000 | 0 (0.0%) | 0 (0.0%) |
| $10,000 to $24,999 | 45 (42.1%) | 3 (1.2%) |
| $25,000 to $34,999 | 5 (4.7%) | 23 (9.1%) |
| $35,000 to $49,999 | 19 (17.8%) | 15 (5.9%) |
| $50,000 to $74,999 | 13 (12.1%) | 13 (5.1%) |
| $75,000 to $99,999 | 15 (14.0%) | 59 (23.3%) |
| $100,000 to $149,999 | 10 (9.3%) | 78 (30.8%) |
| $150,000 or more | 0 (0.0%) | 19 (7.5%) |
| Total | 107 (100.0%) | 253 (100.0%) |
Property Value to Household Income Ratio in Darrington
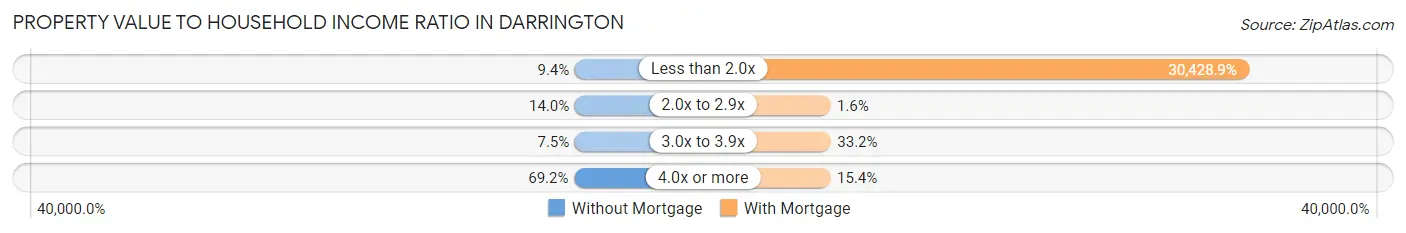
| Value-to-Income Ratio | Without Mortgage | With Mortgage |
| Less than 2.0x | 10 (9.3%) | 76,985 (30,428.8%) |
| 2.0x to 2.9x | 15 (14.0%) | 4 (1.6%) |
| 3.0x to 3.9x | 8 (7.5%) | 84 (33.2%) |
| 4.0x or more | 74 (69.2%) | 39 (15.4%) |
| Total | 107 (100.0%) | 253 (100.0%) |
Real Estate Taxes by Mortgage Status in Darrington
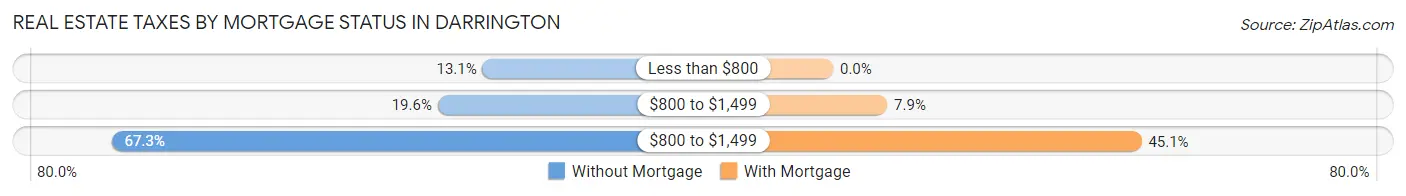
| Property Taxes | Without Mortgage | With Mortgage |
| Less than $800 | 14 (13.1%) | 0 (0.0%) |
| $800 to $1,499 | 21 (19.6%) | 20 (7.9%) |
| $800 to $1,499 | 72 (67.3%) | 114 (45.1%) |
| Total | 107 (100.0%) | 253 (100.0%) |
Health & Disability in Darrington
Health Insurance Coverage by Age in Darrington
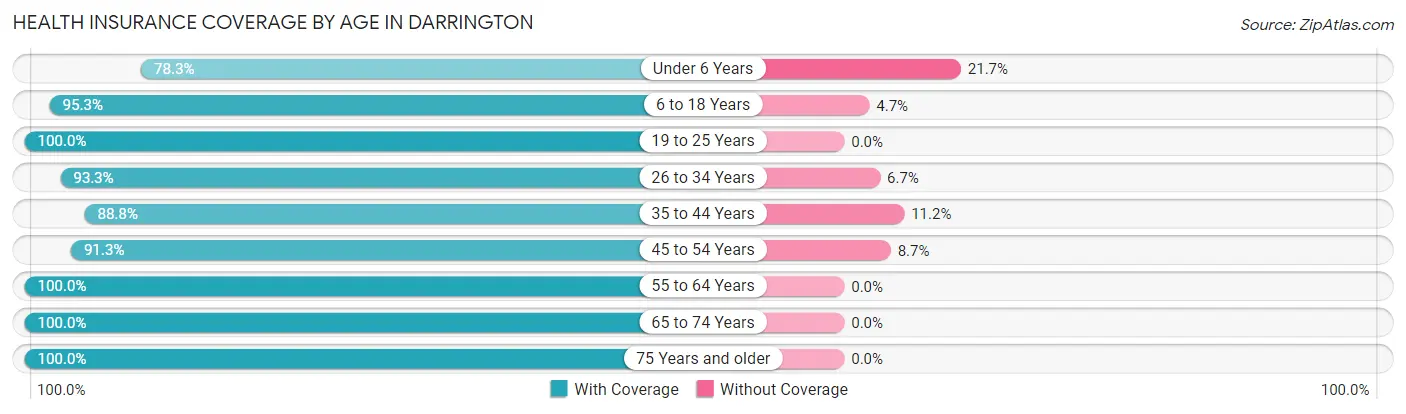
| Age Bracket | With Coverage | Without Coverage |
| Under 6 Years | 36 (78.3%) | 10 (21.7%) |
| 6 to 18 Years | 204 (95.3%) | 10 (4.7%) |
| 19 to 25 Years | 81 (100.0%) | 0 (0.0%) |
| 26 to 34 Years | 98 (93.3%) | 7 (6.7%) |
| 35 to 44 Years | 151 (88.8%) | 19 (11.2%) |
| 45 to 54 Years | 116 (91.3%) | 11 (8.7%) |
| 55 to 64 Years | 124 (100.0%) | 0 (0.0%) |
| 65 to 74 Years | 219 (100.0%) | 0 (0.0%) |
| 75 Years and older | 136 (100.0%) | 0 (0.0%) |
| Total | 1,165 (95.3%) | 57 (4.7%) |
Health Insurance Coverage by Citizenship Status in Darrington
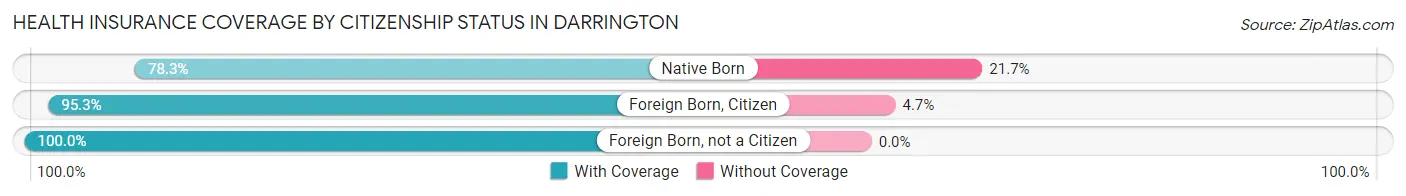
| Citizenship Status | With Coverage | Without Coverage |
| Native Born | 36 (78.3%) | 10 (21.7%) |
| Foreign Born, Citizen | 204 (95.3%) | 10 (4.7%) |
| Foreign Born, not a Citizen | 81 (100.0%) | 0 (0.0%) |
Health Insurance Coverage by Household Income in Darrington
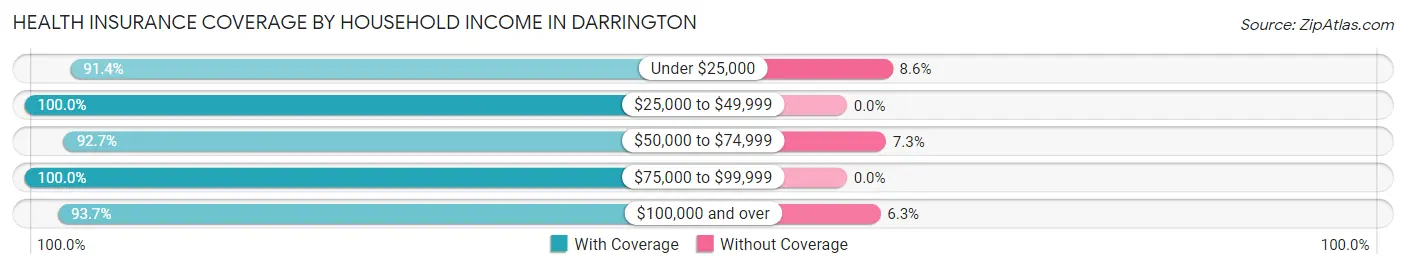
| Household Income | With Coverage | Without Coverage |
| Under $25,000 | 266 (91.4%) | 25 (8.6%) |
| $25,000 to $49,999 | 161 (100.0%) | 0 (0.0%) |
| $50,000 to $74,999 | 177 (92.7%) | 14 (7.3%) |
| $75,000 to $99,999 | 293 (100.0%) | 0 (0.0%) |
| $100,000 and over | 268 (93.7%) | 18 (6.3%) |
Public vs Private Health Insurance Coverage by Age in Darrington
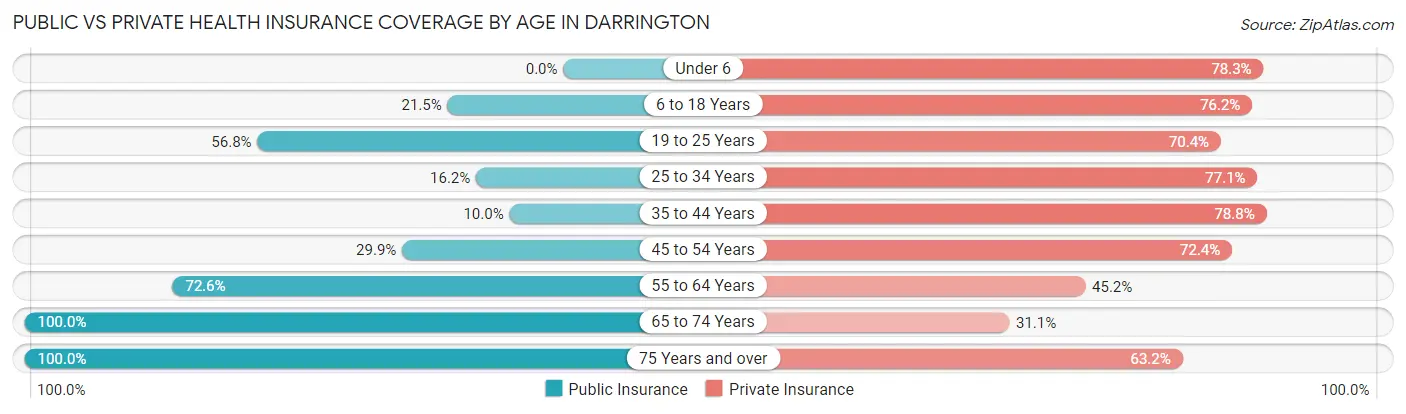
| Age Bracket | Public Insurance | Private Insurance |
| Under 6 | 0 (0.0%) | 36 (78.3%) |
| 6 to 18 Years | 46 (21.5%) | 163 (76.2%) |
| 19 to 25 Years | 46 (56.8%) | 57 (70.4%) |
| 25 to 34 Years | 17 (16.2%) | 81 (77.1%) |
| 35 to 44 Years | 17 (10.0%) | 134 (78.8%) |
| 45 to 54 Years | 38 (29.9%) | 92 (72.4%) |
| 55 to 64 Years | 90 (72.6%) | 56 (45.2%) |
| 65 to 74 Years | 219 (100.0%) | 68 (31.0%) |
| 75 Years and over | 136 (100.0%) | 86 (63.2%) |
| Total | 609 (49.8%) | 773 (63.3%) |
Disability Status by Sex by Age in Darrington
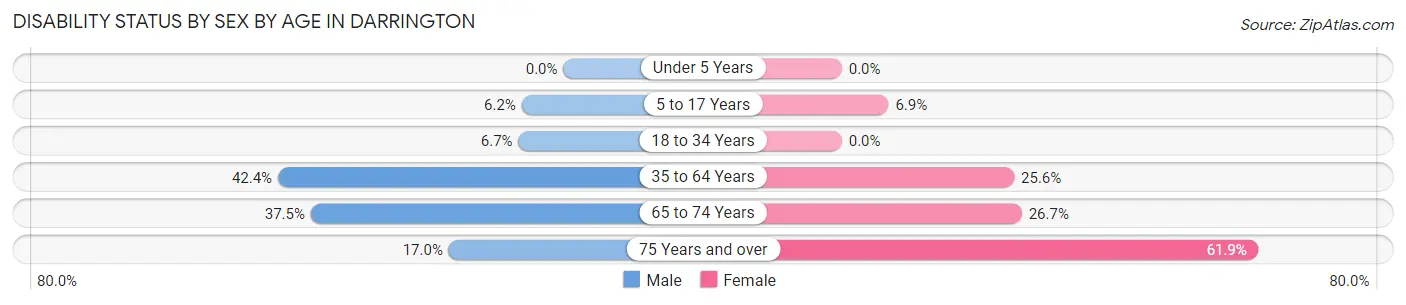
| Age Bracket | Male | Female |
| Under 5 Years | 0 (0.0%) | 0 (0.0%) |
| 5 to 17 Years | 7 (6.2%) | 7 (6.9%) |
| 18 to 34 Years | 7 (6.7%) | 0 (0.0%) |
| 35 to 64 Years | 89 (42.4%) | 54 (25.6%) |
| 65 to 74 Years | 33 (37.5%) | 35 (26.7%) |
| 75 Years and over | 16 (17.0%) | 26 (61.9%) |
Disability Class by Sex by Age in Darrington
Disability Class: Hearing Difficulty
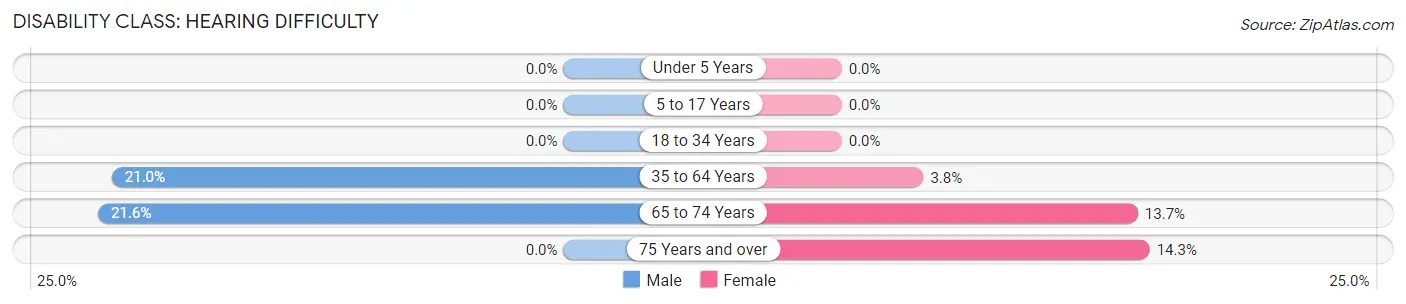
| Age Bracket | Male | Female |
| Under 5 Years | 0 (0.0%) | 0 (0.0%) |
| 5 to 17 Years | 0 (0.0%) | 0 (0.0%) |
| 18 to 34 Years | 0 (0.0%) | 0 (0.0%) |
| 35 to 64 Years | 44 (20.9%) | 8 (3.8%) |
| 65 to 74 Years | 19 (21.6%) | 18 (13.7%) |
| 75 Years and over | 0 (0.0%) | 6 (14.3%) |
Disability Class: Vision Difficulty
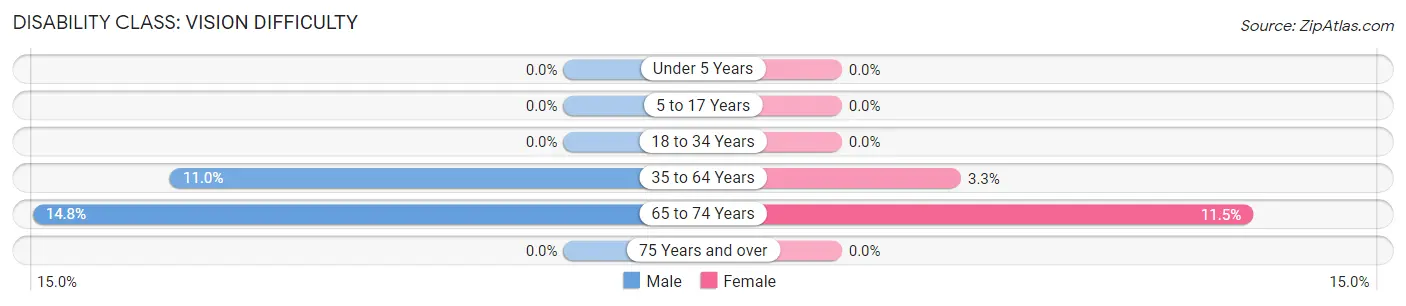
| Age Bracket | Male | Female |
| Under 5 Years | 0 (0.0%) | 0 (0.0%) |
| 5 to 17 Years | 0 (0.0%) | 0 (0.0%) |
| 18 to 34 Years | 0 (0.0%) | 0 (0.0%) |
| 35 to 64 Years | 23 (11.0%) | 7 (3.3%) |
| 65 to 74 Years | 13 (14.8%) | 15 (11.5%) |
| 75 Years and over | 0 (0.0%) | 0 (0.0%) |
Disability Class: Cognitive Difficulty
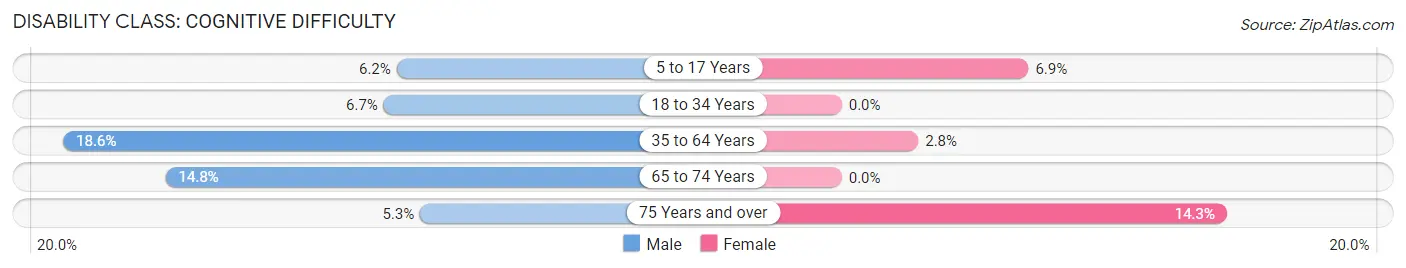
| Age Bracket | Male | Female |
| 5 to 17 Years | 7 (6.2%) | 7 (6.9%) |
| 18 to 34 Years | 7 (6.7%) | 0 (0.0%) |
| 35 to 64 Years | 39 (18.6%) | 6 (2.8%) |
| 65 to 74 Years | 13 (14.8%) | 0 (0.0%) |
| 75 Years and over | 5 (5.3%) | 6 (14.3%) |
Disability Class: Ambulatory Difficulty
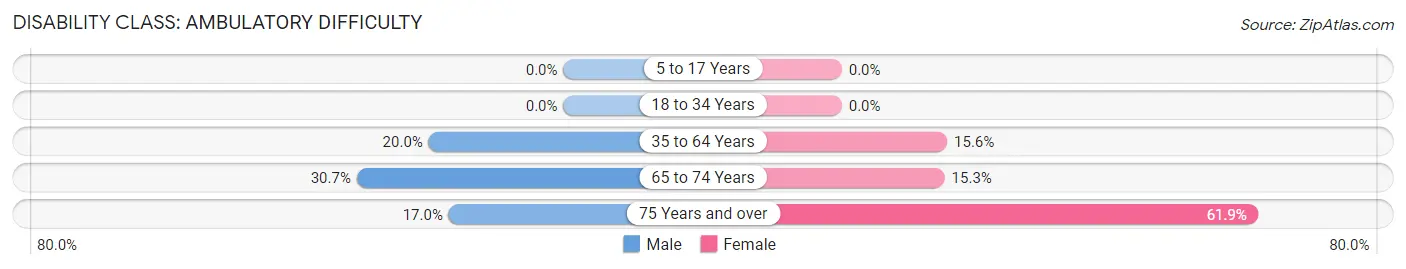
| Age Bracket | Male | Female |
| 5 to 17 Years | 0 (0.0%) | 0 (0.0%) |
| 18 to 34 Years | 0 (0.0%) | 0 (0.0%) |
| 35 to 64 Years | 42 (20.0%) | 33 (15.6%) |
| 65 to 74 Years | 27 (30.7%) | 20 (15.3%) |
| 75 Years and over | 16 (17.0%) | 26 (61.9%) |
Disability Class: Self-Care Difficulty
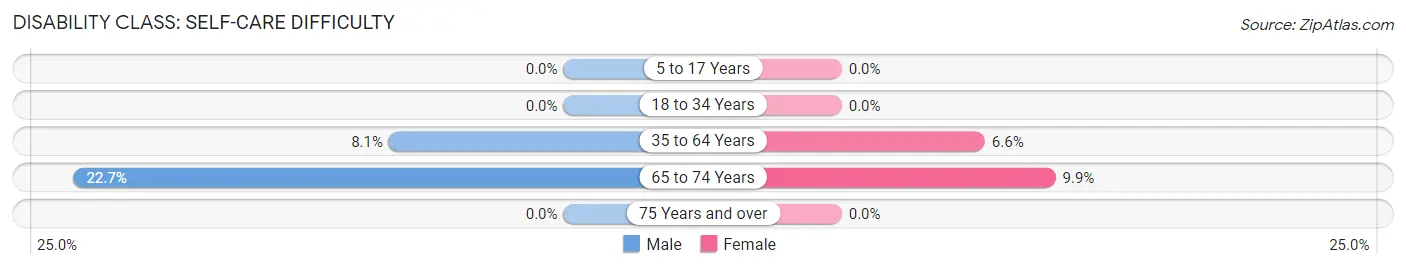
| Age Bracket | Male | Female |
| 5 to 17 Years | 0 (0.0%) | 0 (0.0%) |
| 18 to 34 Years | 0 (0.0%) | 0 (0.0%) |
| 35 to 64 Years | 17 (8.1%) | 14 (6.6%) |
| 65 to 74 Years | 20 (22.7%) | 13 (9.9%) |
| 75 Years and over | 0 (0.0%) | 0 (0.0%) |
Technology Access in Darrington
Computing Device Access in Darrington
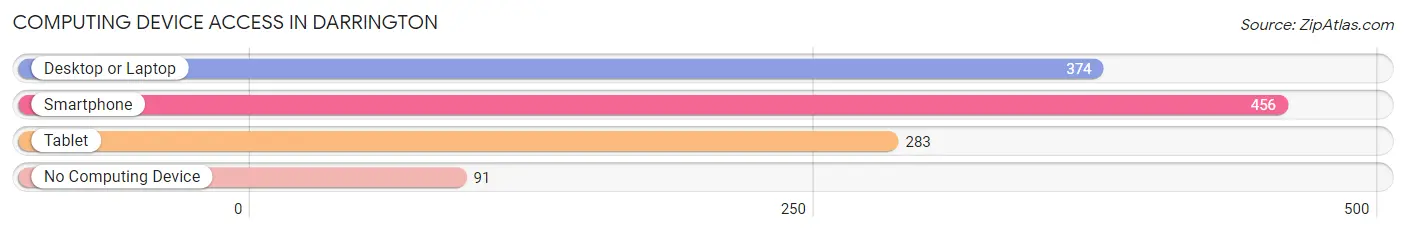
| Device Type | # Households | % Households |
| Desktop or Laptop | 374 | 66.1% |
| Smartphone | 456 | 80.6% |
| Tablet | 283 | 50.0% |
| No Computing Device | 91 | 16.1% |
| Total | 566 | 100.0% |
Internet Access in Darrington
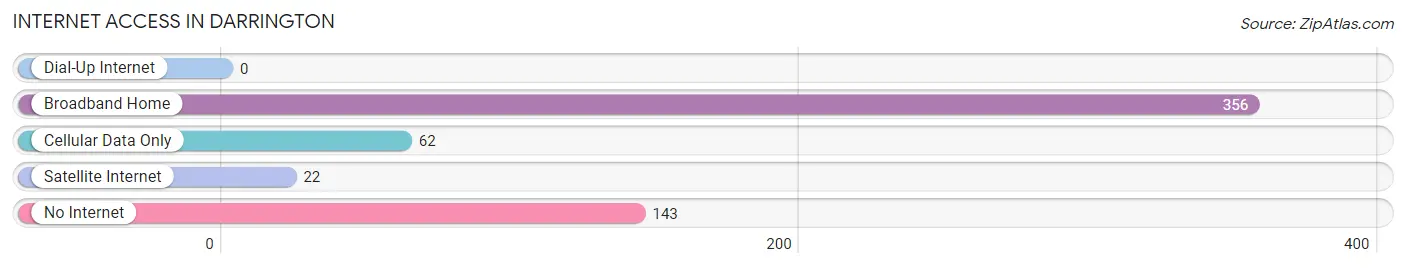
| Internet Type | # Households | % Households |
| Dial-Up Internet | 0 | 0.0% |
| Broadband Home | 356 | 62.9% |
| Cellular Data Only | 62 | 11.0% |
| Satellite Internet | 22 | 3.9% |
| No Internet | 143 | 25.3% |
| Total | 566 | 100.0% |
Darrington Summary
Darrington, Washington is a small town located in the foothills of the Cascade Mountains in Snohomish County, Washington. The town is situated at the confluence of the Sauk and Stillaguamish Rivers, and is surrounded by the Glacier Peak Wilderness and the Mount Baker-Snoqualmie National Forest. The town has a population of 1,347 as of the 2010 census, and is the gateway to the North Cascades National Park.
History
The area around Darrington was first inhabited by the Sauk-Suiattle and Stillaguamish Native American tribes. The first non-native settlers arrived in the area in the late 1800s, and the town was officially founded in 1910. The town was named after the Darrington family, who were among the first settlers in the area.
The town was initially a logging and mining town, and the local economy was heavily dependent on the timber industry. The town was also home to a number of sawmills and logging camps. In the 1950s, the town began to transition away from the timber industry, and the local economy shifted to tourism and recreation.
Geography
Darrington is located in the foothills of the Cascade Mountains in Snohomish County, Washington. The town is situated at the confluence of the Sauk and Stillaguamish Rivers, and is surrounded by the Glacier Peak Wilderness and the Mount Baker-Snoqualmie National Forest. The town is located approximately 50 miles northeast of Seattle, and is accessible via State Route 530.
The town has a total area of 2.2 square miles, all of which is land. The town is located at an elevation of 1,000 feet above sea level. The climate in Darrington is classified as a warm-summer Mediterranean climate, with warm, dry summers and cool, wet winters.
Economy
The economy of Darrington is largely based on tourism and recreation. The town is a popular destination for outdoor activities such as camping, hiking, fishing, and hunting. The town is also home to a number of small businesses, including restaurants, shops, and lodging.
The town is also home to a number of logging and timber-related businesses, including sawmills and logging camps. The local economy is also supported by the nearby North Cascades National Park, which attracts thousands of visitors each year.
Demographics
As of the 2010 census, the population of Darrington was 1,347. The racial makeup of the town was 94.3% White, 0.7% Native American, 0.3% Asian, 0.2% African American, 0.1% Pacific Islander, and 4.4% from other races. The median household income in the town was $41,250, and the median family income was $48,750.
The town is home to a number of churches, including the Darrington Community Church, the Darrington United Methodist Church, and the Darrington Assembly of God. The town is also home to a number of schools, including the Darrington Elementary School, the Darrington Middle School, and the Darrington High School.
Common Questions
What is Per Capita Income in Darrington?
Per Capita income in Darrington is $29,540.
What is the Median Family Income in Darrington?
Median Family Income in Darrington is $69,028.
What is the Median Household income in Darrington?
Median Household Income in Darrington is $48,750.
What is Income or Wage Gap in Darrington?
Income or Wage Gap in Darrington is 59.6%.
Women in Darrington earn 40.4 cents for every dollar earned by a man.
What is Inequality or Gini Index in Darrington?
Inequality or Gini Index in Darrington is 0.42.
What is the Total Population of Darrington?
Total Population of Darrington is 1,233.
What is the Total Male Population of Darrington?
Total Male Population of Darrington is 636.
What is the Total Female Population of Darrington?
Total Female Population of Darrington is 597.
What is the Ratio of Males per 100 Females in Darrington?
There are 106.53 Males per 100 Females in Darrington.
What is the Ratio of Females per 100 Males in Darrington?
There are 93.87 Females per 100 Males in Darrington.
What is the Median Population Age in Darrington?
Median Population Age in Darrington is 45.0 Years.
What is the Average Family Size in Darrington
Average Family Size in Darrington is 2.8 People.
What is the Average Household Size in Darrington
Average Household Size in Darrington is 2.2 People.
How Large is the Labor Force in Darrington?
There are 500 People in the Labor Forcein in Darrington.
What is the Percentage of People in the Labor Force in Darrington?
48.2% of People are in the Labor Force in Darrington.
What is the Unemployment Rate in Darrington?
Unemployment Rate in Darrington is 13.8%.