Cities with the Highest Percentage of Population Employed in Cleaning & Maintenance in Washington
RELATED REPORTS & OPTIONS
Cleaning & Maintenance
Washington
Compare Cities
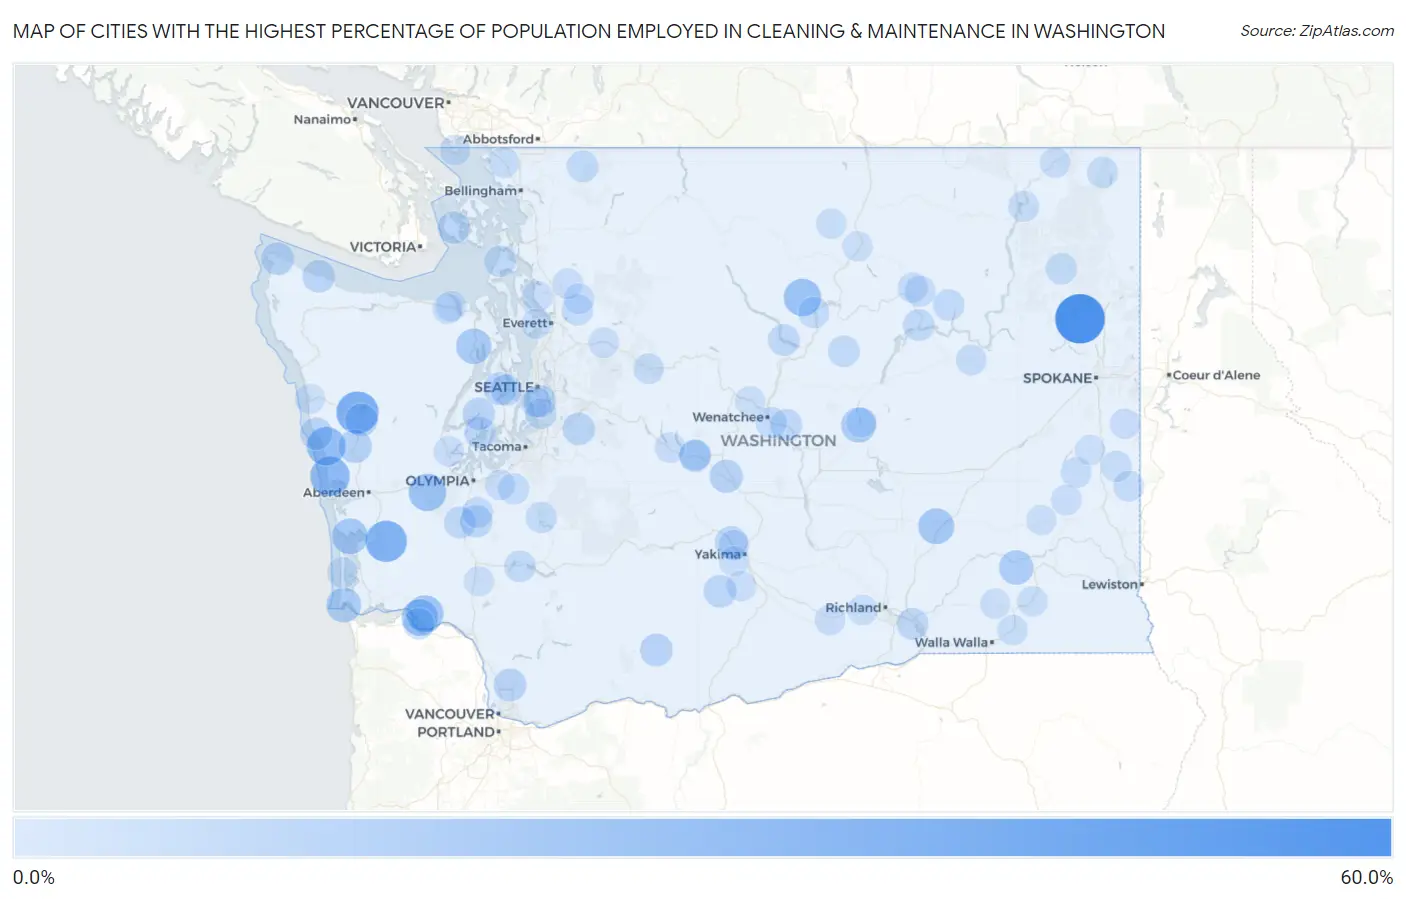
Map of Cities with the Highest Percentage of Population Employed in Cleaning & Maintenance in Washington
0.0%
60.0%
Cities with the Highest Percentage of Population Employed in Cleaning & Maintenance in Washington
| City | % Employed | vs State | vs National | |
| 1. | Clayton | 57.3% | 3.0%(+54.4)#1 | 3.5%(+53.9)#61 |
| 2. | Amanda Park | 37.5% | 3.0%(+34.5)#2 | 3.5%(+34.0)#166 |
| 3. | Willapa | 35.2% | 3.0%(+32.2)#3 | 3.5%(+31.7)#186 |
| 4. | Bow | 34.7% | 3.0%(+31.7)#4 | 3.5%(+31.2)#190 |
| 5. | Ocosta | 33.3% | 3.0%(+30.4)#5 | 3.5%(+29.9)#216 |
| 6. | Ocean City | 30.4% | 3.0%(+27.5)#6 | 3.5%(+27.0)#261 |
| 7. | Qui Nai Elt Village | 28.6% | 3.0%(+25.6)#7 | 3.5%(+25.1)#303 |
| 8. | Beverly | 26.5% | 3.0%(+23.5)#8 | 3.5%(+23.0)#346 |
| 9. | Malone | 25.0% | 3.0%(+22.0)#9 | 3.5%(+21.5)#385 |
| 10. | Methow | 25.0% | 3.0%(+22.0)#10 | 3.5%(+21.5)#393 |
| 11. | Upper Elochoman | 23.8% | 3.0%(+20.8)#11 | 3.5%(+20.3)#436 |
| 12. | Lower Elochoman | 22.8% | 3.0%(+19.8)#12 | 3.5%(+19.3)#480 |
| 13. | Tokeland | 21.1% | 3.0%(+18.1)#13 | 3.5%(+17.6)#566 |
| 14. | Hatton | 21.0% | 3.0%(+18.0)#14 | 3.5%(+17.5)#571 |
| 15. | Quilcene | 19.6% | 3.0%(+16.6)#15 | 3.5%(+16.1)#667 |
| 16. | Lakeview | 19.0% | 3.0%(+16.0)#16 | 3.5%(+15.5)#707 |
| 17. | Ilwaco | 18.3% | 3.0%(+15.3)#17 | 3.5%(+14.8)#752 |
| 18. | Starbuck | 17.5% | 3.0%(+14.6)#18 | 3.5%(+14.1)#818 |
| 19. | Humptulips | 15.1% | 3.0%(+12.1)#19 | 3.5%(+11.6)#1,097 |
| 20. | Thorp | 14.6% | 3.0%(+11.7)#20 | 3.5%(+11.2)#1,172 |
| 21. | Rocky Point | 13.8% | 3.0%(+10.8)#21 | 3.5%(+10.3)#1,350 |
| 22. | Neilton | 13.6% | 3.0%(+10.6)#22 | 3.5%(+10.1)#1,392 |
| 23. | Cherry Grove | 13.4% | 3.0%(+10.4)#23 | 3.5%(+9.91)#1,436 |
| 24. | Glenwood | 13.3% | 3.0%(+10.3)#24 | 3.5%(+9.79)#1,468 |
| 25. | Neah Bay | 13.2% | 3.0%(+10.2)#25 | 3.5%(+9.74)#1,478 |
| 26. | Eschbach | 13.1% | 3.0%(+10.1)#26 | 3.5%(+9.59)#1,516 |
| 27. | White Swan | 13.0% | 3.0%(+10.0)#27 | 3.5%(+9.54)#1,539 |
| 28. | Clallam Bay | 13.0% | 3.0%(+9.99)#28 | 3.5%(+9.49)#1,552 |
| 29. | Ravensdale | 12.6% | 3.0%(+9.67)#29 | 3.5%(+9.17)#1,650 |
| 30. | Taholah | 12.6% | 3.0%(+9.60)#30 | 3.5%(+9.10)#1,669 |
| 31. | Friday Harbor | 12.3% | 3.0%(+9.30)#31 | 3.5%(+8.80)#1,760 |
| 32. | Belfair | 12.2% | 3.0%(+9.26)#32 | 3.5%(+8.76)#1,777 |
| 33. | Bucoda | 12.0% | 3.0%(+8.98)#33 | 3.5%(+8.48)#1,873 |
| 34. | Boulevard Park | 11.9% | 3.0%(+8.93)#34 | 3.5%(+8.43)#1,888 |
| 35. | South Cle Elum | 11.7% | 3.0%(+8.68)#35 | 3.5%(+8.18)#1,957 |
| 36. | Roche Harbor | 11.4% | 3.0%(+8.42)#36 | 3.5%(+7.92)#2,050 |
| 37. | Grand Mound | 11.3% | 3.0%(+8.31)#37 | 3.5%(+7.81)#2,099 |
| 38. | Grapeview | 11.1% | 3.0%(+8.11)#38 | 3.5%(+7.61)#2,178 |
| 39. | Finley | 11.0% | 3.0%(+8.06)#39 | 3.5%(+7.56)#2,192 |
| 40. | Rock Island | 11.0% | 3.0%(+8.04)#40 | 3.5%(+7.54)#2,197 |
| 41. | Manson | 10.7% | 3.0%(+7.71)#41 | 3.5%(+7.21)#2,327 |
| 42. | Mansfield | 10.5% | 3.0%(+7.54)#42 | 3.5%(+7.04)#2,385 |
| 43. | Whidbey Island Station | 10.4% | 3.0%(+7.46)#43 | 3.5%(+6.97)#2,425 |
| 44. | Coulee Dam | 10.4% | 3.0%(+7.45)#44 | 3.5%(+6.96)#2,434 |
| 45. | Enetai | 10.1% | 3.0%(+7.07)#45 | 3.5%(+6.57)#2,591 |
| 46. | Glacier | 10.0% | 3.0%(+7.06)#46 | 3.5%(+6.56)#2,594 |
| 47. | Mossyrock | 10.0% | 3.0%(+7.05)#47 | 3.5%(+6.55)#2,604 |
| 48. | Keller | 10.0% | 3.0%(+7.02)#48 | 3.5%(+6.52)#2,625 |
| 49. | Puget Island | 9.9% | 3.0%(+6.96)#49 | 3.5%(+6.46)#2,664 |
| 50. | Cle Elum | 9.7% | 3.0%(+6.72)#50 | 3.5%(+6.22)#2,792 |
| 51. | Pateros | 9.7% | 3.0%(+6.68)#51 | 3.5%(+6.18)#2,807 |
| 52. | South Wenatchee | 9.3% | 3.0%(+6.32)#52 | 3.5%(+5.82)#2,995 |
| 53. | Chewelah | 9.2% | 3.0%(+6.26)#53 | 3.5%(+5.76)#3,028 |
| 54. | Roy | 9.2% | 3.0%(+6.23)#54 | 3.5%(+5.73)#3,044 |
| 55. | La Grande | 9.1% | 3.0%(+6.11)#55 | 3.5%(+5.61)#3,105 |
| 56. | Lake Bosworth | 9.1% | 3.0%(+6.07)#56 | 3.5%(+5.58)#3,144 |
| 57. | Tenino | 9.0% | 3.0%(+5.99)#57 | 3.5%(+5.49)#3,193 |
| 58. | Seatac | 8.8% | 3.0%(+5.86)#58 | 3.5%(+5.36)#3,297 |
| 59. | Oakesdale | 8.7% | 3.0%(+5.77)#59 | 3.5%(+5.27)#3,363 |
| 60. | Custer | 8.7% | 3.0%(+5.76)#60 | 3.5%(+5.26)#3,368 |
| 61. | Metaline Falls | 8.7% | 3.0%(+5.71)#61 | 3.5%(+5.21)#3,397 |
| 62. | Nespelem | 8.7% | 3.0%(+5.71)#62 | 3.5%(+5.21)#3,400 |
| 63. | Garfield | 8.5% | 3.0%(+5.55)#63 | 3.5%(+5.05)#3,518 |
| 64. | Marcus | 8.5% | 3.0%(+5.53)#64 | 3.5%(+5.03)#3,541 |
| 65. | Skykomish | 8.3% | 3.0%(+5.35)#65 | 3.5%(+4.85)#3,679 |
| 66. | Ocean Park | 8.3% | 3.0%(+5.32)#66 | 3.5%(+4.82)#3,702 |
| 67. | St John | 8.2% | 3.0%(+5.20)#67 | 3.5%(+4.70)#3,803 |
| 68. | Creston | 8.1% | 3.0%(+5.13)#68 | 3.5%(+4.63)#3,878 |
| 69. | Endicott | 8.1% | 3.0%(+5.08)#69 | 3.5%(+4.58)#3,909 |
| 70. | Arlington Heights | 8.1% | 3.0%(+5.08)#70 | 3.5%(+4.58)#3,916 |
| 71. | Canyon Creek | 8.0% | 3.0%(+5.03)#71 | 3.5%(+4.53)#3,959 |
| 72. | Startup | 8.0% | 3.0%(+4.99)#72 | 3.5%(+4.49)#3,989 |
| 73. | Kayak Point | 7.9% | 3.0%(+4.95)#73 | 3.5%(+4.45)#4,025 |
| 74. | Nisqually Indian Community | 7.7% | 3.0%(+4.76)#74 | 3.5%(+4.26)#4,193 |
| 75. | Prosser | 7.7% | 3.0%(+4.73)#75 | 3.5%(+4.23)#4,209 |
| 76. | White Center | 7.6% | 3.0%(+4.59)#76 | 3.5%(+4.09)#4,357 |
| 77. | Sequim | 7.6% | 3.0%(+4.59)#77 | 3.5%(+4.09)#4,359 |
| 78. | Fairfield | 7.5% | 3.0%(+4.55)#78 | 3.5%(+4.05)#4,386 |
| 79. | Conconully | 7.5% | 3.0%(+4.48)#79 | 3.5%(+3.98)#4,453 |
| 80. | Dixie | 7.5% | 3.0%(+4.48)#80 | 3.5%(+3.98)#4,456 |
| 81. | Shelton | 7.5% | 3.0%(+4.47)#81 | 3.5%(+3.97)#4,461 |
| 82. | River Road | 7.4% | 3.0%(+4.46)#82 | 3.5%(+3.96)#4,470 |
| 83. | Dayton | 7.4% | 3.0%(+4.46)#83 | 3.5%(+3.96)#4,478 |
| 84. | Easton | 7.4% | 3.0%(+4.45)#84 | 3.5%(+3.95)#4,481 |
| 85. | Point Roberts | 7.4% | 3.0%(+4.44)#85 | 3.5%(+3.94)#4,487 |
| 86. | Northport | 7.4% | 3.0%(+4.42)#86 | 3.5%(+3.92)#4,510 |
| 87. | Gleed | 7.3% | 3.0%(+4.36)#87 | 3.5%(+3.86)#4,586 |
| 88. | Benton City | 7.3% | 3.0%(+4.34)#88 | 3.5%(+3.84)#4,601 |
| 89. | Nespelem Community | 7.3% | 3.0%(+4.29)#89 | 3.5%(+3.79)#4,655 |
| 90. | Soap Lake | 7.2% | 3.0%(+4.26)#90 | 3.5%(+3.76)#4,694 |
| 91. | Toledo | 7.2% | 3.0%(+4.19)#91 | 3.5%(+3.69)#4,755 |
| 92. | Omak | 7.2% | 3.0%(+4.18)#92 | 3.5%(+3.68)#4,758 |
| 93. | Malden | 7.1% | 3.0%(+4.16)#93 | 3.5%(+3.66)#4,785 |
| 94. | Clinton | 7.0% | 3.0%(+4.05)#94 | 3.5%(+3.55)#4,891 |
| 95. | Cashmere | 7.0% | 3.0%(+4.01)#95 | 3.5%(+3.51)#4,940 |
| 96. | Prescott | 7.0% | 3.0%(+3.99)#96 | 3.5%(+3.49)#4,961 |
| 97. | Queets | 6.9% | 3.0%(+3.91)#97 | 3.5%(+3.41)#5,062 |
| 98. | Harrah | 6.9% | 3.0%(+3.88)#98 | 3.5%(+3.38)#5,109 |
| 99. | Ahtanum | 6.8% | 3.0%(+3.84)#99 | 3.5%(+3.34)#5,153 |
| 100. | Lacrosse | 6.8% | 3.0%(+3.84)#100 | 3.5%(+3.34)#5,164 |
Common Questions
What are the Top 10 Cities with the Highest Percentage of Population Employed in Cleaning & Maintenance in Washington?
Top 10 Cities with the Highest Percentage of Population Employed in Cleaning & Maintenance in Washington are:
#1
57.3%
#2
37.5%
#3
35.2%
#4
30.4%
#5
28.6%
#6
25.0%
#7
25.0%
#8
23.8%
#9
22.8%
#10
21.1%
What city has the Highest Percentage of Population Employed in Cleaning & Maintenance in Washington?
Clayton has the Highest Percentage of Population Employed in Cleaning & Maintenance in Washington with 57.3%.
What is the Percentage of Population Employed in Cleaning & Maintenance in the State of Washington?
Percentage of Population Employed in Cleaning & Maintenance in Washington is 3.0%.
What is the Percentage of Population Employed in Cleaning & Maintenance in the United States?
Percentage of Population Employed in Cleaning & Maintenance in the United States is 3.5%.