Zip Codes with the Highest Percentage of Population Employed in Food Preparation & Serving in Bellevue, WA
RELATED REPORTS & OPTIONS
Food Preparation & Serving
Bellevue
Compare Zip Codes
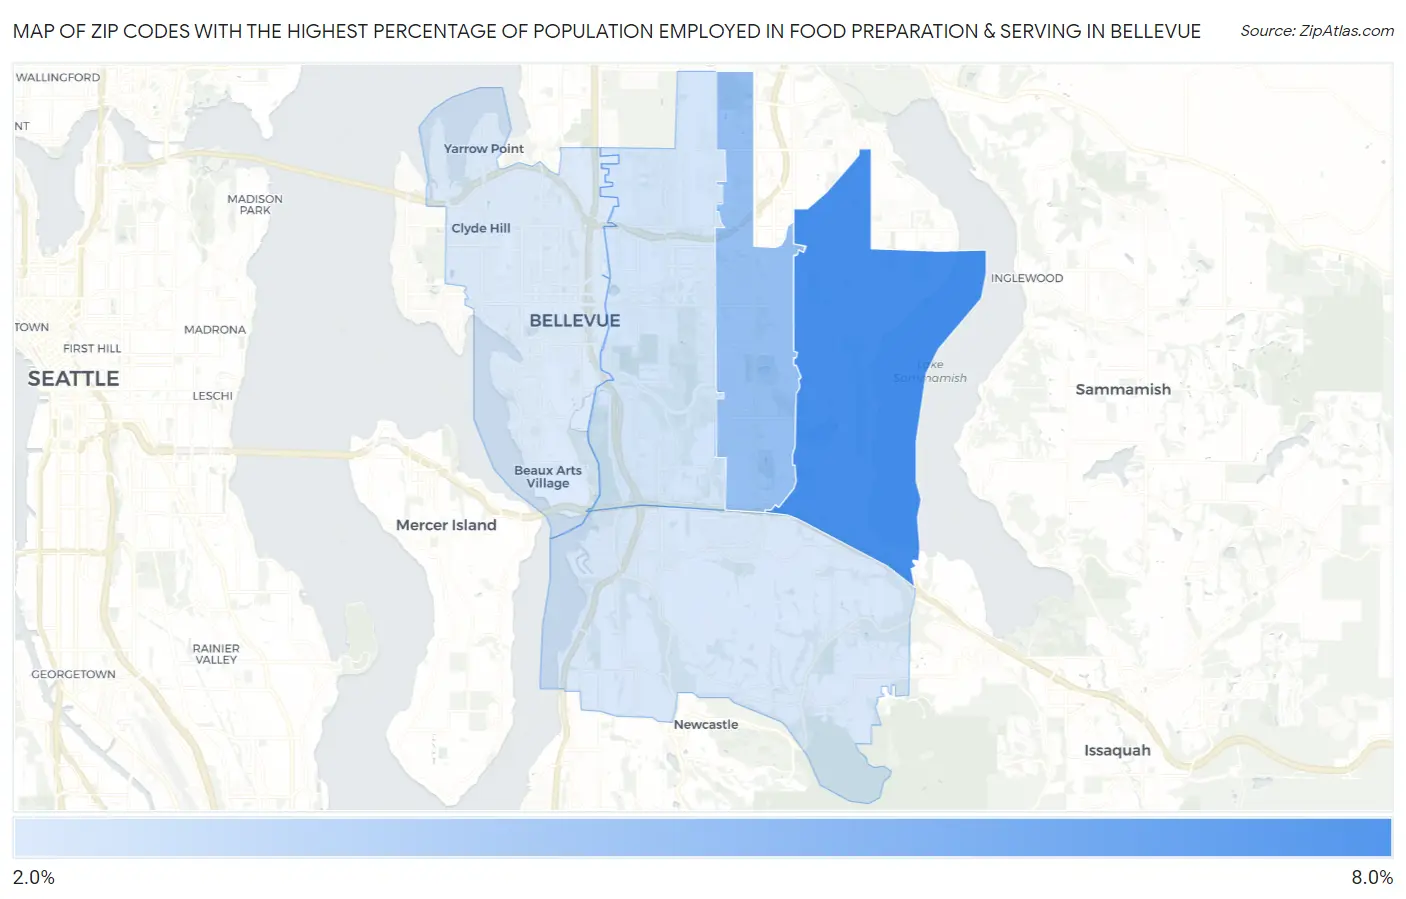
Map of Zip Codes with the Highest Percentage of Population Employed in Food Preparation & Serving in Bellevue
2.5%
6.4%
Zip Codes with the Highest Percentage of Population Employed in Food Preparation & Serving in Bellevue, WA
| Zip Code | % Employed | vs State | vs National | |
| 1. | 98008 | 6.4% | 5.1%(+1.24)#138 | 5.3%(+1.10)#8,187 |
| 2. | 98007 | 4.3% | 5.1%(-0.824)#297 | 5.3%(-0.967)#15,797 |
| 3. | 98005 | 2.7% | 5.1%(-2.43)#417 | 5.3%(-2.57)#22,382 |
| 4. | 98006 | 2.6% | 5.1%(-2.55)#423 | 5.3%(-2.70)#22,832 |
| 5. | 98004 | 2.5% | 5.1%(-2.69)#433 | 5.3%(-2.83)#23,294 |
1
Common Questions
What are the Top 3 Zip Codes with the Highest Percentage of Population Employed in Food Preparation & Serving in Bellevue, WA?
Top 3 Zip Codes with the Highest Percentage of Population Employed in Food Preparation & Serving in Bellevue, WA are:
What zip code has the Highest Percentage of Population Employed in Food Preparation & Serving in Bellevue, WA?
98008 has the Highest Percentage of Population Employed in Food Preparation & Serving in Bellevue, WA with 6.4%.
What is the Percentage of Population Employed in Food Preparation & Serving in Bellevue, WA?
Percentage of Population Employed in Food Preparation & Serving in Bellevue is 3.6%.
What is the Percentage of Population Employed in Food Preparation & Serving in Washington?
Percentage of Population Employed in Food Preparation & Serving in Washington is 5.1%.
What is the Percentage of Population Employed in Food Preparation & Serving in the United States?
Percentage of Population Employed in Food Preparation & Serving in the United States is 5.3%.