Dallesport, WA Map & Demographics
Dallesport Map
Dallesport Overview
$35,940
PER CAPITA INCOME
$80,179
AVG FAMILY INCOME
$62,759
AVG HOUSEHOLD INCOME
0.48
INEQUALITY / GINI INDEX
1,426
TOTAL POPULATION
660
MALE POPULATION
766
FEMALE POPULATION
86.16
MALES / 100 FEMALES
116.06
FEMALES / 100 MALES
42.3
MEDIAN AGE
3.1
AVG FAMILY SIZE
2.4
AVG HOUSEHOLD SIZE
618
LABOR FORCE [ PEOPLE ]
54.3%
PERCENT IN LABOR FORCE
14.1%
UNEMPLOYMENT RATE
Dallesport Zip Codes
Dallesport Area Codes
Income in Dallesport
Income Overview in Dallesport
Per Capita Income in Dallesport is $35,940, while median incomes of families and households are $80,179 and $62,759 respectively.
| Characteristic | Number | Measure |
| Per Capita Income | 1,426 | $35,940 |
| Median Family Income | 306 | $80,179 |
| Mean Family Income | 306 | $117,056 |
| Median Household Income | 589 | $62,759 |
| Mean Household Income | 589 | $84,320 |
| Income Deficit | 306 | $0 |
| Wage / Income Gap (%) | 1,426 | 0.00% |
| Wage / Income Gap ($) | 1,426 | 100.00¢ per $1 |
| Gini / Inequality Index | 1,426 | 0.48 |
Earnings by Sex in Dallesport
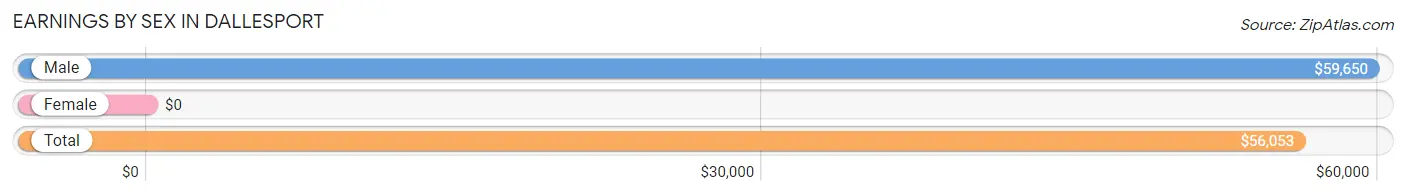
| Sex | Number | Average Earnings |
| Male | 373 (58.8%) | $59,650 |
| Female | 261 (41.2%) | $0 |
| Total | 634 (100.0%) | $56,053 |
Earnings by Sex by Income Bracket in Dallesport
The most common earnings brackets in Dallesport are $55,000 to $64,999 for men (99 | 26.5%) and $75,000 to $99,999 for women (65 | 24.9%).
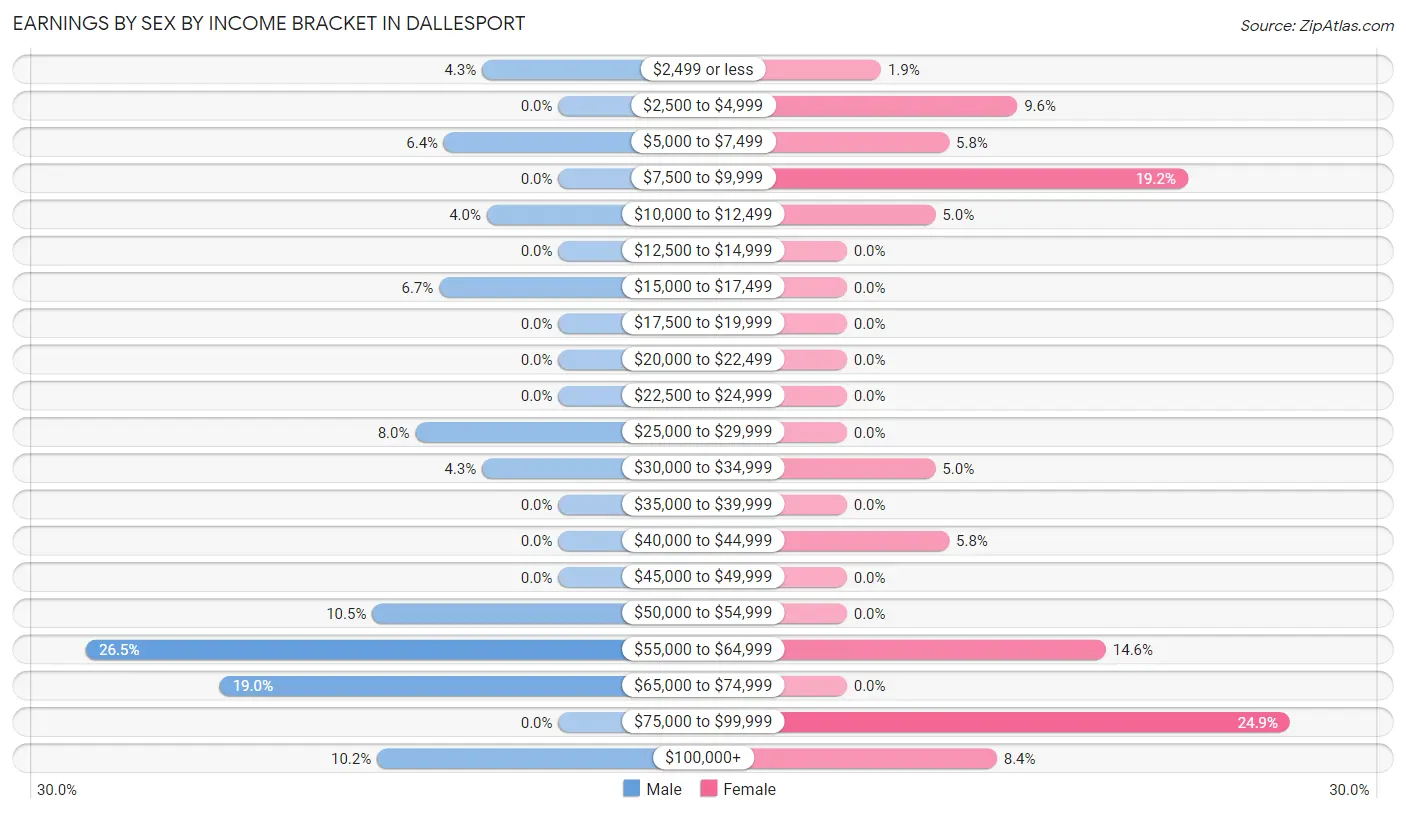
| Income | Male | Female |
| $2,499 or less | 16 (4.3%) | 5 (1.9%) |
| $2,500 to $4,999 | 0 (0.0%) | 25 (9.6%) |
| $5,000 to $7,499 | 24 (6.4%) | 15 (5.8%) |
| $7,500 to $9,999 | 0 (0.0%) | 50 (19.2%) |
| $10,000 to $12,499 | 15 (4.0%) | 13 (5.0%) |
| $12,500 to $14,999 | 0 (0.0%) | 0 (0.0%) |
| $15,000 to $17,499 | 25 (6.7%) | 0 (0.0%) |
| $17,500 to $19,999 | 0 (0.0%) | 0 (0.0%) |
| $20,000 to $22,499 | 0 (0.0%) | 0 (0.0%) |
| $22,500 to $24,999 | 0 (0.0%) | 0 (0.0%) |
| $25,000 to $29,999 | 30 (8.0%) | 0 (0.0%) |
| $30,000 to $34,999 | 16 (4.3%) | 13 (5.0%) |
| $35,000 to $39,999 | 0 (0.0%) | 0 (0.0%) |
| $40,000 to $44,999 | 0 (0.0%) | 15 (5.8%) |
| $45,000 to $49,999 | 0 (0.0%) | 0 (0.0%) |
| $50,000 to $54,999 | 39 (10.5%) | 0 (0.0%) |
| $55,000 to $64,999 | 99 (26.5%) | 38 (14.6%) |
| $65,000 to $74,999 | 71 (19.0%) | 0 (0.0%) |
| $75,000 to $99,999 | 0 (0.0%) | 65 (24.9%) |
| $100,000+ | 38 (10.2%) | 22 (8.4%) |
| Total | 373 (100.0%) | 261 (100.0%) |
Earnings by Sex by Educational Attainment in Dallesport
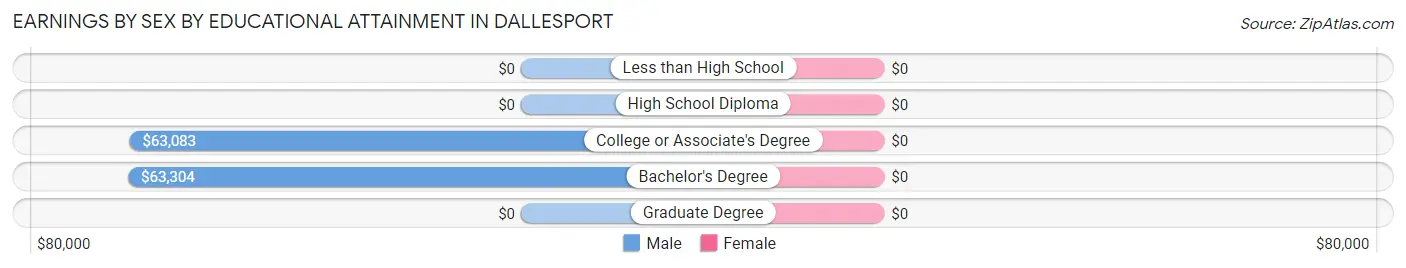
| Educational Attainment | Male Income | Female Income |
| Less than High School | - | - |
| High School Diploma | - | - |
| College or Associate's Degree | $63,083 | $0 |
| Bachelor's Degree | $63,304 | $0 |
| Graduate Degree | - | - |
| Total | $62,804 | $56,283 |
Family Income in Dallesport
Family Income Brackets in Dallesport
According to the Dallesport family income data, there are 58 families falling into the $50,000 to $74,999 income range, which is the most common income bracket and makes up 19.0% of all families.
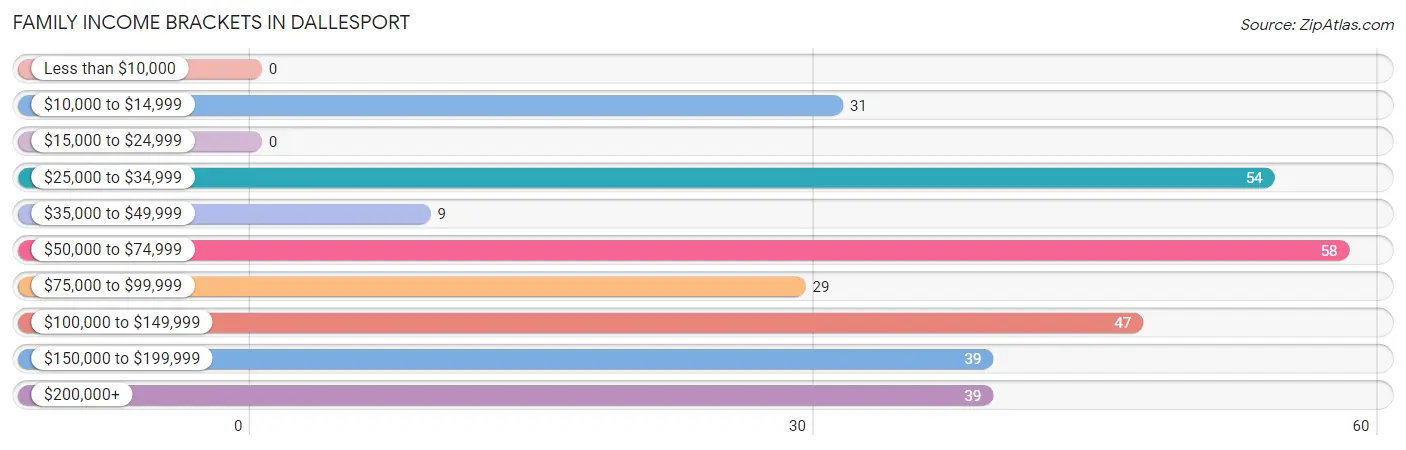
| Income Bracket | # Families | % Families |
| Less than $10,000 | 0 | 0.0% |
| $10,000 to $14,999 | 31 | 10.1% |
| $15,000 to $24,999 | 0 | 0.0% |
| $25,000 to $34,999 | 54 | 17.6% |
| $35,000 to $49,999 | 9 | 2.9% |
| $50,000 to $74,999 | 58 | 19.0% |
| $75,000 to $99,999 | 29 | 9.5% |
| $100,000 to $149,999 | 47 | 15.4% |
| $150,000 to $199,999 | 39 | 12.7% |
| $200,000+ | 39 | 12.7% |
Family Income by Famaliy Size in Dallesport
2-person families (199 | 65.0%) account for the highest median family income in Dallesport with $118,594 per family, while 2-person families (199 | 65.0%) have the highest median income of $59,297 per family member.
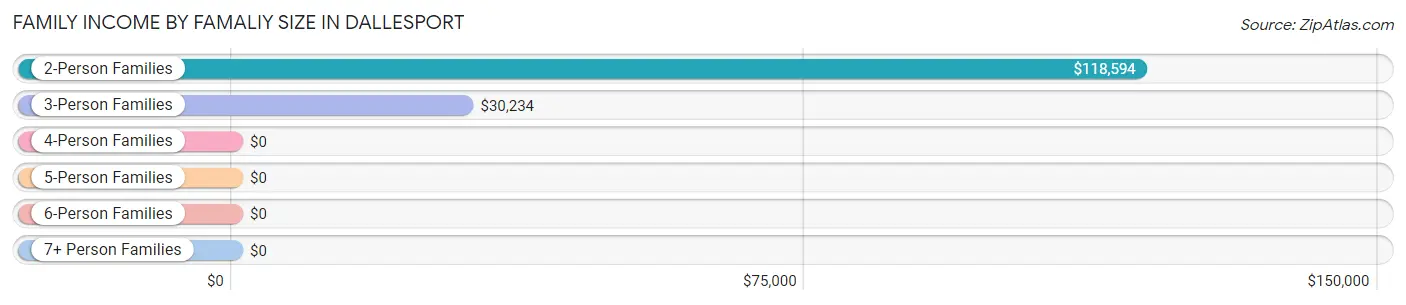
| Income Bracket | # Families | Median Income |
| 2-Person Families | 199 (65.0%) | $118,594 |
| 3-Person Families | 47 (15.4%) | $30,234 |
| 4-Person Families | 15 (4.9%) | $0 |
| 5-Person Families | 16 (5.2%) | $0 |
| 6-Person Families | 0 (0.0%) | $0 |
| 7+ Person Families | 29 (9.5%) | $0 |
| Total | 306 (100.0%) | $80,179 |
Family Income by Number of Earners in Dallesport
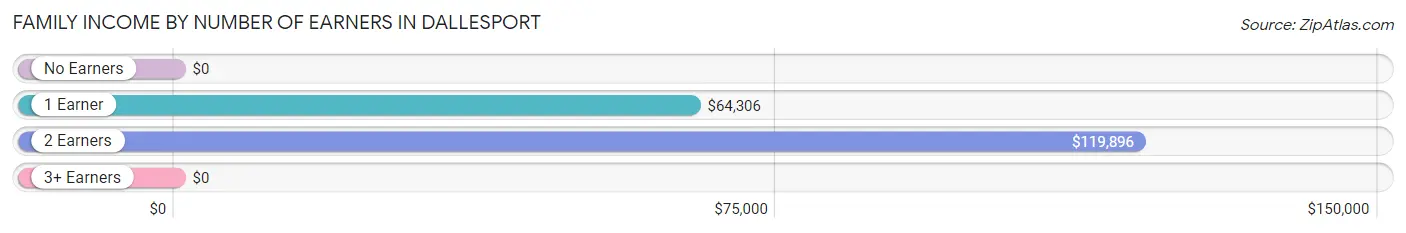
| Number of Earners | # Families | Median Income |
| No Earners | 1 (0.3%) | $0 |
| 1 Earner | 151 (49.3%) | $64,306 |
| 2 Earners | 154 (50.3%) | $119,896 |
| 3+ Earners | 0 (0.0%) | $0 |
| Total | 306 (100.0%) | $80,179 |
Household Income in Dallesport
Household Income Brackets in Dallesport
With 172 households falling in the category, the $50,000 to $74,999 income range is the most frequent in Dallesport, accounting for 29.2% of all households. In contrast, only 25 households (4.2%) fall into the less than $10,000 income bracket, making it the least populous group.
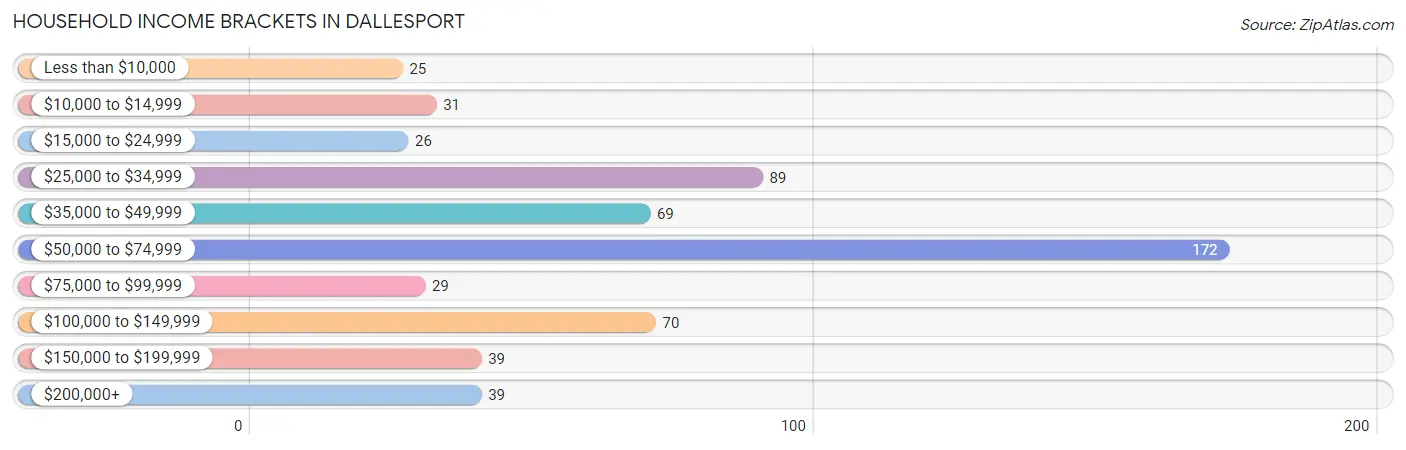
| Income Bracket | # Households | % Households |
| Less than $10,000 | 25 | 4.2% |
| $10,000 to $14,999 | 31 | 5.3% |
| $15,000 to $24,999 | 26 | 4.4% |
| $25,000 to $34,999 | 89 | 15.1% |
| $35,000 to $49,999 | 69 | 11.7% |
| $50,000 to $74,999 | 172 | 29.2% |
| $75,000 to $99,999 | 29 | 4.9% |
| $100,000 to $149,999 | 70 | 11.9% |
| $150,000 to $199,999 | 39 | 6.6% |
| $200,000+ | 39 | 6.6% |
Household Income by Householder Age in Dallesport
The median household income in Dallesport is $62,759, with the highest median household income of $67,868 found in the 45 to 64 years age bracket for the primary householder. A total of 210 households (35.6%) fall into this category. Meanwhile, the 15 to 24 years age bracket for the primary householder has the lowest median household income of $0, with 31 households (5.3%) in this group.
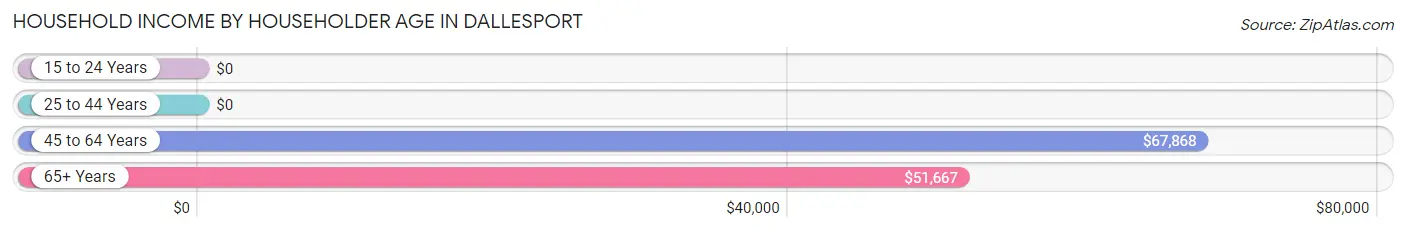
| Income Bracket | # Households | Median Income |
| 15 to 24 Years | 31 (5.3%) | $0 |
| 25 to 44 Years | 144 (24.4%) | $0 |
| 45 to 64 Years | 210 (35.6%) | $67,868 |
| 65+ Years | 204 (34.6%) | $51,667 |
| Total | 589 (100.0%) | $62,759 |
Poverty in Dallesport
Income Below Poverty by Sex and Age in Dallesport
With 12.4% poverty level for males and 34.9% for females among the residents of Dallesport, 35 to 44 year old males and 35 to 44 year old females are the most vulnerable to poverty, with 69 males (60.0%) and 117 females (79.6%) in their respective age groups living below the poverty level.
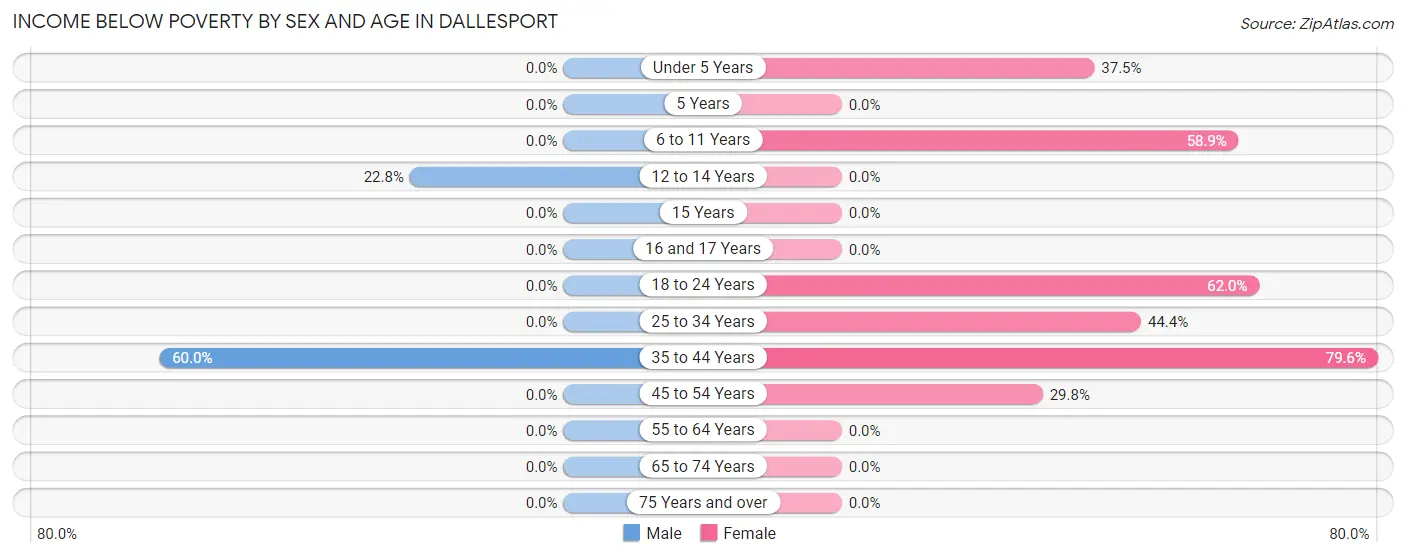
| Age Bracket | Male | Female |
| Under 5 Years | 0 (0.0%) | 21 (37.5%) |
| 5 Years | 0 (0.0%) | 0 (0.0%) |
| 6 to 11 Years | 0 (0.0%) | 33 (58.9%) |
| 12 to 14 Years | 13 (22.8%) | 0 (0.0%) |
| 15 Years | 0 (0.0%) | 0 (0.0%) |
| 16 and 17 Years | 0 (0.0%) | 0 (0.0%) |
| 18 to 24 Years | 0 (0.0%) | 31 (62.0%) |
| 25 to 34 Years | 0 (0.0%) | 28 (44.4%) |
| 35 to 44 Years | 69 (60.0%) | 117 (79.6%) |
| 45 to 54 Years | 0 (0.0%) | 37 (29.8%) |
| 55 to 64 Years | 0 (0.0%) | 0 (0.0%) |
| 65 to 74 Years | 0 (0.0%) | 0 (0.0%) |
| 75 Years and over | 0 (0.0%) | 0 (0.0%) |
| Total | 82 (12.4%) | 267 (34.9%) |
Income Above Poverty by Sex and Age in Dallesport
According to the poverty statistics in Dallesport, males aged under 5 years and females aged 5 years are the age groups that are most secure financially, with 100.0% of males and 100.0% of females in these age groups living above the poverty line.
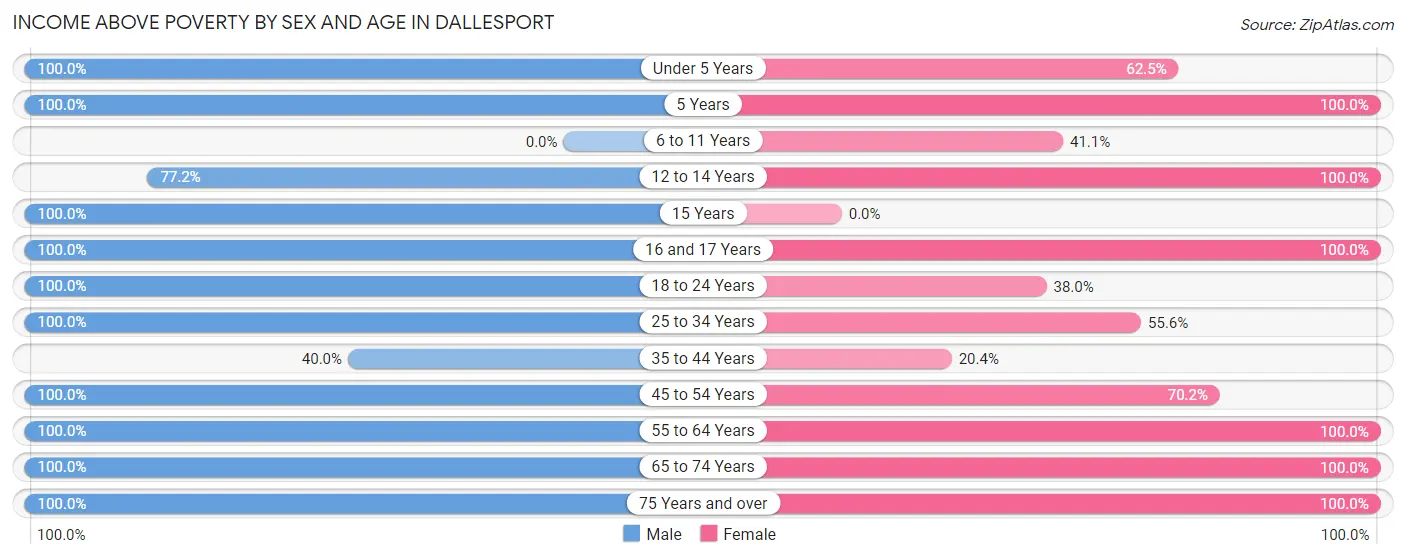
| Age Bracket | Male | Female |
| Under 5 Years | 50 (100.0%) | 35 (62.5%) |
| 5 Years | 18 (100.0%) | 28 (100.0%) |
| 6 to 11 Years | 0 (0.0%) | 23 (41.1%) |
| 12 to 14 Years | 44 (77.2%) | 7 (100.0%) |
| 15 Years | 16 (100.0%) | 0 (0.0%) |
| 16 and 17 Years | 19 (100.0%) | 18 (100.0%) |
| 18 to 24 Years | 25 (100.0%) | 19 (38.0%) |
| 25 to 34 Years | 52 (100.0%) | 35 (55.6%) |
| 35 to 44 Years | 46 (40.0%) | 30 (20.4%) |
| 45 to 54 Years | 73 (100.0%) | 87 (70.2%) |
| 55 to 64 Years | 122 (100.0%) | 100 (100.0%) |
| 65 to 74 Years | 68 (100.0%) | 36 (100.0%) |
| 75 Years and over | 45 (100.0%) | 81 (100.0%) |
| Total | 578 (87.6%) | 499 (65.1%) |
Income Below Poverty Among Married-Couple Families in Dallesport
The poverty statistics for married-couple families in Dallesport show that 7.3% or 16 of the total 218 families live below the poverty line. Families with 3 or 4 children have the highest poverty rate of 100.0%, comprising of 16 families. On the other hand, families with no children have the lowest poverty rate of 0.0%, which includes 0 families.
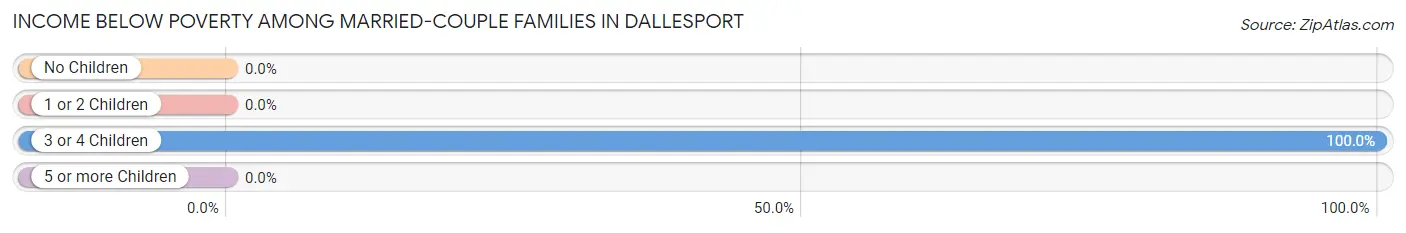
| Children | Above Poverty | Below Poverty |
| No Children | 158 (100.0%) | 0 (0.0%) |
| 1 or 2 Children | 15 (100.0%) | 0 (0.0%) |
| 3 or 4 Children | 0 (0.0%) | 16 (100.0%) |
| 5 or more Children | 29 (100.0%) | 0 (0.0%) |
| Total | 202 (92.7%) | 16 (7.3%) |
Income Below Poverty Among Single-Parent Households in Dallesport
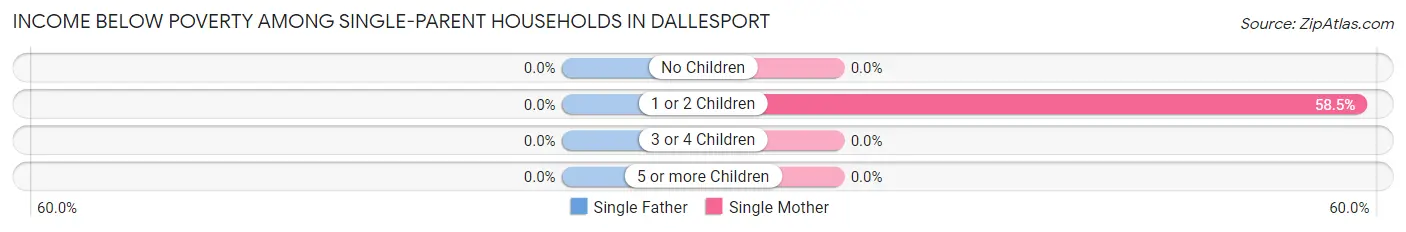
| Children | Single Father | Single Mother |
| No Children | 0 (0.0%) | 0 (0.0%) |
| 1 or 2 Children | 0 (0.0%) | 31 (58.5%) |
| 3 or 4 Children | 0 (0.0%) | 0 (0.0%) |
| 5 or more Children | 0 (0.0%) | 0 (0.0%) |
| Total | 0 (0.0%) | 31 (43.1%) |
Income Below Poverty Among Married-Couple vs Single-Parent Households in Dallesport
The poverty data for Dallesport shows that 16 of the married-couple family households (7.3%) and 31 of the single-parent households (35.2%) are living below the poverty level. Within the married-couple family households, those with 3 or 4 children have the highest poverty rate, with 16 households (100.0%) falling below the poverty line. Among the single-parent households, those with 1 or 2 children have the highest poverty rate, with 31 household (44.9%) living below poverty.
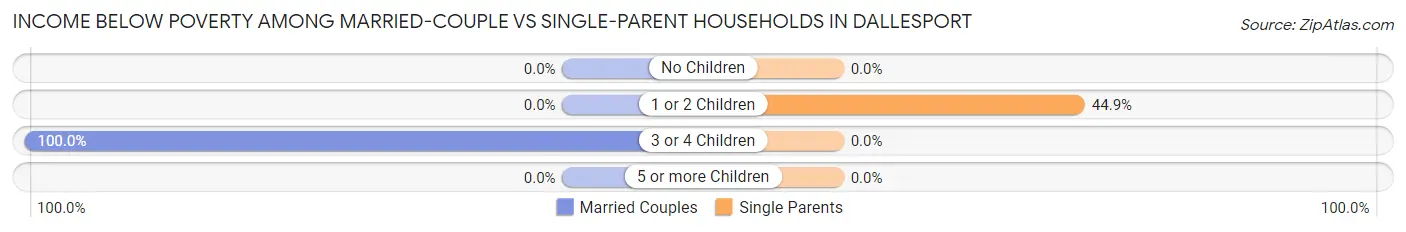
| Children | Married-Couple Families | Single-Parent Households |
| No Children | 0 (0.0%) | 0 (0.0%) |
| 1 or 2 Children | 0 (0.0%) | 31 (44.9%) |
| 3 or 4 Children | 16 (100.0%) | 0 (0.0%) |
| 5 or more Children | 0 (0.0%) | 0 (0.0%) |
| Total | 16 (7.3%) | 31 (35.2%) |
Race in Dallesport
The most populous races in Dallesport are White / Caucasian (1,131 | 79.3%), Two or more Races (258 | 18.1%), and Hispanic or Latino (183 | 12.8%).
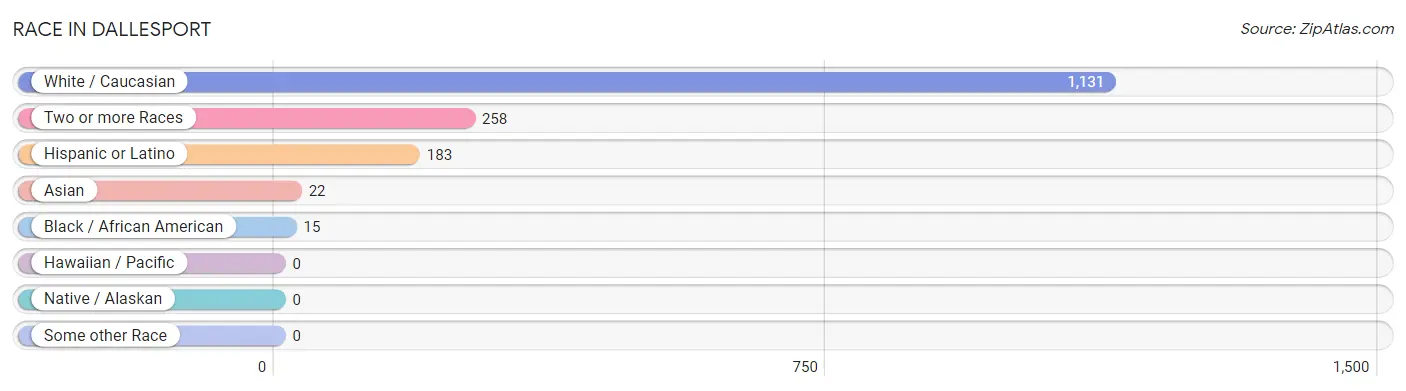
| Race | # Population | % Population |
| Asian | 22 | 1.5% |
| Black / African American | 15 | 1.1% |
| Hawaiian / Pacific | 0 | 0.0% |
| Hispanic or Latino | 183 | 12.8% |
| Native / Alaskan | 0 | 0.0% |
| White / Caucasian | 1,131 | 79.3% |
| Two or more Races | 258 | 18.1% |
| Some other Race | 0 | 0.0% |
| Total | 1,426 | 100.0% |
Ancestry in Dallesport
The most populous ancestries reported in Dallesport are German (337 | 23.6%), Irish (185 | 13.0%), Mexican (179 | 12.6%), American (165 | 11.6%), and Norwegian (152 | 10.7%), together accounting for 71.4% of all Dallesport residents.
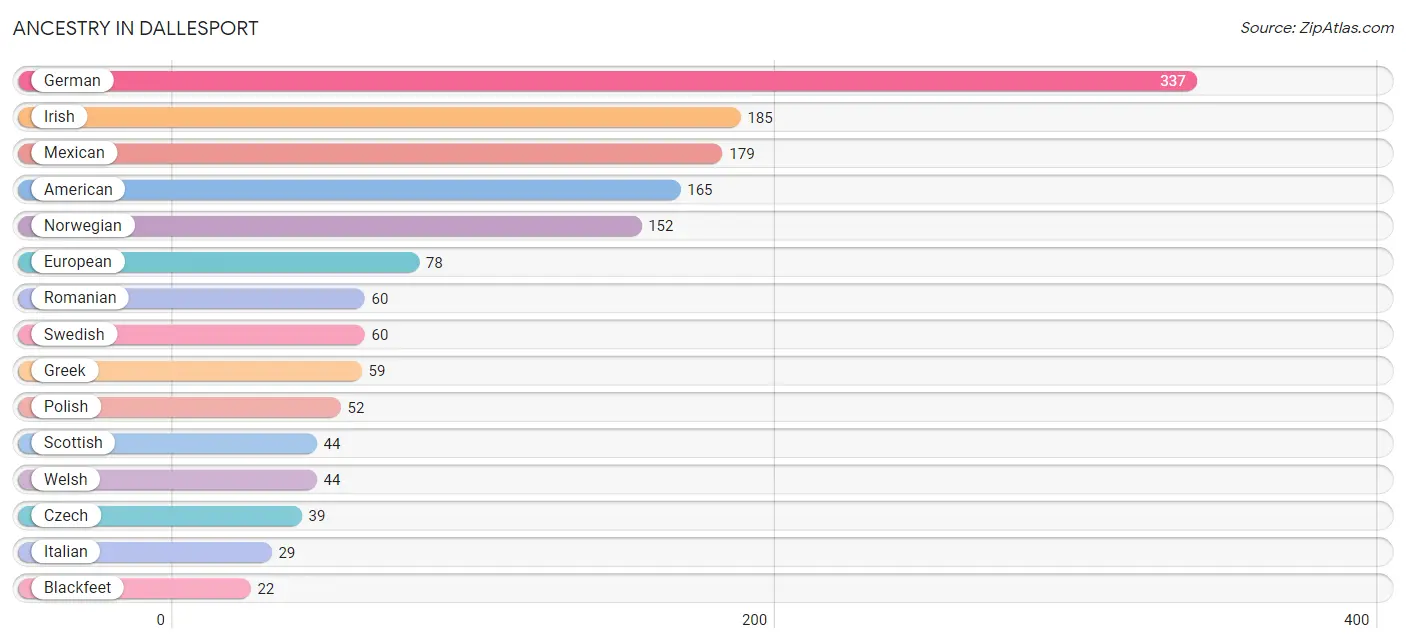
| Ancestry | # Population | % Population |
| American | 165 | 11.6% |
| Blackfeet | 22 | 1.5% |
| Czech | 39 | 2.7% |
| English | 21 | 1.5% |
| European | 78 | 5.5% |
| Finnish | 22 | 1.5% |
| German | 337 | 23.6% |
| Greek | 59 | 4.1% |
| Irish | 185 | 13.0% |
| Italian | 29 | 2.0% |
| Mexican | 179 | 12.6% |
| Norwegian | 152 | 10.7% |
| Polish | 52 | 3.6% |
| Puerto Rican | 4 | 0.3% |
| Romanian | 60 | 4.2% |
| Scotch-Irish | 6 | 0.4% |
| Scottish | 44 | 3.1% |
| Swedish | 60 | 4.2% |
| Thai | 22 | 1.5% |
| Welsh | 44 | 3.1% | View All 20 Rows |
Immigrants in Dallesport
The most numerous immigrant groups reported in Dallesport came from Europe (99 | 6.9%), Germany (60 | 4.2%), Western Europe (60 | 4.2%), Central America (48 | 3.4%), and Latin America (48 | 3.4%), together accounting for 22.1% of all Dallesport residents.
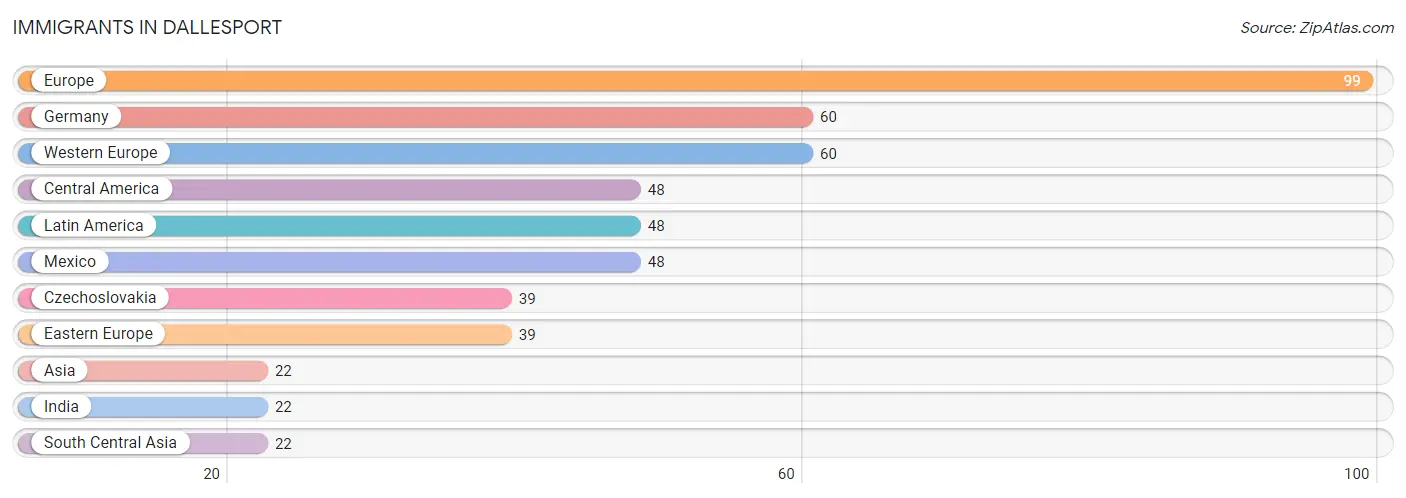
| Immigration Origin | # Population | % Population |
| Asia | 22 | 1.5% |
| Central America | 48 | 3.4% |
| Czechoslovakia | 39 | 2.7% |
| Eastern Europe | 39 | 2.7% |
| Europe | 99 | 6.9% |
| Germany | 60 | 4.2% |
| India | 22 | 1.5% |
| Latin America | 48 | 3.4% |
| Mexico | 48 | 3.4% |
| South Central Asia | 22 | 1.5% |
| Western Europe | 60 | 4.2% | View All 11 Rows |
Sex and Age in Dallesport
Sex and Age in Dallesport
The most populous age groups in Dallesport are 55 to 59 Years (98 | 14.8%) for men and 40 to 44 Years (92 | 12.0%) for women.
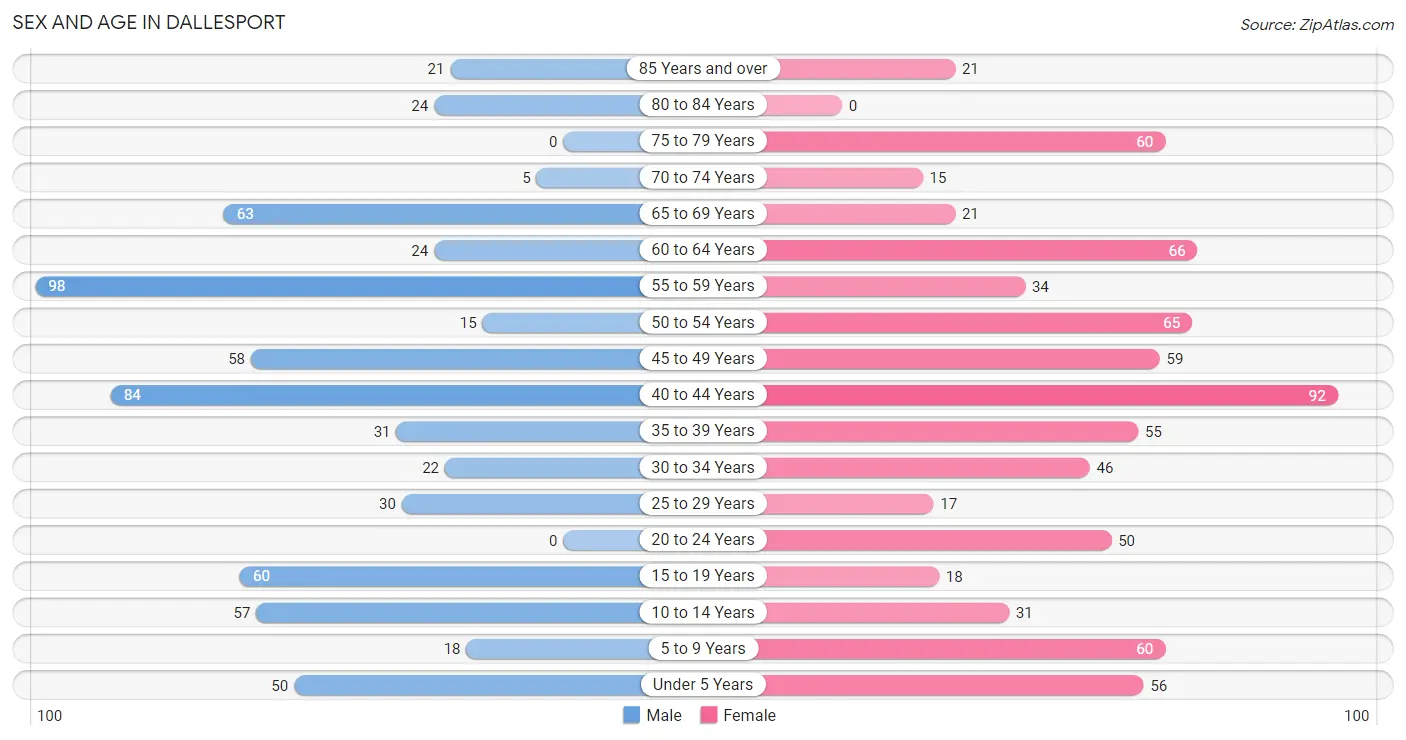
| Age Bracket | Male | Female |
| Under 5 Years | 50 (7.6%) | 56 (7.3%) |
| 5 to 9 Years | 18 (2.7%) | 60 (7.8%) |
| 10 to 14 Years | 57 (8.6%) | 31 (4.1%) |
| 15 to 19 Years | 60 (9.1%) | 18 (2.4%) |
| 20 to 24 Years | 0 (0.0%) | 50 (6.5%) |
| 25 to 29 Years | 30 (4.5%) | 17 (2.2%) |
| 30 to 34 Years | 22 (3.3%) | 46 (6.0%) |
| 35 to 39 Years | 31 (4.7%) | 55 (7.2%) |
| 40 to 44 Years | 84 (12.7%) | 92 (12.0%) |
| 45 to 49 Years | 58 (8.8%) | 59 (7.7%) |
| 50 to 54 Years | 15 (2.3%) | 65 (8.5%) |
| 55 to 59 Years | 98 (14.8%) | 34 (4.4%) |
| 60 to 64 Years | 24 (3.6%) | 66 (8.6%) |
| 65 to 69 Years | 63 (9.6%) | 21 (2.7%) |
| 70 to 74 Years | 5 (0.8%) | 15 (2.0%) |
| 75 to 79 Years | 0 (0.0%) | 60 (7.8%) |
| 80 to 84 Years | 24 (3.6%) | 0 (0.0%) |
| 85 Years and over | 21 (3.2%) | 21 (2.7%) |
| Total | 660 (100.0%) | 766 (100.0%) |
Families and Households in Dallesport
Median Family Size in Dallesport
The median family size in Dallesport is 3.13 persons per family, with single male/father families (16 | 5.2%) accounting for the largest median family size of 3.88 persons per family. On the other hand, single female/mother families (72 | 23.5%) represent the smallest median family size with 2.93 persons per family.
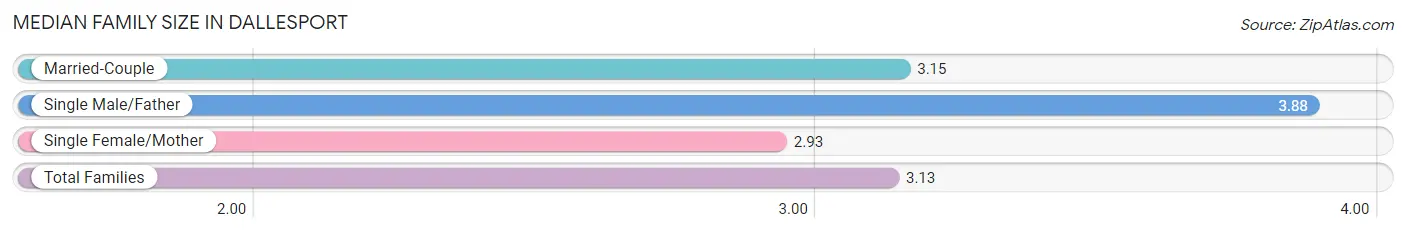
| Family Type | # Families | Family Size |
| Married-Couple | 218 (71.2%) | 3.15 |
| Single Male/Father | 16 (5.2%) | 3.88 |
| Single Female/Mother | 72 (23.5%) | 2.93 |
| Total Families | 306 (100.0%) | 3.13 |
Median Household Size in Dallesport
The median household size in Dallesport is 2.42 persons per household, with single male/father households (16 | 2.7%) accounting for the largest median household size of 3.88 persons per household. non-family households (283 | 48.0%) represent the smallest median household size with 1.65 persons per household.
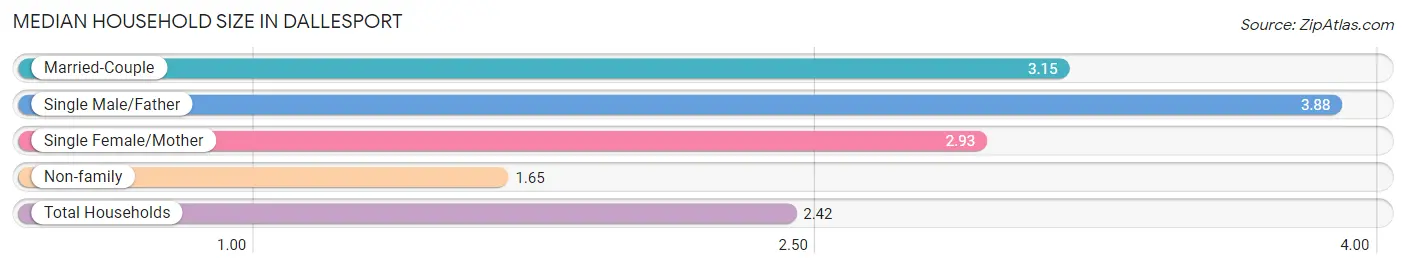
| Household Type | # Households | Household Size |
| Married-Couple | 218 (37.0%) | 3.15 |
| Single Male/Father | 16 (2.7%) | 3.88 |
| Single Female/Mother | 72 (12.2%) | 2.93 |
| Non-family | 283 (48.0%) | 1.65 |
| Total Households | 589 (100.0%) | 2.42 |
Household Size by Marriage Status in Dallesport
Out of a total of 589 households in Dallesport, 306 (51.9%) are family households, while 283 (48.0%) are nonfamily households. The most numerous type of family households are 2-person households, comprising 199, and the most common type of nonfamily households are 1-person households, comprising 192.
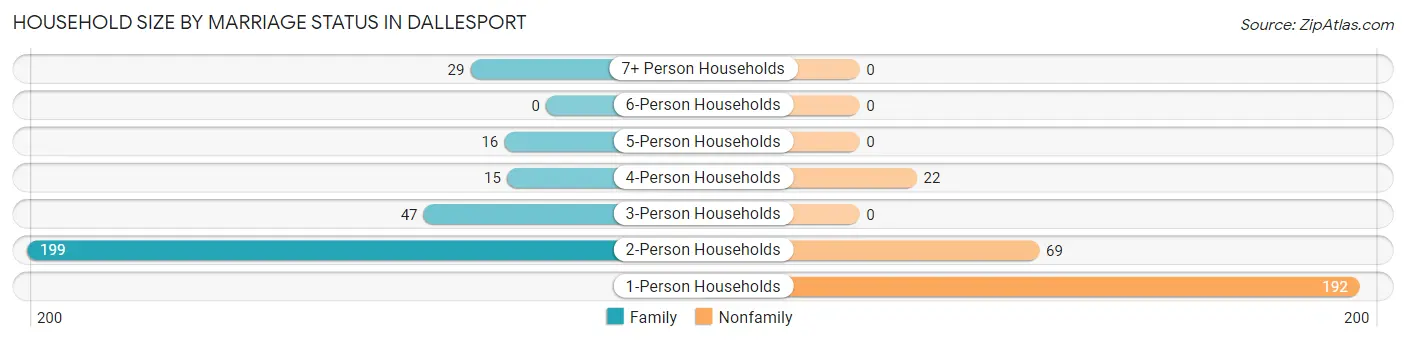
| Household Size | Family Households | Nonfamily Households |
| 1-Person Households | - | 192 (32.6%) |
| 2-Person Households | 199 (33.8%) | 69 (11.7%) |
| 3-Person Households | 47 (8.0%) | 0 (0.0%) |
| 4-Person Households | 15 (2.5%) | 22 (3.7%) |
| 5-Person Households | 16 (2.7%) | 0 (0.0%) |
| 6-Person Households | 0 (0.0%) | 0 (0.0%) |
| 7+ Person Households | 29 (4.9%) | 0 (0.0%) |
| Total | 306 (51.9%) | 283 (48.0%) |
Female Fertility in Dallesport
Fertility by Age in Dallesport
| Age Bracket | Women with Births | Births / 1,000 Women |
| 15 to 19 years | 0 (0.0%) | 0.0 |
| 20 to 34 years | 0 (0.0%) | 0.0 |
| 35 to 50 years | 0 (0.0%) | 0.0 |
| Total | 0 (0.0%) | 0.0 |
Fertility by Age by Marriage Status in Dallesport
| Age Bracket | Married | Unmarried |
| 15 to 19 years | 0 (0.0%) | 0 (0.0%) |
| 20 to 34 years | 0 (0.0%) | 0 (0.0%) |
| 35 to 50 years | 0 (0.0%) | 0 (0.0%) |
| Total | 0 (0.0%) | 0 (0.0%) |
Fertility by Education in Dallesport
| Educational Attainment | Women with Births | Births / 1,000 Women |
| Less than High School | 0 (0.0%) | 0.0 |
| High School Diploma | 0 (0.0%) | 0.0 |
| College or Associate's Degree | 0 (0.0%) | 0.0 |
| Bachelor's Degree | 0 (0.0%) | 0.0 |
| Graduate Degree | 0 (0.0%) | 0.0 |
| Total | 0 (0.0%) | 0.0 |
Fertility by Education by Marriage Status in Dallesport
| Educational Attainment | Married | Unmarried |
| Less than High School | 0 (0.0%) | 0 (0.0%) |
| High School Diploma | 0 (0.0%) | 0 (0.0%) |
| College or Associate's Degree | 0 (0.0%) | 0 (0.0%) |
| Bachelor's Degree | 0 (0.0%) | 0 (0.0%) |
| Graduate Degree | 0 (0.0%) | 0 (0.0%) |
| Total | 0 (0.0%) | 0 (0.0%) |
Employment Characteristics in Dallesport
Employment by Class of Employer in Dallesport
Among the 516 employed individuals in Dallesport, private company employees (216 | 41.9%), self-employed (incorporated) (144 | 27.9%), and local government employees (71 | 13.8%) make up the most common classes of employment.
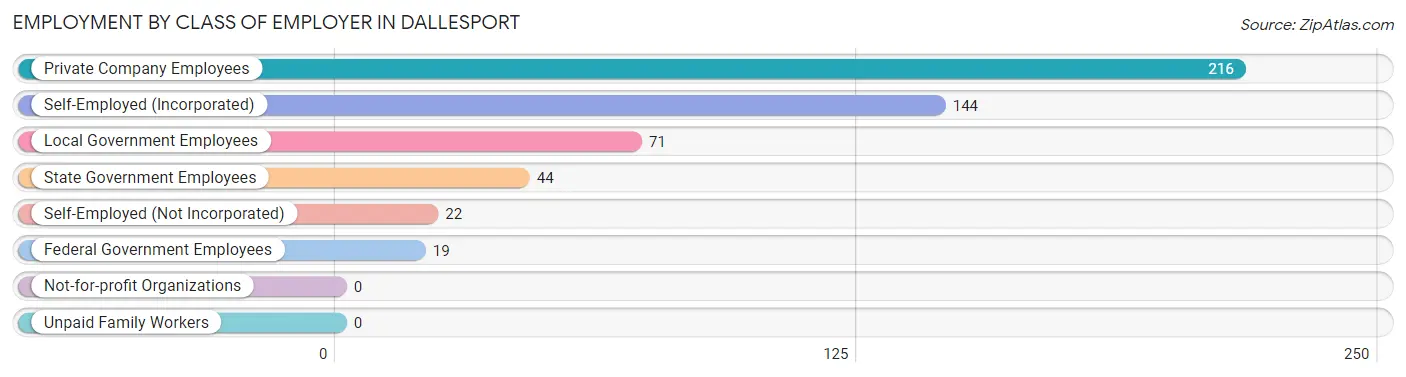
| Employer Class | # Employees | % Employees |
| Private Company Employees | 216 | 41.9% |
| Self-Employed (Incorporated) | 144 | 27.9% |
| Self-Employed (Not Incorporated) | 22 | 4.3% |
| Not-for-profit Organizations | 0 | 0.0% |
| Local Government Employees | 71 | 13.8% |
| State Government Employees | 44 | 8.5% |
| Federal Government Employees | 19 | 3.7% |
| Unpaid Family Workers | 0 | 0.0% |
| Total | 516 | 100.0% |
Employment Status by Age in Dallesport
According to the labor force statistics for Dallesport, out of the total population over 16 years of age (1,138), 54.3% or 618 individuals are in the labor force, with 14.1% or 87 of them unemployed. The age group with the highest labor force participation rate is 20 to 24 years, with 100.0% or 50 individuals in the labor force. Within the labor force, the 25 to 29 years age range has the highest percentage of unemployed individuals, with 63.8% or 30 of them being unemployed.
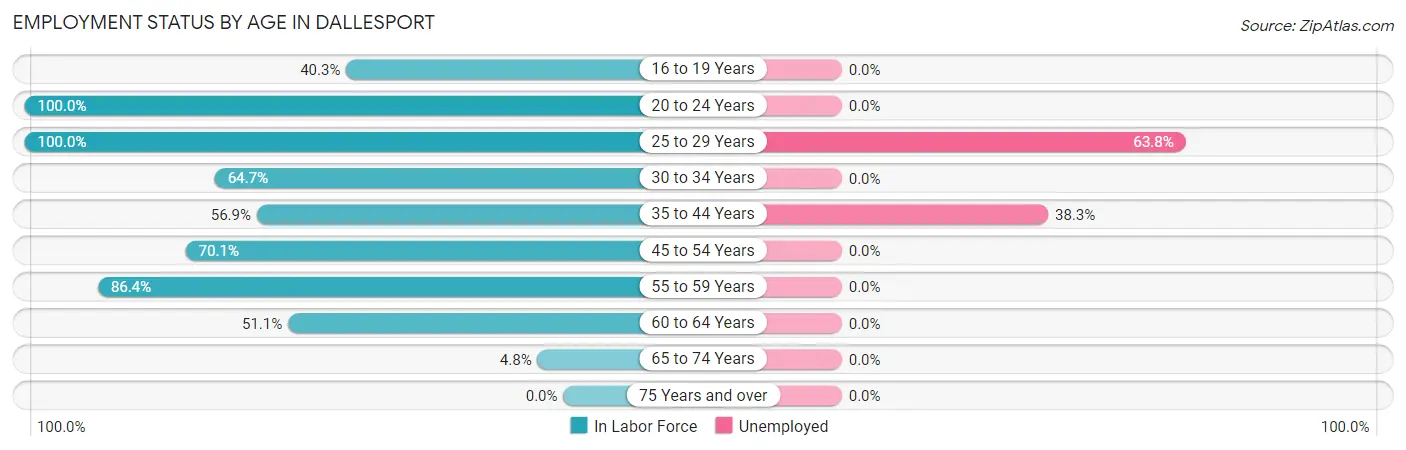
| Age Bracket | In Labor Force | Unemployed |
| 16 to 19 Years | 25 (40.3%) | 0 (0.0%) |
| 20 to 24 Years | 50 (100.0%) | 0 (0.0%) |
| 25 to 29 Years | 47 (100.0%) | 30 (63.8%) |
| 30 to 34 Years | 44 (64.7%) | 0 (0.0%) |
| 35 to 44 Years | 149 (56.9%) | 57 (38.3%) |
| 45 to 54 Years | 138 (70.1%) | 0 (0.0%) |
| 55 to 59 Years | 114 (86.4%) | 0 (0.0%) |
| 60 to 64 Years | 46 (51.1%) | 0 (0.0%) |
| 65 to 74 Years | 5 (4.8%) | 0 (0.0%) |
| 75 Years and over | 0 (0.0%) | 0 (0.0%) |
| Total | 618 (54.3%) | 87 (14.1%) |
Employment Status by Educational Attainment in Dallesport
According to labor force statistics for Dallesport, 67.6% of individuals (538) out of the total population between 25 and 64 years of age (796) are in the labor force, with 16.2% or 87 of them being unemployed. The group with the highest labor force participation rate are those with the educational attainment of bachelor's degree or higher, with 100.0% or 173 individuals in the labor force. Within the labor force, individuals with less than high school education have the highest percentage of unemployment, with 75.0% or 57 of them being unemployed.
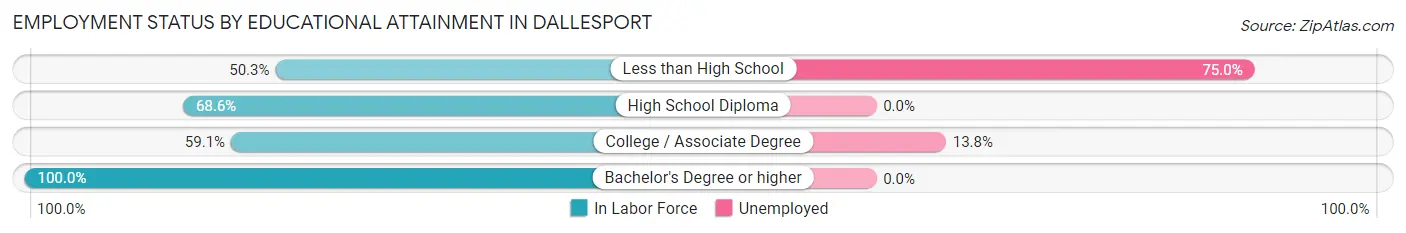
| Educational Attainment | In Labor Force | Unemployed |
| Less than High School | 76 (50.3%) | 113 (75.0%) |
| High School Diploma | 72 (68.6%) | 0 (0.0%) |
| College / Associate Degree | 217 (59.1%) | 51 (13.8%) |
| Bachelor's Degree or higher | 173 (100.0%) | 0 (0.0%) |
| Total | 538 (67.6%) | 129 (16.2%) |
Employment Occupations by Sex in Dallesport
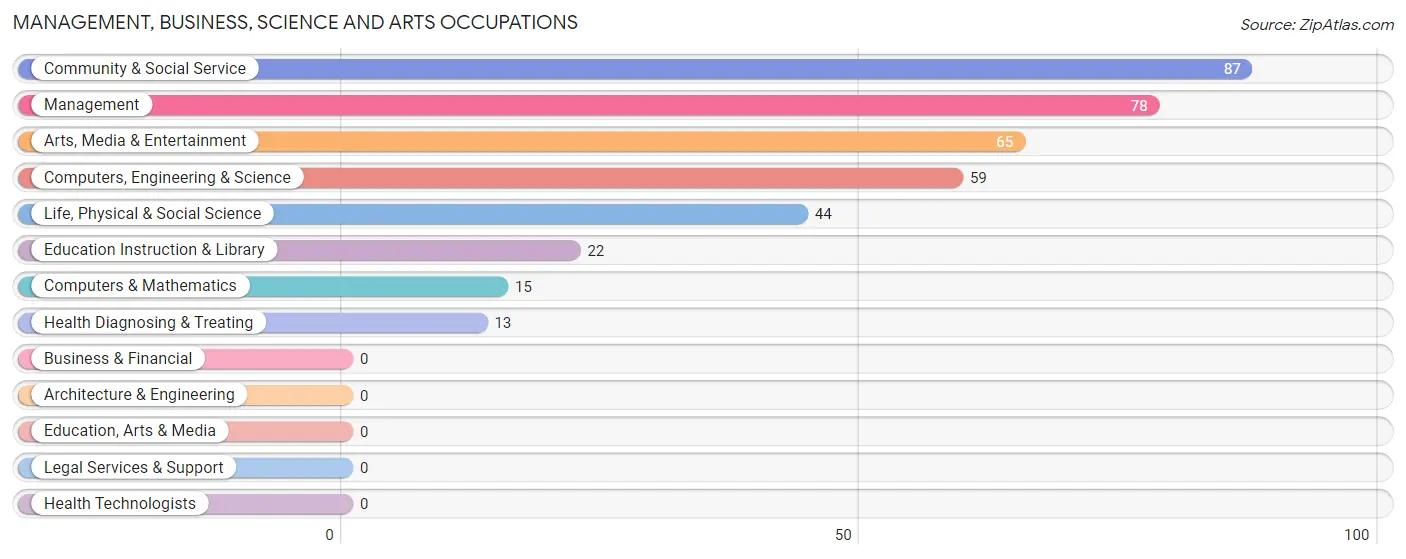
Management, Business, Science and Arts Occupations
The most common Management, Business, Science and Arts occupations in Dallesport are Community & Social Service (87 | 16.4%), Management (78 | 14.7%), Arts, Media & Entertainment (65 | 12.2%), Computers, Engineering & Science (59 | 11.1%), and Life, Physical & Social Science (44 | 8.3%).
Management, Business, Science and Arts Occupations by Sex
Within the Management, Business, Science and Arts occupations in Dallesport, the most male-oriented occupations are Life, Physical & Social Science (100.0%), Management (93.6%), and Computers, Engineering & Science (74.6%), while the most female-oriented occupations are Computers & Mathematics (100.0%), Community & Social Service (100.0%), and Education Instruction & Library (100.0%).
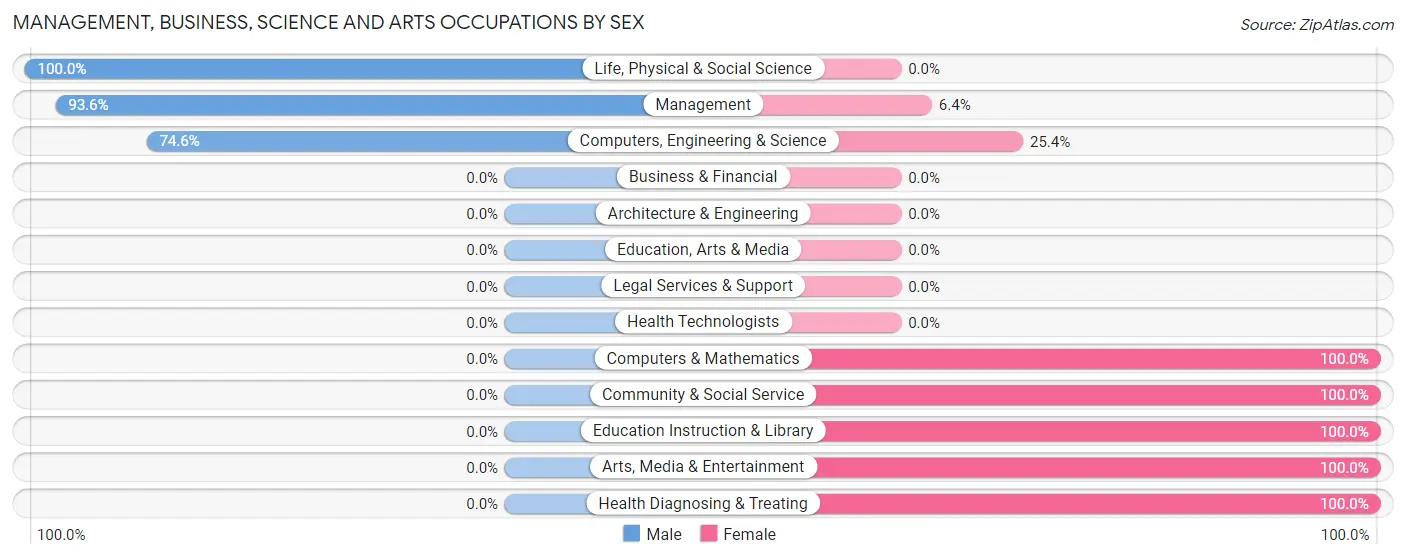
| Occupation | Male | Female |
| Management | 73 (93.6%) | 5 (6.4%) |
| Business & Financial | 0 (0.0%) | 0 (0.0%) |
| Computers, Engineering & Science | 44 (74.6%) | 15 (25.4%) |
| Computers & Mathematics | 0 (0.0%) | 15 (100.0%) |
| Architecture & Engineering | 0 (0.0%) | 0 (0.0%) |
| Life, Physical & Social Science | 44 (100.0%) | 0 (0.0%) |
| Community & Social Service | 0 (0.0%) | 87 (100.0%) |
| Education, Arts & Media | 0 (0.0%) | 0 (0.0%) |
| Legal Services & Support | 0 (0.0%) | 0 (0.0%) |
| Education Instruction & Library | 0 (0.0%) | 22 (100.0%) |
| Arts, Media & Entertainment | 0 (0.0%) | 65 (100.0%) |
| Health Diagnosing & Treating | 0 (0.0%) | 13 (100.0%) |
| Health Technologists | 0 (0.0%) | 0 (0.0%) |
| Total (Category) | 117 (49.4%) | 120 (50.6%) |
| Total (Overall) | 304 (57.3%) | 227 (42.7%) |
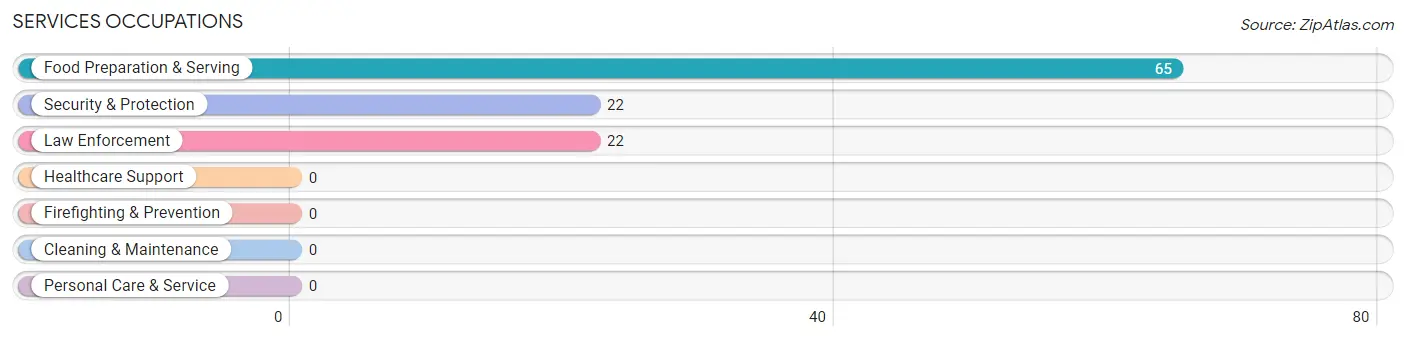
Services Occupations
The most common Services occupations in Dallesport are Food Preparation & Serving (65 | 12.2%), Security & Protection (22 | 4.1%), and Law Enforcement (22 | 4.1%).
Services Occupations by Sex
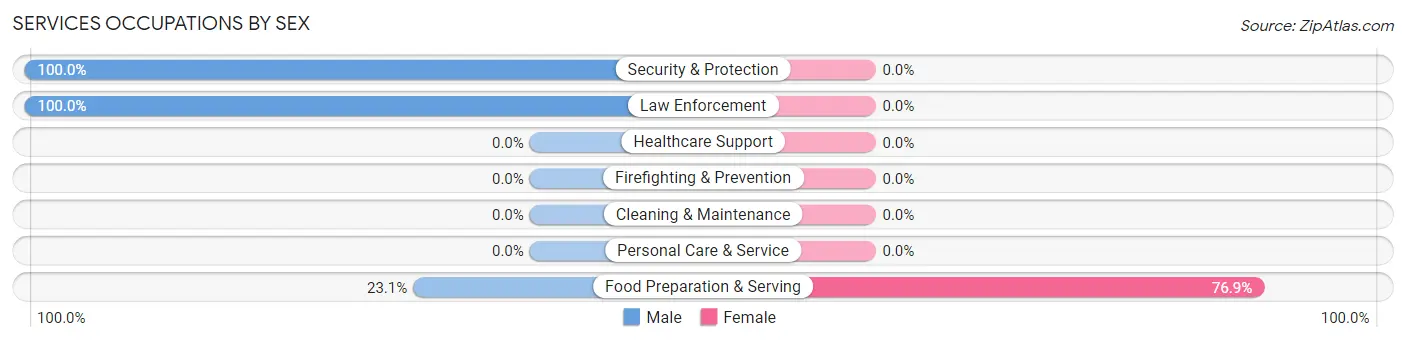
| Occupation | Male | Female |
| Healthcare Support | 0 (0.0%) | 0 (0.0%) |
| Security & Protection | 22 (100.0%) | 0 (0.0%) |
| Firefighting & Prevention | 0 (0.0%) | 0 (0.0%) |
| Law Enforcement | 22 (100.0%) | 0 (0.0%) |
| Food Preparation & Serving | 15 (23.1%) | 50 (76.9%) |
| Cleaning & Maintenance | 0 (0.0%) | 0 (0.0%) |
| Personal Care & Service | 0 (0.0%) | 0 (0.0%) |
| Total (Category) | 37 (42.5%) | 50 (57.5%) |
| Total (Overall) | 304 (57.3%) | 227 (42.7%) |
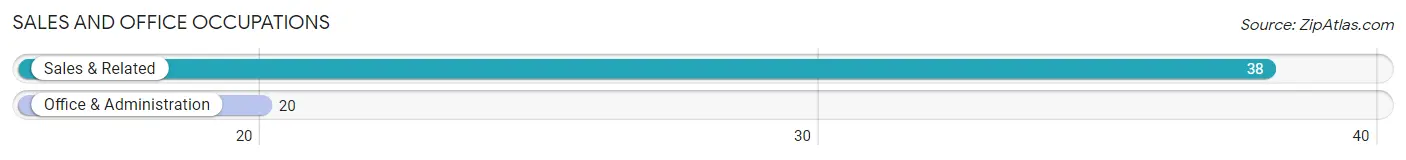
Sales and Office Occupations
The most common Sales and Office occupations in Dallesport are Sales & Related (38 | 7.2%), and Office & Administration (20 | 3.8%).
Sales and Office Occupations by Sex
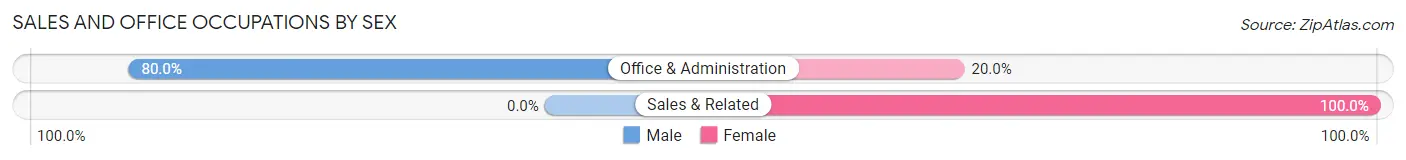
| Occupation | Male | Female |
| Sales & Related | 0 (0.0%) | 38 (100.0%) |
| Office & Administration | 16 (80.0%) | 4 (20.0%) |
| Total (Category) | 16 (27.6%) | 42 (72.4%) |
| Total (Overall) | 304 (57.3%) | 227 (42.7%) |
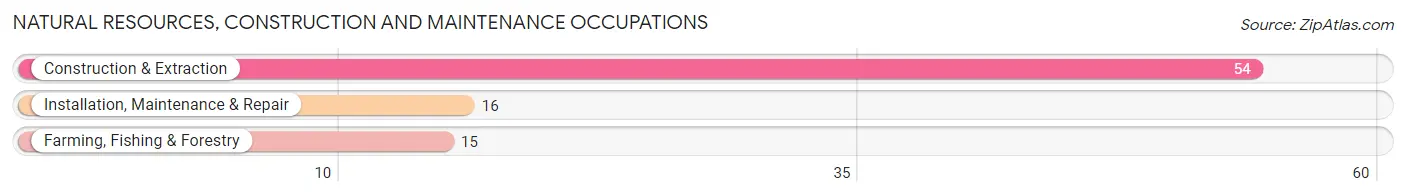
Natural Resources, Construction and Maintenance Occupations
The most common Natural Resources, Construction and Maintenance occupations in Dallesport are Construction & Extraction (54 | 10.2%), Installation, Maintenance & Repair (16 | 3.0%), and Farming, Fishing & Forestry (15 | 2.8%).
Natural Resources, Construction and Maintenance Occupations by Sex
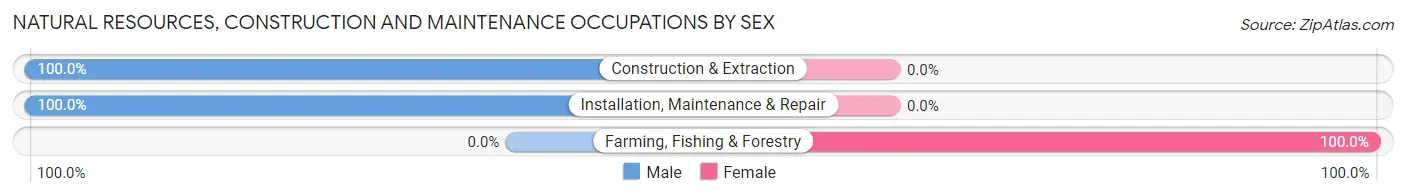
| Occupation | Male | Female |
| Farming, Fishing & Forestry | 0 (0.0%) | 15 (100.0%) |
| Construction & Extraction | 54 (100.0%) | 0 (0.0%) |
| Installation, Maintenance & Repair | 16 (100.0%) | 0 (0.0%) |
| Total (Category) | 70 (82.4%) | 15 (17.6%) |
| Total (Overall) | 304 (57.3%) | 227 (42.7%) |
Production, Transportation and Moving Occupations
The most common Production, Transportation and Moving occupations in Dallesport are Production (40 | 7.5%), and Transportation (24 | 4.5%).
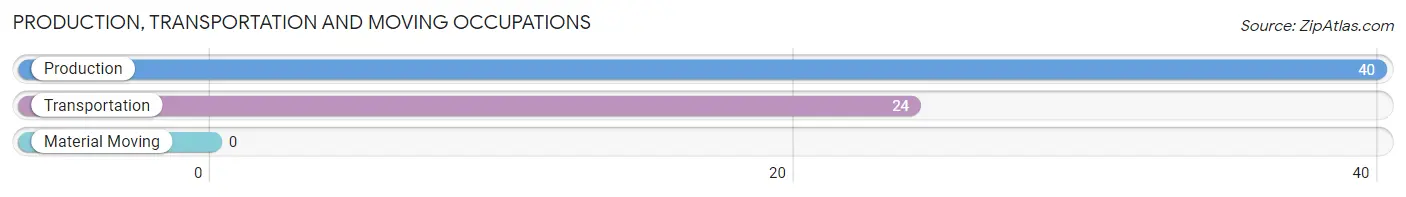
Production, Transportation and Moving Occupations by Sex
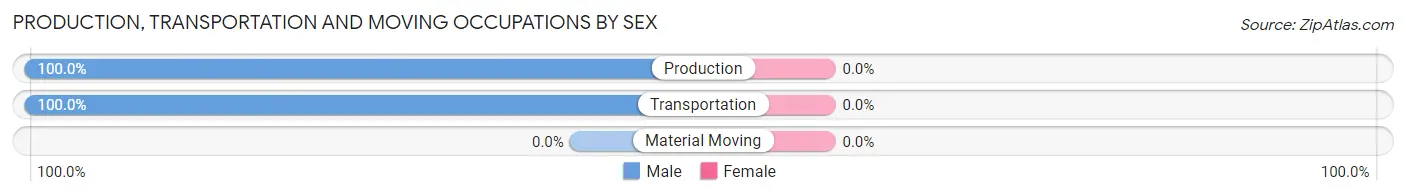
| Occupation | Male | Female |
| Production | 40 (100.0%) | 0 (0.0%) |
| Transportation | 24 (100.0%) | 0 (0.0%) |
| Material Moving | 0 (0.0%) | 0 (0.0%) |
| Total (Category) | 64 (100.0%) | 0 (0.0%) |
| Total (Overall) | 304 (57.3%) | 227 (42.7%) |
Employment Industries by Sex in Dallesport
Employment Industries in Dallesport
The major employment industries in Dallesport include Retail Trade (105 | 19.8%), Public Administration (70 | 13.2%), Agriculture, Fishing & Hunting (55 | 10.4%), Construction (54 | 10.2%), and Accommodation & Food Services (46 | 8.7%).
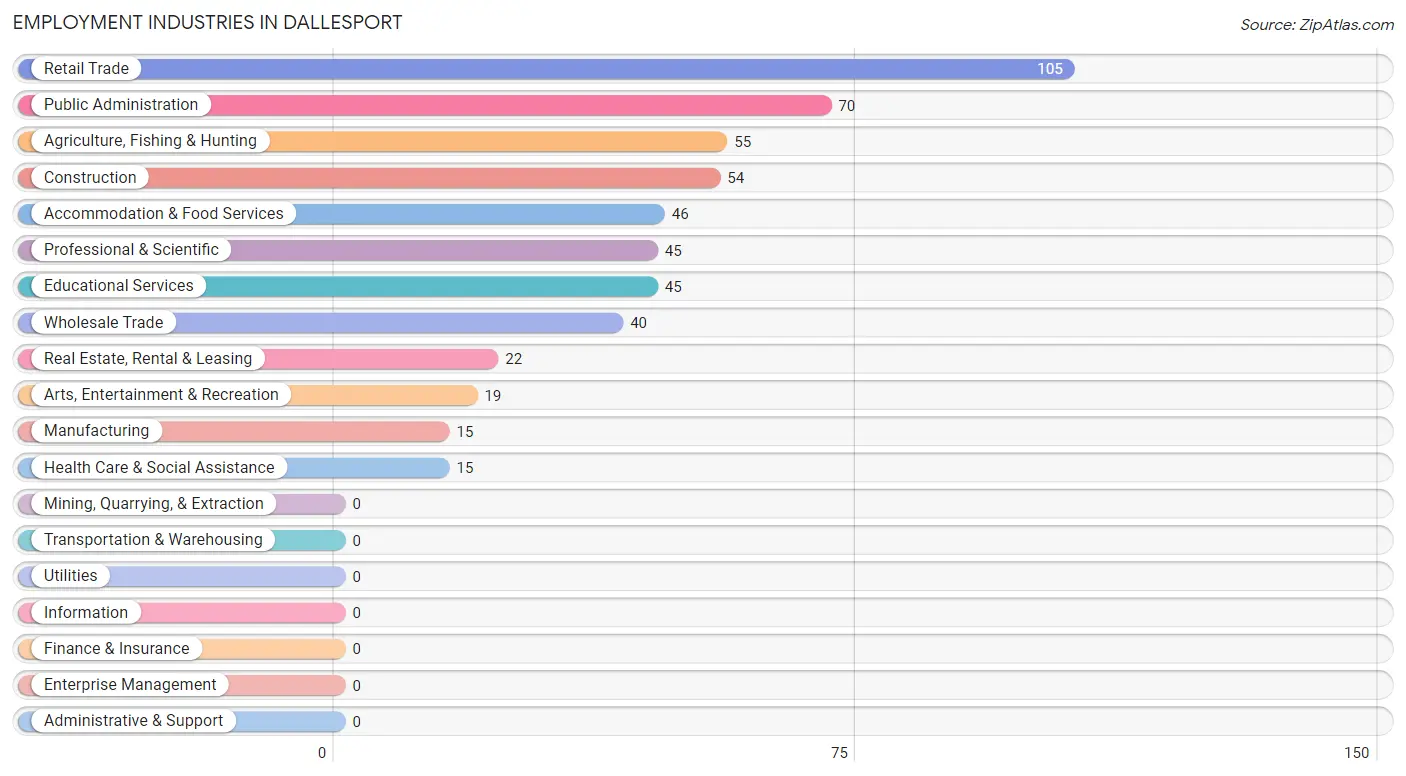
Employment Industries by Sex in Dallesport
The Dallesport industries that see more men than women are Construction (100.0%), Manufacturing (100.0%), and Public Administration (94.3%), whereas the industries that tend to have a higher number of women are Real Estate, Rental & Leasing (100.0%), Health Care & Social Assistance (100.0%), and Arts, Entertainment & Recreation (100.0%).
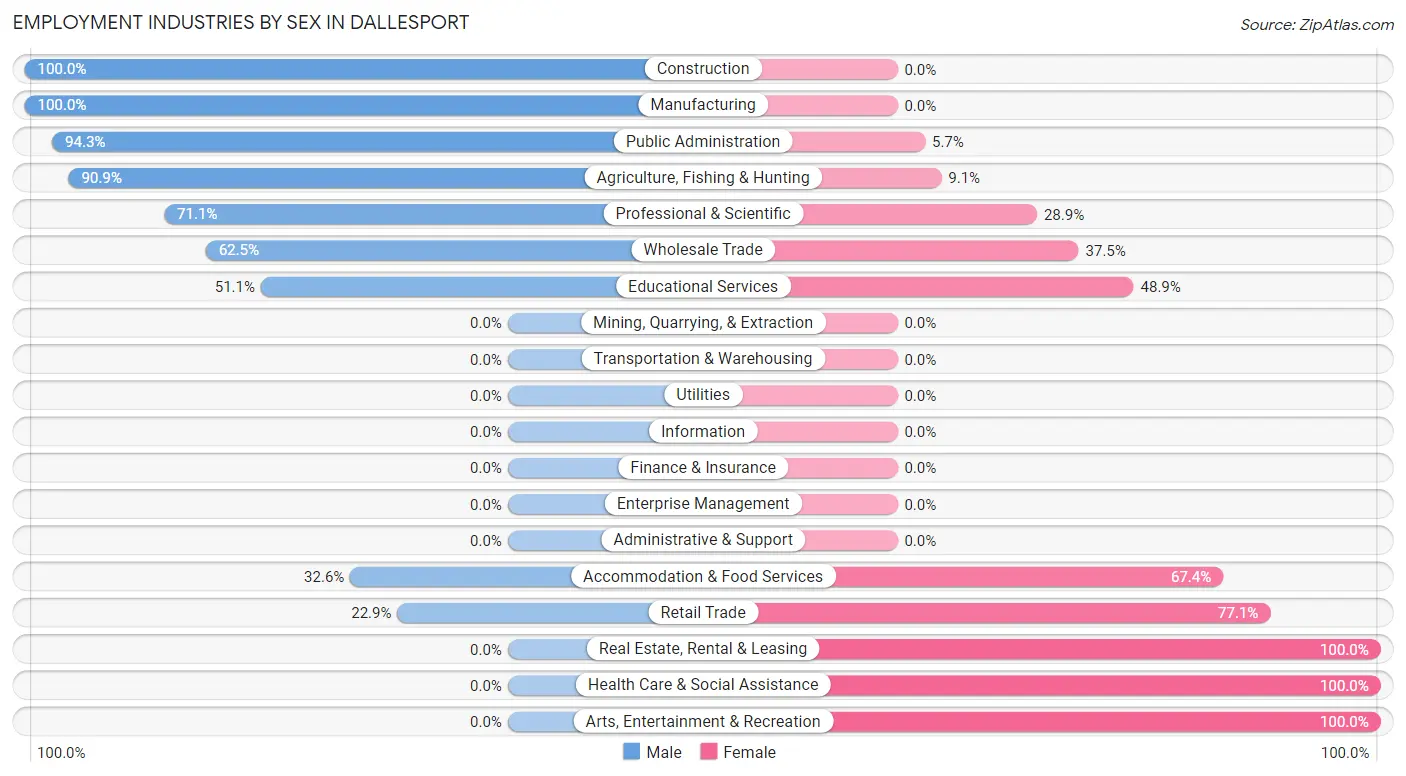
| Industry | Male | Female |
| Agriculture, Fishing & Hunting | 50 (90.9%) | 5 (9.1%) |
| Mining, Quarrying, & Extraction | 0 (0.0%) | 0 (0.0%) |
| Construction | 54 (100.0%) | 0 (0.0%) |
| Manufacturing | 15 (100.0%) | 0 (0.0%) |
| Wholesale Trade | 25 (62.5%) | 15 (37.5%) |
| Retail Trade | 24 (22.9%) | 81 (77.1%) |
| Transportation & Warehousing | 0 (0.0%) | 0 (0.0%) |
| Utilities | 0 (0.0%) | 0 (0.0%) |
| Information | 0 (0.0%) | 0 (0.0%) |
| Finance & Insurance | 0 (0.0%) | 0 (0.0%) |
| Real Estate, Rental & Leasing | 0 (0.0%) | 22 (100.0%) |
| Professional & Scientific | 32 (71.1%) | 13 (28.9%) |
| Enterprise Management | 0 (0.0%) | 0 (0.0%) |
| Administrative & Support | 0 (0.0%) | 0 (0.0%) |
| Educational Services | 23 (51.1%) | 22 (48.9%) |
| Health Care & Social Assistance | 0 (0.0%) | 15 (100.0%) |
| Arts, Entertainment & Recreation | 0 (0.0%) | 19 (100.0%) |
| Accommodation & Food Services | 15 (32.6%) | 31 (67.4%) |
| Public Administration | 66 (94.3%) | 4 (5.7%) |
| Total | 304 (57.3%) | 227 (42.7%) |
Education in Dallesport
School Enrollment in Dallesport
The most common levels of schooling among the 259 students in Dallesport are high school (99 | 38.2%), middle school (59 | 22.8%), and college / undergraduate (43 | 16.6%).
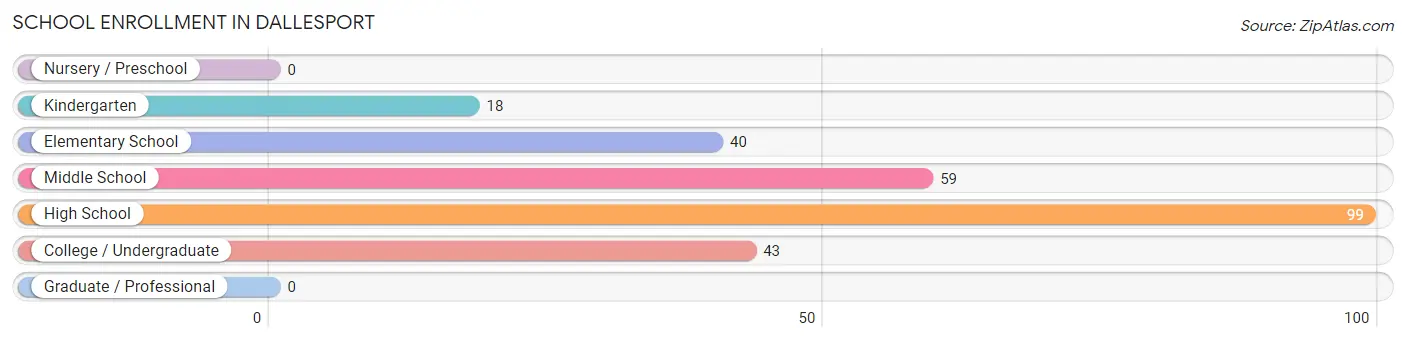
| School Level | # Students | % Students |
| Nursery / Preschool | 0 | 0.0% |
| Kindergarten | 18 | 7.0% |
| Elementary School | 40 | 15.4% |
| Middle School | 59 | 22.8% |
| High School | 99 | 38.2% |
| College / Undergraduate | 43 | 16.6% |
| Graduate / Professional | 0 | 0.0% |
| Total | 259 | 100.0% |
School Enrollment by Age by Funding Source in Dallesport
Out of a total of 259 students who are enrolled in schools in Dallesport, 83 (32.0%) attend a private institution, while the remaining 176 (68.0%) are enrolled in public schools. The age group of 18 to 19 year olds has the highest likelihood of being enrolled in private schools, with 25 (100.0% in the age bracket) enrolled. Conversely, the age group of 5 to 9 year old has the lowest likelihood of being enrolled in a private school, with 50 (100.0% in the age bracket) attending a public institution.
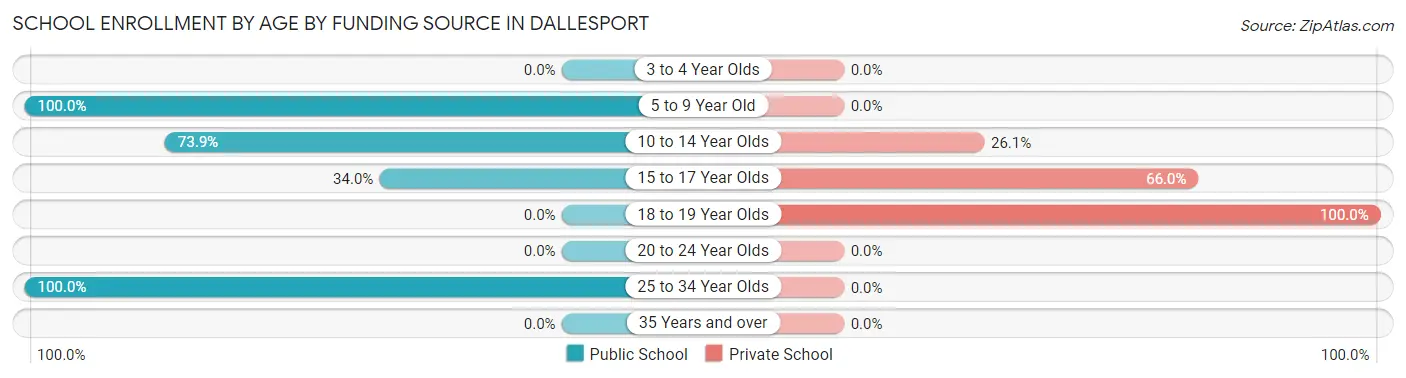
| Age Bracket | Public School | Private School |
| 3 to 4 Year Olds | 0 (0.0%) | 0 (0.0%) |
| 5 to 9 Year Old | 50 (100.0%) | 0 (0.0%) |
| 10 to 14 Year Olds | 65 (73.9%) | 23 (26.1%) |
| 15 to 17 Year Olds | 18 (34.0%) | 35 (66.0%) |
| 18 to 19 Year Olds | 0 (0.0%) | 25 (100.0%) |
| 20 to 24 Year Olds | 0 (0.0%) | 0 (0.0%) |
| 25 to 34 Year Olds | 43 (100.0%) | 0 (0.0%) |
| 35 Years and over | 0 (0.0%) | 0 (0.0%) |
| Total | 176 (68.0%) | 83 (32.0%) |
Educational Attainment by Field of Study in Dallesport
Science & technology (88 | 38.6%), education (70 | 30.7%), business (54 | 23.7%), liberal arts & history (15 | 6.6%), and computers & mathematics (1 | 0.4%) are the most common fields of study among 228 individuals in Dallesport who have obtained a bachelor's degree or higher.
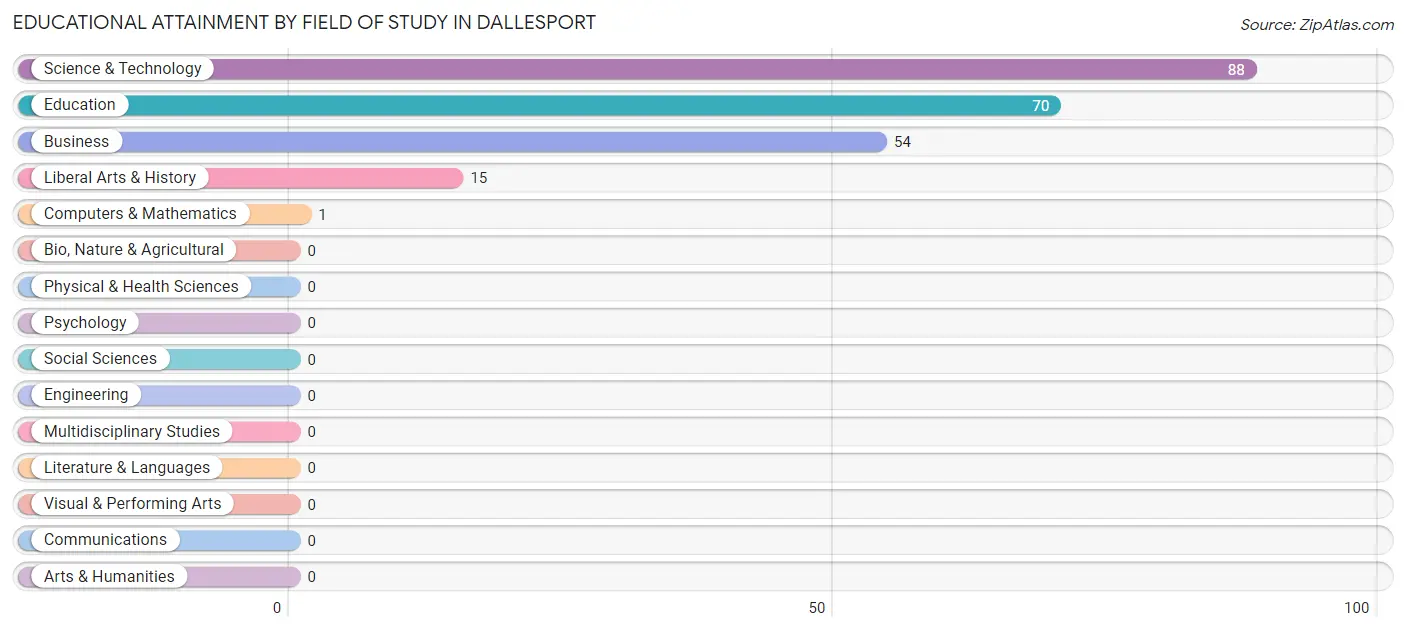
| Field of Study | # Graduates | % Graduates |
| Computers & Mathematics | 1 | 0.4% |
| Bio, Nature & Agricultural | 0 | 0.0% |
| Physical & Health Sciences | 0 | 0.0% |
| Psychology | 0 | 0.0% |
| Social Sciences | 0 | 0.0% |
| Engineering | 0 | 0.0% |
| Multidisciplinary Studies | 0 | 0.0% |
| Science & Technology | 88 | 38.6% |
| Business | 54 | 23.7% |
| Education | 70 | 30.7% |
| Literature & Languages | 0 | 0.0% |
| Liberal Arts & History | 15 | 6.6% |
| Visual & Performing Arts | 0 | 0.0% |
| Communications | 0 | 0.0% |
| Arts & Humanities | 0 | 0.0% |
| Total | 228 | 100.0% |
Transportation & Commute in Dallesport
Vehicle Availability by Sex in Dallesport
The most prevalent vehicle ownership categories in Dallesport are males with 2 vehicles (108, accounting for 35.5%) and females with 2 vehicles (137, making up 50.9%).
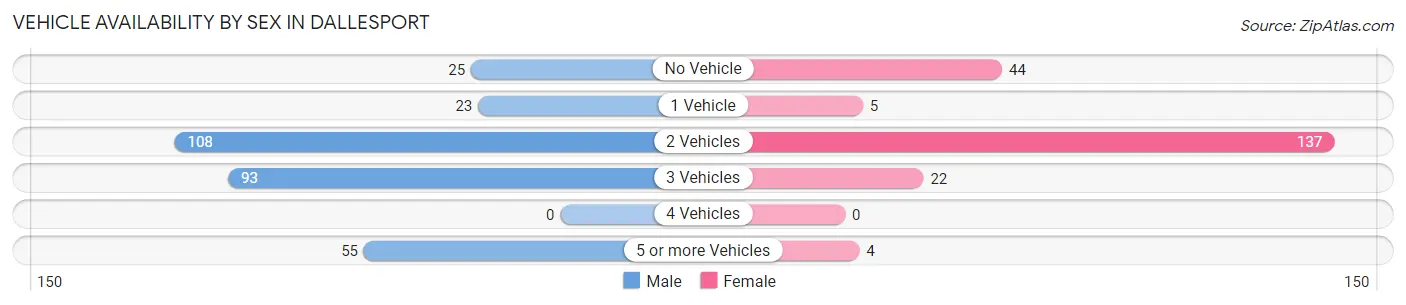
| Vehicles Available | Male | Female |
| No Vehicle | 25 (8.2%) | 44 (20.7%) |
| 1 Vehicle | 23 (7.6%) | 5 (2.4%) |
| 2 Vehicles | 108 (35.5%) | 137 (64.6%) |
| 3 Vehicles | 93 (30.6%) | 22 (10.4%) |
| 4 Vehicles | 0 (0.0%) | 0 (0.0%) |
| 5 or more Vehicles | 55 (18.1%) | 4 (1.9%) |
| Total | 304 (100.0%) | 212 (100.0%) |
Commute Time in Dallesport
The most frequently occuring commute durations in Dallesport are 15 to 19 minutes (119 commuters, 25.5%), less than 5 minutes (105 commuters, 22.5%), and 45 to 59 minutes (104 commuters, 22.3%).
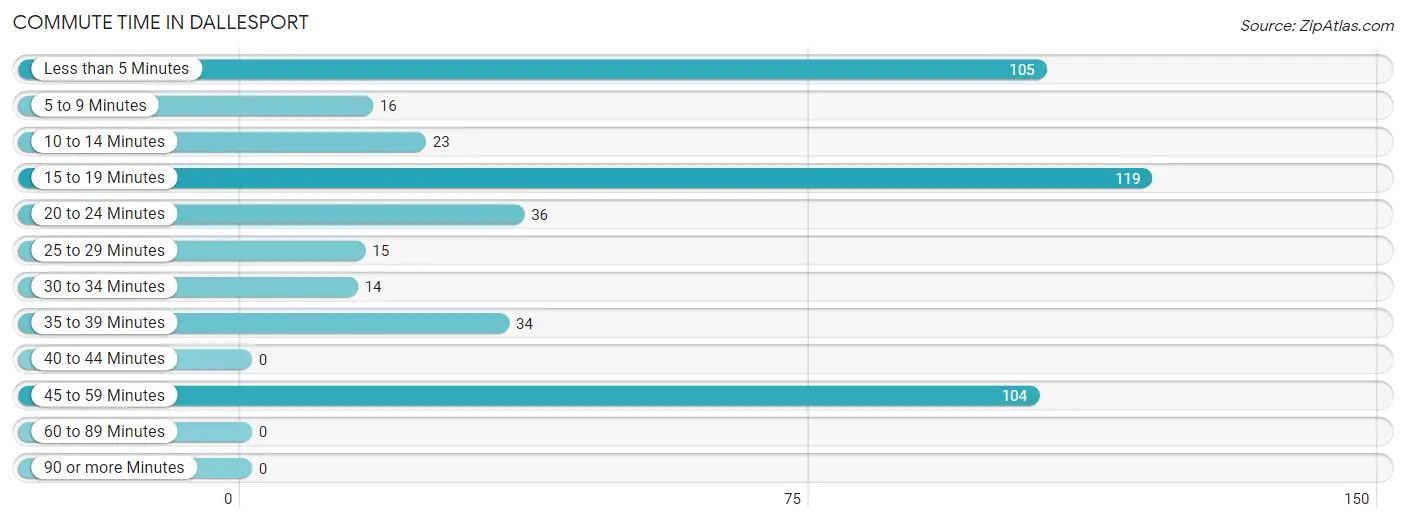
| Commute Time | # Commuters | % Commuters |
| Less than 5 Minutes | 105 | 22.5% |
| 5 to 9 Minutes | 16 | 3.4% |
| 10 to 14 Minutes | 23 | 4.9% |
| 15 to 19 Minutes | 119 | 25.5% |
| 20 to 24 Minutes | 36 | 7.7% |
| 25 to 29 Minutes | 15 | 3.2% |
| 30 to 34 Minutes | 14 | 3.0% |
| 35 to 39 Minutes | 34 | 7.3% |
| 40 to 44 Minutes | 0 | 0.0% |
| 45 to 59 Minutes | 104 | 22.3% |
| 60 to 89 Minutes | 0 | 0.0% |
| 90 or more Minutes | 0 | 0.0% |
Commute Time by Sex in Dallesport
The most common commute times in Dallesport are 45 to 59 minutes (82 commuters, 32.3%) for males and 15 to 19 minutes (70 commuters, 33.0%) for females.
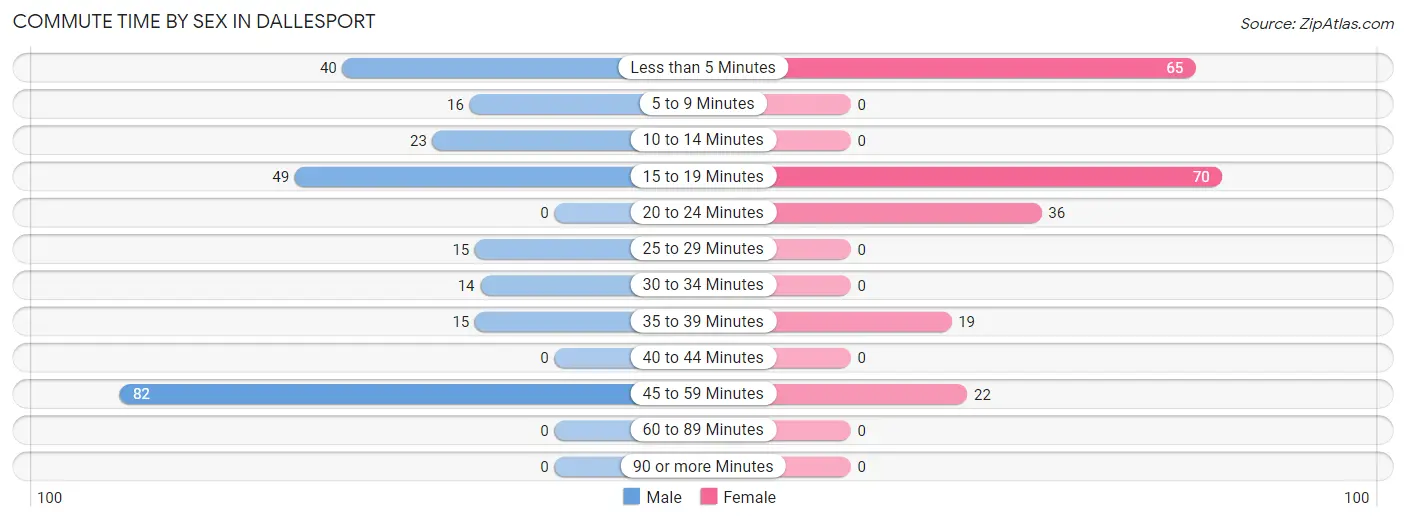
| Commute Time | Male | Female |
| Less than 5 Minutes | 40 (15.8%) | 65 (30.7%) |
| 5 to 9 Minutes | 16 (6.3%) | 0 (0.0%) |
| 10 to 14 Minutes | 23 (9.1%) | 0 (0.0%) |
| 15 to 19 Minutes | 49 (19.3%) | 70 (33.0%) |
| 20 to 24 Minutes | 0 (0.0%) | 36 (17.0%) |
| 25 to 29 Minutes | 15 (5.9%) | 0 (0.0%) |
| 30 to 34 Minutes | 14 (5.5%) | 0 (0.0%) |
| 35 to 39 Minutes | 15 (5.9%) | 19 (9.0%) |
| 40 to 44 Minutes | 0 (0.0%) | 0 (0.0%) |
| 45 to 59 Minutes | 82 (32.3%) | 22 (10.4%) |
| 60 to 89 Minutes | 0 (0.0%) | 0 (0.0%) |
| 90 or more Minutes | 0 (0.0%) | 0 (0.0%) |
Time of Departure to Work by Sex in Dallesport
The most frequent times of departure to work in Dallesport are 7:00 AM to 7:29 AM (81, 31.9%) for males and 6:00 AM to 6:29 AM (69, 32.6%) for females.
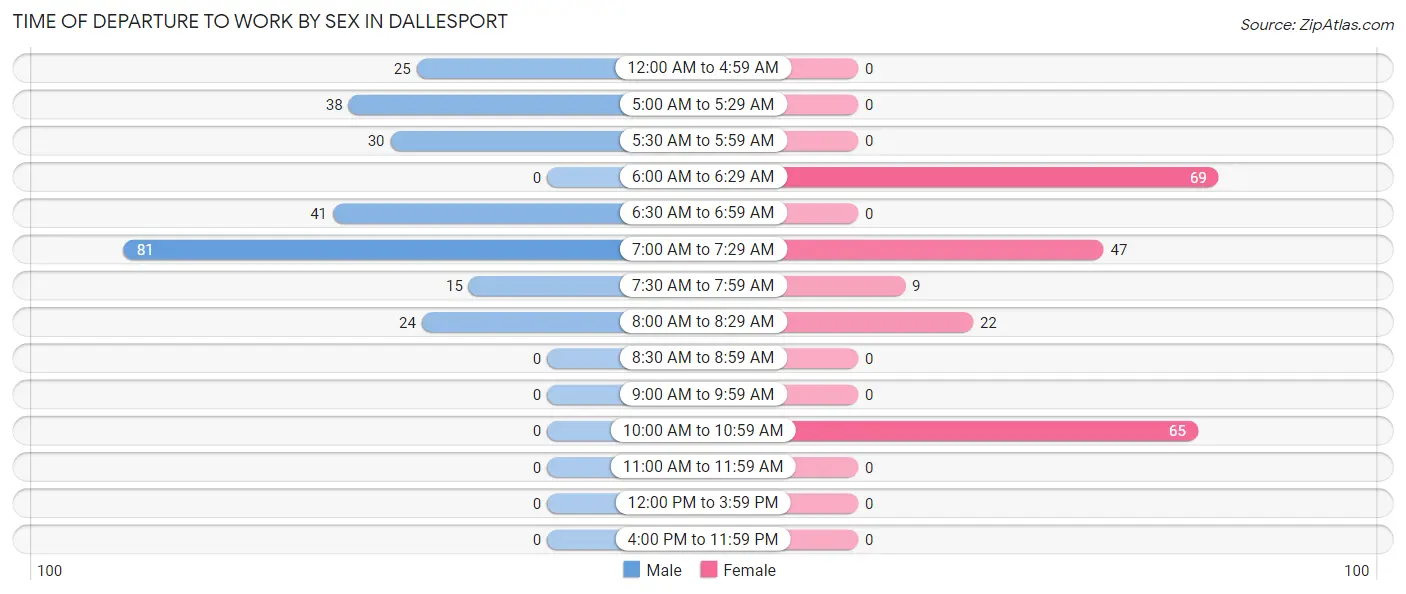
| Time of Departure | Male | Female |
| 12:00 AM to 4:59 AM | 25 (9.8%) | 0 (0.0%) |
| 5:00 AM to 5:29 AM | 38 (15.0%) | 0 (0.0%) |
| 5:30 AM to 5:59 AM | 30 (11.8%) | 0 (0.0%) |
| 6:00 AM to 6:29 AM | 0 (0.0%) | 69 (32.6%) |
| 6:30 AM to 6:59 AM | 41 (16.1%) | 0 (0.0%) |
| 7:00 AM to 7:29 AM | 81 (31.9%) | 47 (22.2%) |
| 7:30 AM to 7:59 AM | 15 (5.9%) | 9 (4.3%) |
| 8:00 AM to 8:29 AM | 24 (9.5%) | 22 (10.4%) |
| 8:30 AM to 8:59 AM | 0 (0.0%) | 0 (0.0%) |
| 9:00 AM to 9:59 AM | 0 (0.0%) | 0 (0.0%) |
| 10:00 AM to 10:59 AM | 0 (0.0%) | 65 (30.7%) |
| 11:00 AM to 11:59 AM | 0 (0.0%) | 0 (0.0%) |
| 12:00 PM to 3:59 PM | 0 (0.0%) | 0 (0.0%) |
| 4:00 PM to 11:59 PM | 0 (0.0%) | 0 (0.0%) |
| Total | 254 (100.0%) | 212 (100.0%) |
Housing Occupancy in Dallesport
Occupancy by Ownership in Dallesport
Of the total 589 dwellings in Dallesport, owner-occupied units account for 407 (69.1%), while renter-occupied units make up 182 (30.9%).
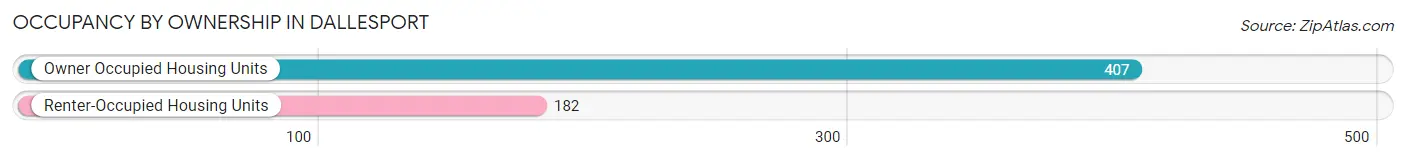
| Occupancy | # Housing Units | % Housing Units |
| Owner Occupied Housing Units | 407 | 69.1% |
| Renter-Occupied Housing Units | 182 | 30.9% |
| Total Occupied Housing Units | 589 | 100.0% |
Occupancy by Household Size in Dallesport
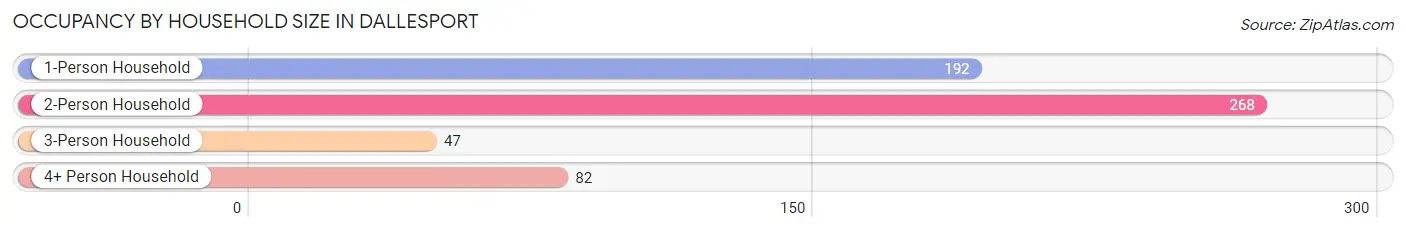
| Household Size | # Housing Units | % Housing Units |
| 1-Person Household | 192 | 32.6% |
| 2-Person Household | 268 | 45.5% |
| 3-Person Household | 47 | 8.0% |
| 4+ Person Household | 82 | 13.9% |
| Total Housing Units | 589 | 100.0% |
Occupancy by Ownership by Household Size in Dallesport
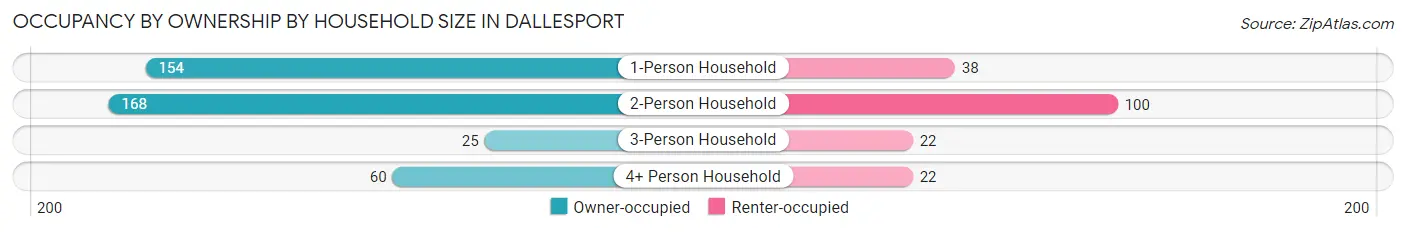
| Household Size | Owner-occupied | Renter-occupied |
| 1-Person Household | 154 (80.2%) | 38 (19.8%) |
| 2-Person Household | 168 (62.7%) | 100 (37.3%) |
| 3-Person Household | 25 (53.2%) | 22 (46.8%) |
| 4+ Person Household | 60 (73.2%) | 22 (26.8%) |
| Total Housing Units | 407 (69.1%) | 182 (30.9%) |
Occupancy by Educational Attainment in Dallesport
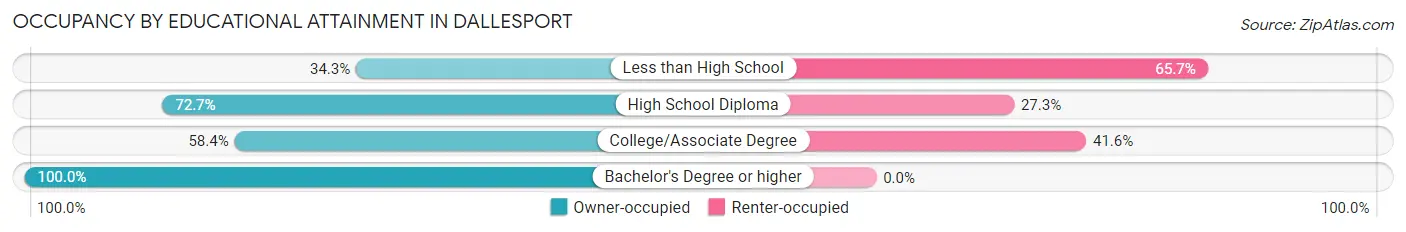
| Household Size | Owner-occupied | Renter-occupied |
| Less than High School | 36 (34.3%) | 69 (65.7%) |
| High School Diploma | 149 (72.7%) | 56 (27.3%) |
| College/Associate Degree | 80 (58.4%) | 57 (41.6%) |
| Bachelor's Degree or higher | 142 (100.0%) | 0 (0.0%) |
Occupancy by Age of Householder in Dallesport
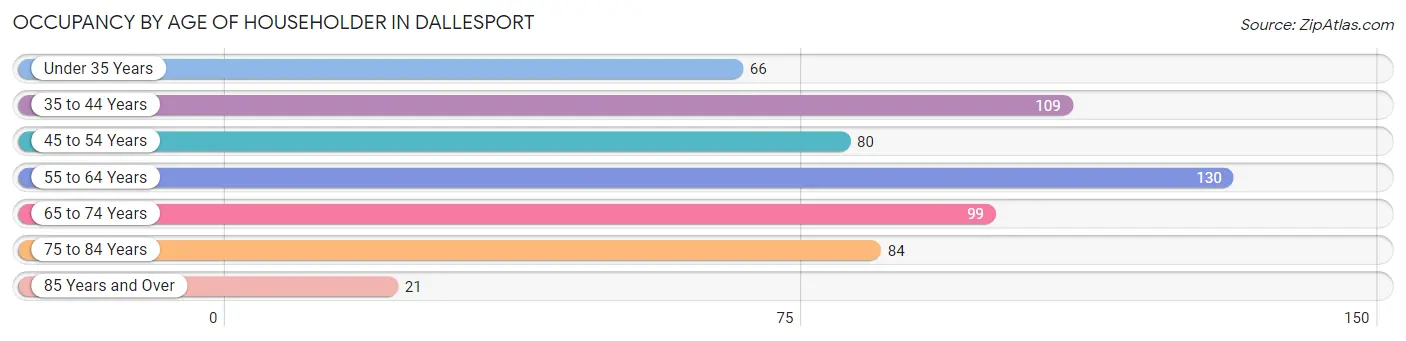
| Age Bracket | # Households | % Households |
| Under 35 Years | 66 | 11.2% |
| 35 to 44 Years | 109 | 18.5% |
| 45 to 54 Years | 80 | 13.6% |
| 55 to 64 Years | 130 | 22.1% |
| 65 to 74 Years | 99 | 16.8% |
| 75 to 84 Years | 84 | 14.3% |
| 85 Years and Over | 21 | 3.6% |
| Total | 589 | 100.0% |
Housing Finances in Dallesport
Median Income by Occupancy in Dallesport
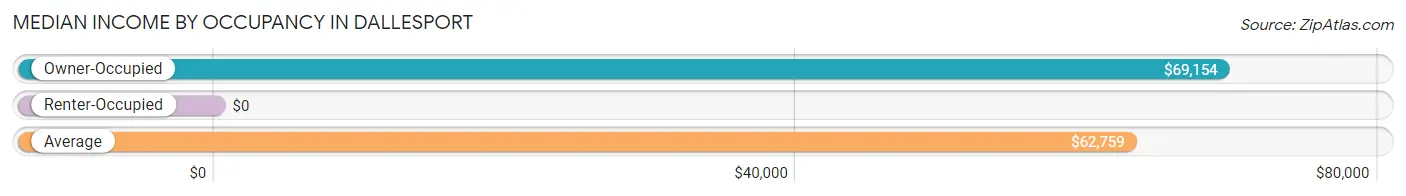
| Occupancy Type | # Households | Median Income |
| Owner-Occupied | 407 (69.1%) | $69,154 |
| Renter-Occupied | 182 (30.9%) | $0 |
| Average | 589 (100.0%) | $62,759 |
Occupancy by Householder Income Bracket in Dallesport
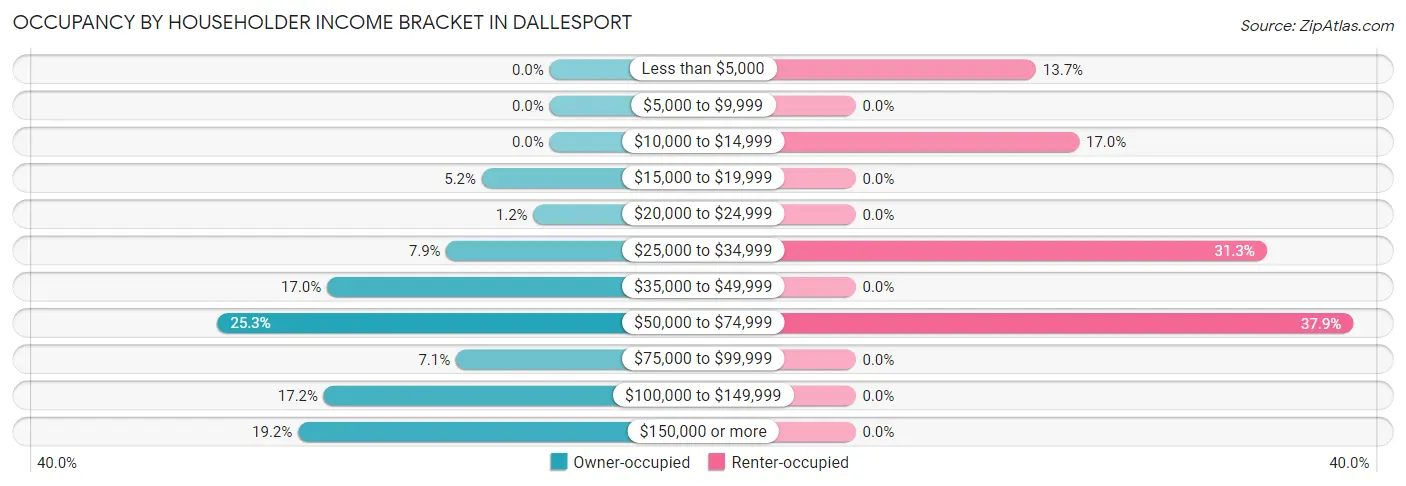
| Income Bracket | Owner-occupied | Renter-occupied |
| Less than $5,000 | 0 (0.0%) | 25 (13.7%) |
| $5,000 to $9,999 | 0 (0.0%) | 0 (0.0%) |
| $10,000 to $14,999 | 0 (0.0%) | 31 (17.0%) |
| $15,000 to $19,999 | 21 (5.2%) | 0 (0.0%) |
| $20,000 to $24,999 | 5 (1.2%) | 0 (0.0%) |
| $25,000 to $34,999 | 32 (7.9%) | 57 (31.3%) |
| $35,000 to $49,999 | 69 (17.0%) | 0 (0.0%) |
| $50,000 to $74,999 | 103 (25.3%) | 69 (37.9%) |
| $75,000 to $99,999 | 29 (7.1%) | 0 (0.0%) |
| $100,000 to $149,999 | 70 (17.2%) | 0 (0.0%) |
| $150,000 or more | 78 (19.2%) | 0 (0.0%) |
| Total | 407 (100.0%) | 182 (100.0%) |
Monthly Housing Cost Tiers in Dallesport
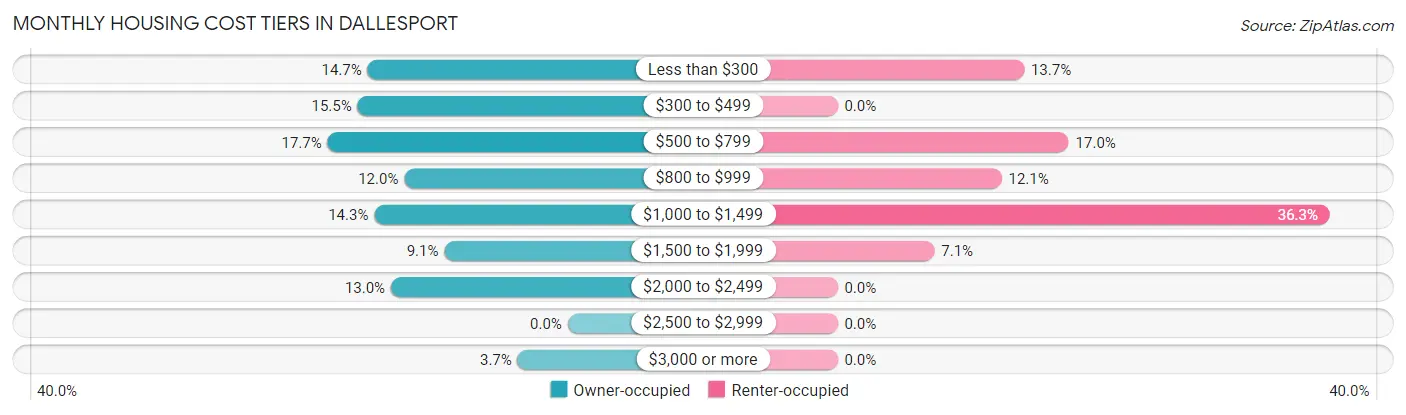
| Monthly Cost | Owner-occupied | Renter-occupied |
| Less than $300 | 60 (14.7%) | 25 (13.7%) |
| $300 to $499 | 63 (15.5%) | 0 (0.0%) |
| $500 to $799 | 72 (17.7%) | 31 (17.0%) |
| $800 to $999 | 49 (12.0%) | 22 (12.1%) |
| $1,000 to $1,499 | 58 (14.2%) | 66 (36.3%) |
| $1,500 to $1,999 | 37 (9.1%) | 13 (7.1%) |
| $2,000 to $2,499 | 53 (13.0%) | 0 (0.0%) |
| $2,500 to $2,999 | 0 (0.0%) | 0 (0.0%) |
| $3,000 or more | 15 (3.7%) | 0 (0.0%) |
| Total | 407 (100.0%) | 182 (100.0%) |
Physical Housing Characteristics in Dallesport
Housing Structures in Dallesport
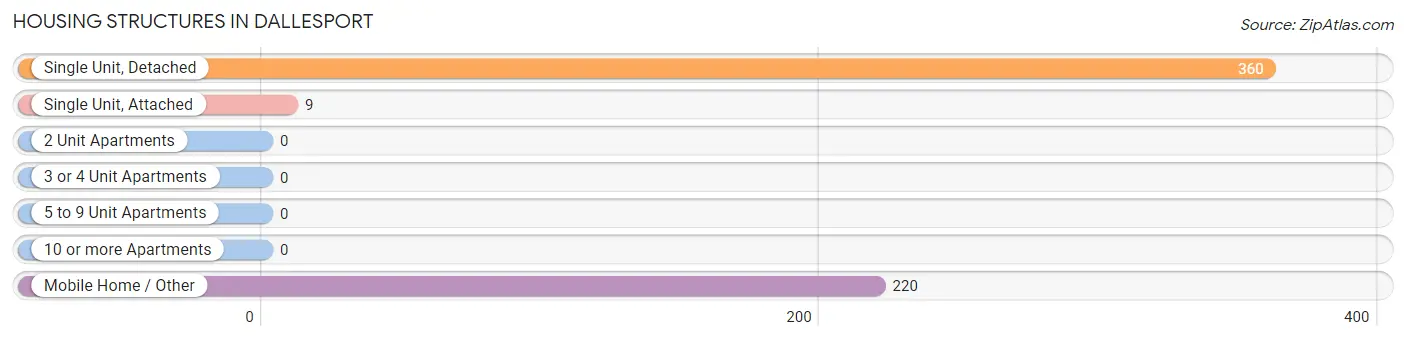
| Structure Type | # Housing Units | % Housing Units |
| Single Unit, Detached | 360 | 61.1% |
| Single Unit, Attached | 9 | 1.5% |
| 2 Unit Apartments | 0 | 0.0% |
| 3 or 4 Unit Apartments | 0 | 0.0% |
| 5 to 9 Unit Apartments | 0 | 0.0% |
| 10 or more Apartments | 0 | 0.0% |
| Mobile Home / Other | 220 | 37.3% |
| Total | 589 | 100.0% |
Housing Structures by Occupancy in Dallesport
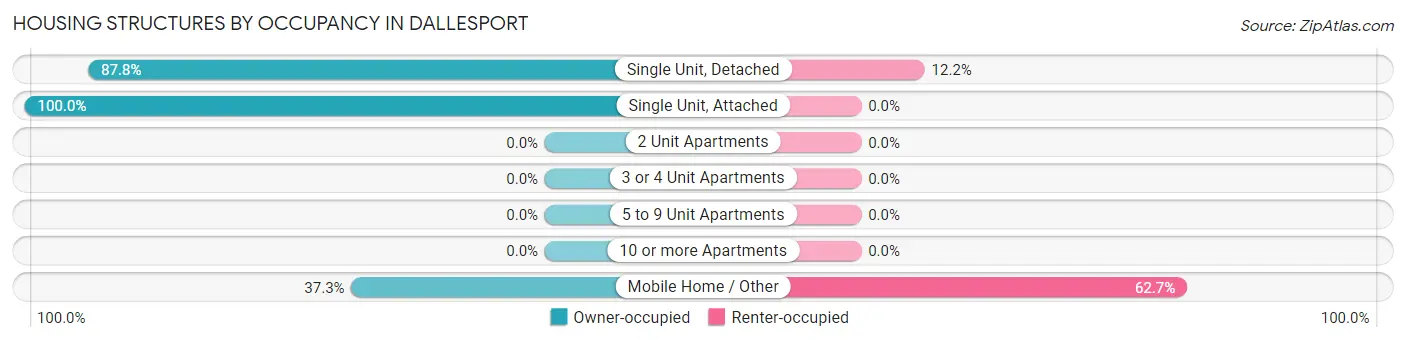
| Structure Type | Owner-occupied | Renter-occupied |
| Single Unit, Detached | 316 (87.8%) | 44 (12.2%) |
| Single Unit, Attached | 9 (100.0%) | 0 (0.0%) |
| 2 Unit Apartments | 0 (0.0%) | 0 (0.0%) |
| 3 or 4 Unit Apartments | 0 (0.0%) | 0 (0.0%) |
| 5 to 9 Unit Apartments | 0 (0.0%) | 0 (0.0%) |
| 10 or more Apartments | 0 (0.0%) | 0 (0.0%) |
| Mobile Home / Other | 82 (37.3%) | 138 (62.7%) |
| Total | 407 (69.1%) | 182 (30.9%) |
Housing Structures by Number of Rooms in Dallesport
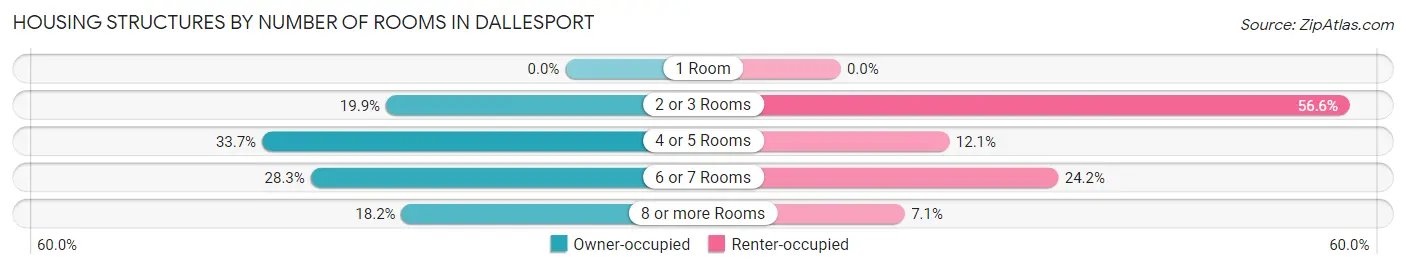
| Number of Rooms | Owner-occupied | Renter-occupied |
| 1 Room | 0 (0.0%) | 0 (0.0%) |
| 2 or 3 Rooms | 81 (19.9%) | 103 (56.6%) |
| 4 or 5 Rooms | 137 (33.7%) | 22 (12.1%) |
| 6 or 7 Rooms | 115 (28.3%) | 44 (24.2%) |
| 8 or more Rooms | 74 (18.2%) | 13 (7.1%) |
| Total | 407 (100.0%) | 182 (100.0%) |
Housing Structure by Heating Type in Dallesport
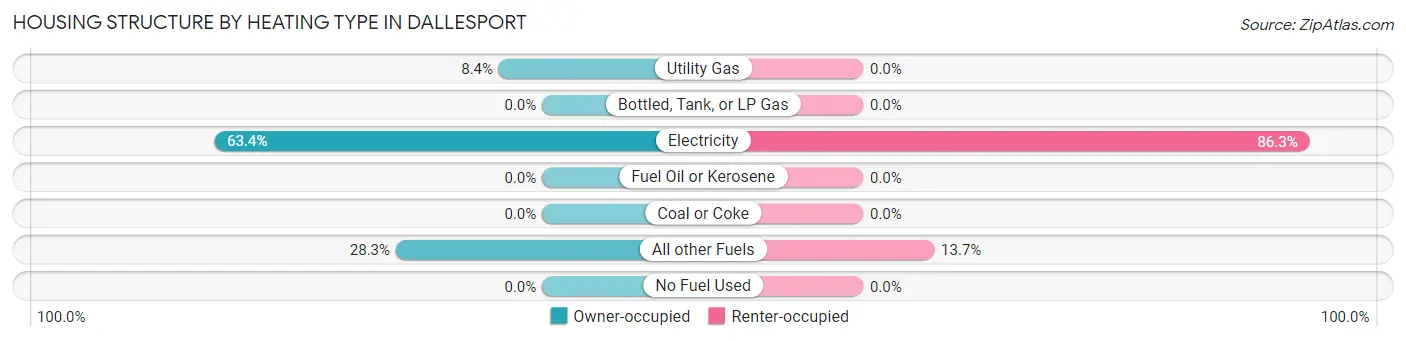
| Heating Type | Owner-occupied | Renter-occupied |
| Utility Gas | 34 (8.4%) | 0 (0.0%) |
| Bottled, Tank, or LP Gas | 0 (0.0%) | 0 (0.0%) |
| Electricity | 258 (63.4%) | 157 (86.3%) |
| Fuel Oil or Kerosene | 0 (0.0%) | 0 (0.0%) |
| Coal or Coke | 0 (0.0%) | 0 (0.0%) |
| All other Fuels | 115 (28.3%) | 25 (13.7%) |
| No Fuel Used | 0 (0.0%) | 0 (0.0%) |
| Total | 407 (100.0%) | 182 (100.0%) |
Household Vehicle Usage in Dallesport
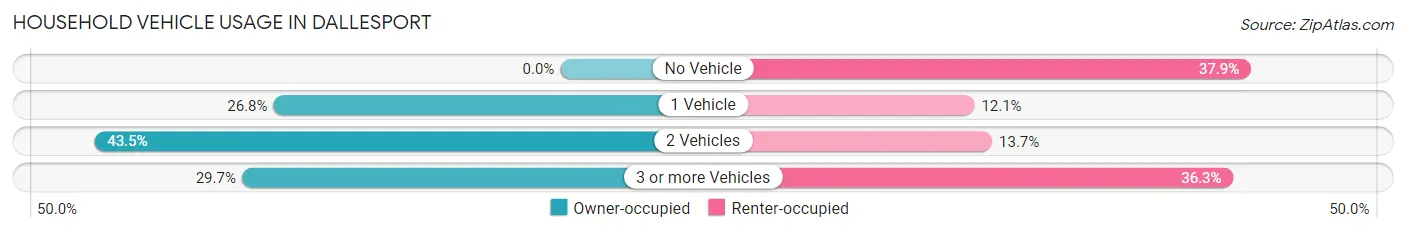
| Vehicles per Household | Owner-occupied | Renter-occupied |
| No Vehicle | 0 (0.0%) | 69 (37.9%) |
| 1 Vehicle | 109 (26.8%) | 22 (12.1%) |
| 2 Vehicles | 177 (43.5%) | 25 (13.7%) |
| 3 or more Vehicles | 121 (29.7%) | 66 (36.3%) |
| Total | 407 (100.0%) | 182 (100.0%) |
Real Estate & Mortgages in Dallesport
Real Estate and Mortgage Overview in Dallesport
| Characteristic | Without Mortgage | With Mortgage |
| Housing Units | 269 | 138 |
| Median Property Value | $319,000 | $357,400 |
| Median Household Income | $66,012 | $15 |
| Monthly Housing Costs | $523 | $15 |
| Real Estate Taxes | $2,558 | $25 |
Property Value by Mortgage Status in Dallesport
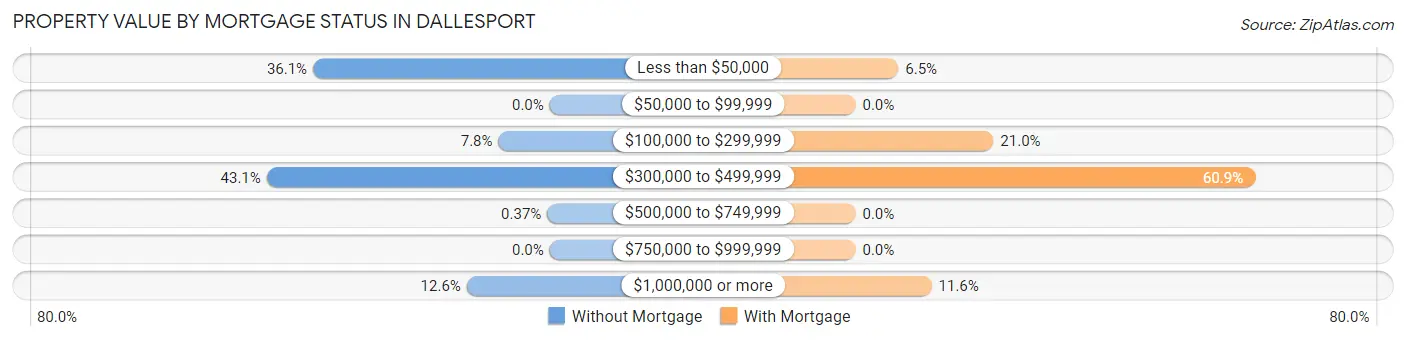
| Property Value | Without Mortgage | With Mortgage |
| Less than $50,000 | 97 (36.1%) | 9 (6.5%) |
| $50,000 to $99,999 | 0 (0.0%) | 0 (0.0%) |
| $100,000 to $299,999 | 21 (7.8%) | 29 (21.0%) |
| $300,000 to $499,999 | 116 (43.1%) | 84 (60.9%) |
| $500,000 to $749,999 | 1 (0.4%) | 0 (0.0%) |
| $750,000 to $999,999 | 0 (0.0%) | 0 (0.0%) |
| $1,000,000 or more | 34 (12.6%) | 16 (11.6%) |
| Total | 269 (100.0%) | 138 (100.0%) |
Household Income by Mortgage Status in Dallesport
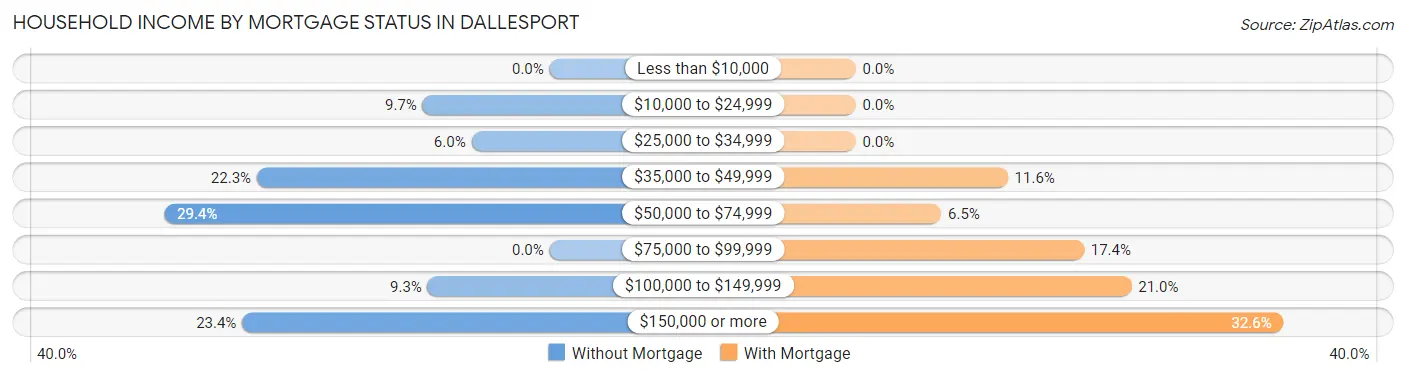
| Household Income | Without Mortgage | With Mortgage |
| Less than $10,000 | 0 (0.0%) | 0 (0.0%) |
| $10,000 to $24,999 | 26 (9.7%) | 0 (0.0%) |
| $25,000 to $34,999 | 16 (5.9%) | 0 (0.0%) |
| $35,000 to $49,999 | 60 (22.3%) | 16 (11.6%) |
| $50,000 to $74,999 | 79 (29.4%) | 9 (6.5%) |
| $75,000 to $99,999 | 0 (0.0%) | 24 (17.4%) |
| $100,000 to $149,999 | 25 (9.3%) | 29 (21.0%) |
| $150,000 or more | 63 (23.4%) | 45 (32.6%) |
| Total | 269 (100.0%) | 138 (100.0%) |
Property Value to Household Income Ratio in Dallesport
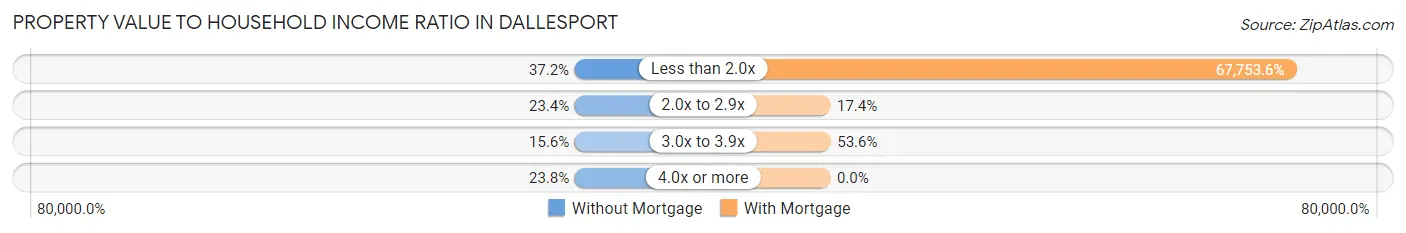
| Value-to-Income Ratio | Without Mortgage | With Mortgage |
| Less than 2.0x | 100 (37.2%) | 93,500 (67,753.6%) |
| 2.0x to 2.9x | 63 (23.4%) | 24 (17.4%) |
| 3.0x to 3.9x | 42 (15.6%) | 74 (53.6%) |
| 4.0x or more | 64 (23.8%) | 0 (0.0%) |
| Total | 269 (100.0%) | 138 (100.0%) |
Real Estate Taxes by Mortgage Status in Dallesport
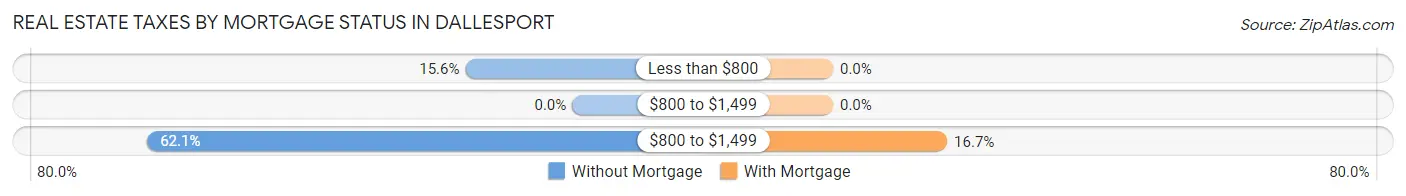
| Property Taxes | Without Mortgage | With Mortgage |
| Less than $800 | 42 (15.6%) | 0 (0.0%) |
| $800 to $1,499 | 0 (0.0%) | 0 (0.0%) |
| $800 to $1,499 | 167 (62.1%) | 23 (16.7%) |
| Total | 269 (100.0%) | 138 (100.0%) |
Health & Disability in Dallesport
Health Insurance Coverage by Age in Dallesport
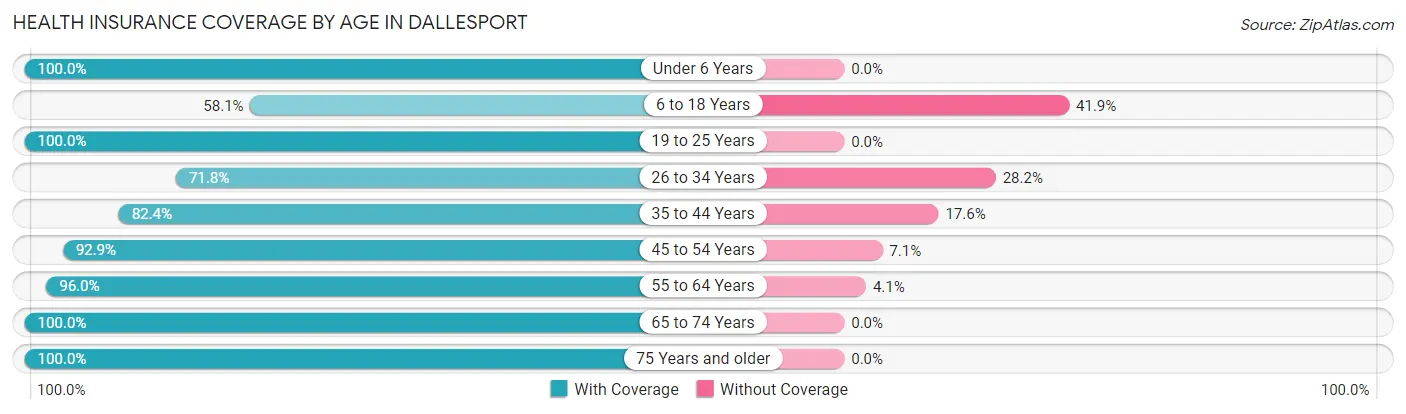
| Age Bracket | With Coverage | Without Coverage |
| Under 6 Years | 152 (100.0%) | 0 (0.0%) |
| 6 to 18 Years | 115 (58.1%) | 83 (41.9%) |
| 19 to 25 Years | 80 (100.0%) | 0 (0.0%) |
| 26 to 34 Years | 61 (71.8%) | 24 (28.2%) |
| 35 to 44 Years | 216 (82.4%) | 46 (17.6%) |
| 45 to 54 Years | 183 (92.9%) | 14 (7.1%) |
| 55 to 64 Years | 213 (96.0%) | 9 (4.1%) |
| 65 to 74 Years | 104 (100.0%) | 0 (0.0%) |
| 75 Years and older | 126 (100.0%) | 0 (0.0%) |
| Total | 1,250 (87.7%) | 176 (12.3%) |
Health Insurance Coverage by Citizenship Status in Dallesport
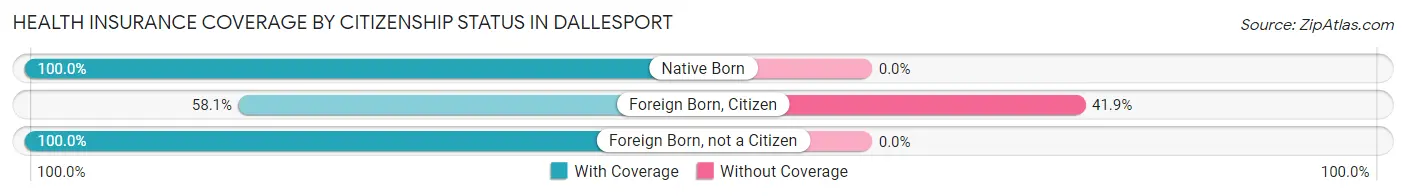
| Citizenship Status | With Coverage | Without Coverage |
| Native Born | 152 (100.0%) | 0 (0.0%) |
| Foreign Born, Citizen | 115 (58.1%) | 83 (41.9%) |
| Foreign Born, not a Citizen | 80 (100.0%) | 0 (0.0%) |
Health Insurance Coverage by Household Income in Dallesport
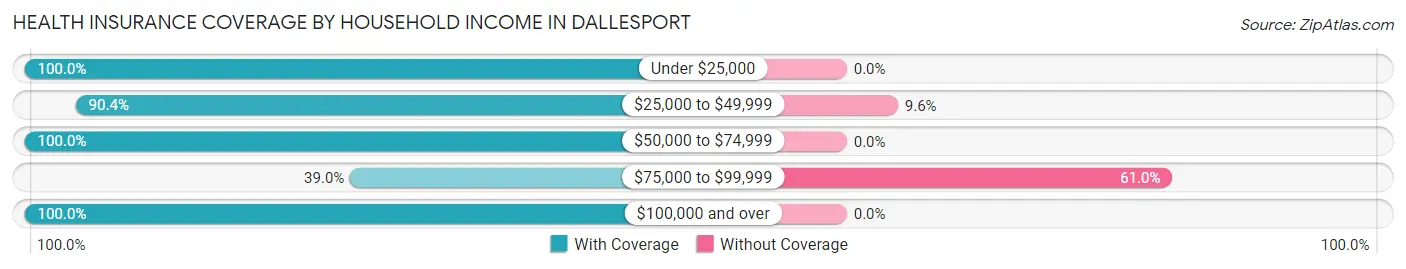
| Household Income | With Coverage | Without Coverage |
| Under $25,000 | 103 (100.0%) | 0 (0.0%) |
| $25,000 to $49,999 | 378 (90.4%) | 40 (9.6%) |
| $50,000 to $74,999 | 350 (100.0%) | 0 (0.0%) |
| $75,000 to $99,999 | 87 (39.0%) | 136 (61.0%) |
| $100,000 and over | 332 (100.0%) | 0 (0.0%) |
Public vs Private Health Insurance Coverage by Age in Dallesport
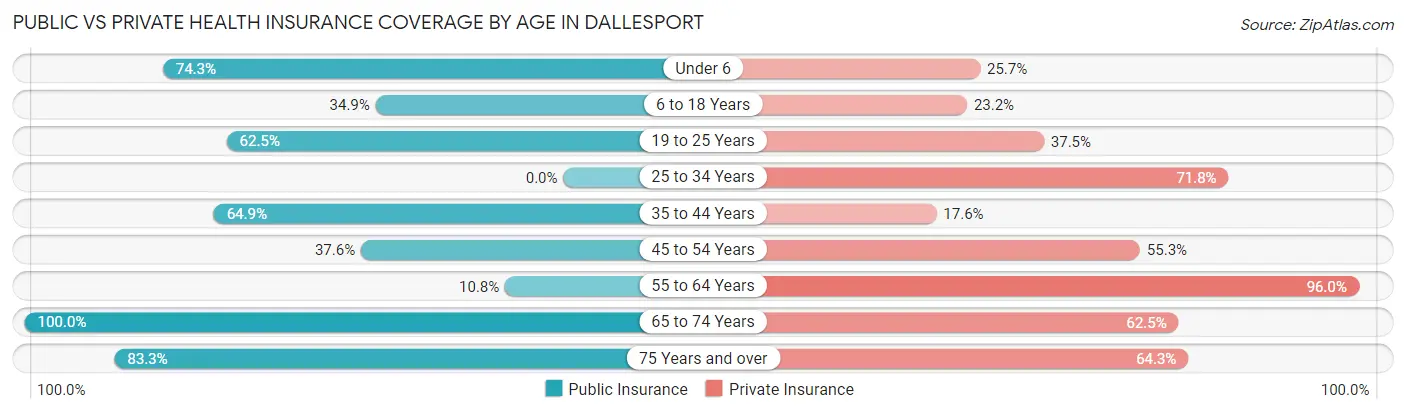
| Age Bracket | Public Insurance | Private Insurance |
| Under 6 | 113 (74.3%) | 39 (25.7%) |
| 6 to 18 Years | 69 (34.8%) | 46 (23.2%) |
| 19 to 25 Years | 50 (62.5%) | 30 (37.5%) |
| 25 to 34 Years | 0 (0.0%) | 61 (71.8%) |
| 35 to 44 Years | 170 (64.9%) | 46 (17.6%) |
| 45 to 54 Years | 74 (37.6%) | 109 (55.3%) |
| 55 to 64 Years | 24 (10.8%) | 213 (96.0%) |
| 65 to 74 Years | 104 (100.0%) | 65 (62.5%) |
| 75 Years and over | 105 (83.3%) | 81 (64.3%) |
| Total | 709 (49.7%) | 690 (48.4%) |
Disability Status by Sex by Age in Dallesport
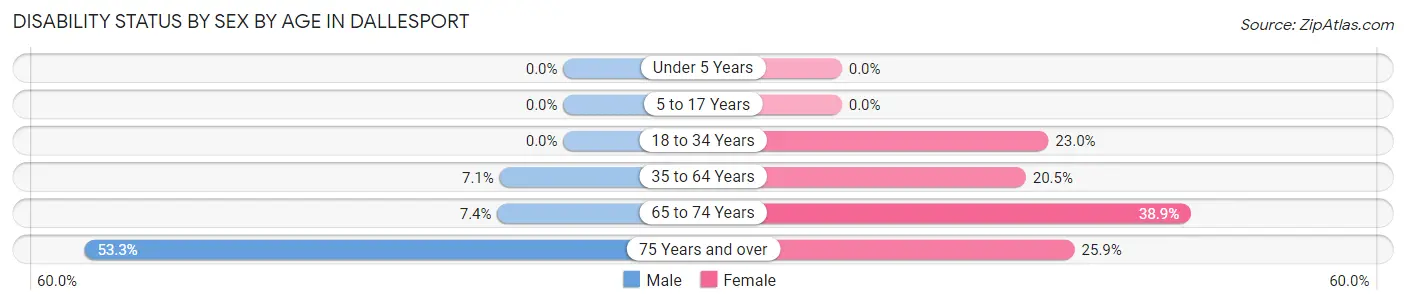
| Age Bracket | Male | Female |
| Under 5 Years | 0 (0.0%) | 0 (0.0%) |
| 5 to 17 Years | 0 (0.0%) | 0 (0.0%) |
| 18 to 34 Years | 0 (0.0%) | 26 (23.0%) |
| 35 to 64 Years | 22 (7.1%) | 76 (20.5%) |
| 65 to 74 Years | 5 (7.3%) | 14 (38.9%) |
| 75 Years and over | 24 (53.3%) | 21 (25.9%) |
Disability Class by Sex by Age in Dallesport
Disability Class: Hearing Difficulty
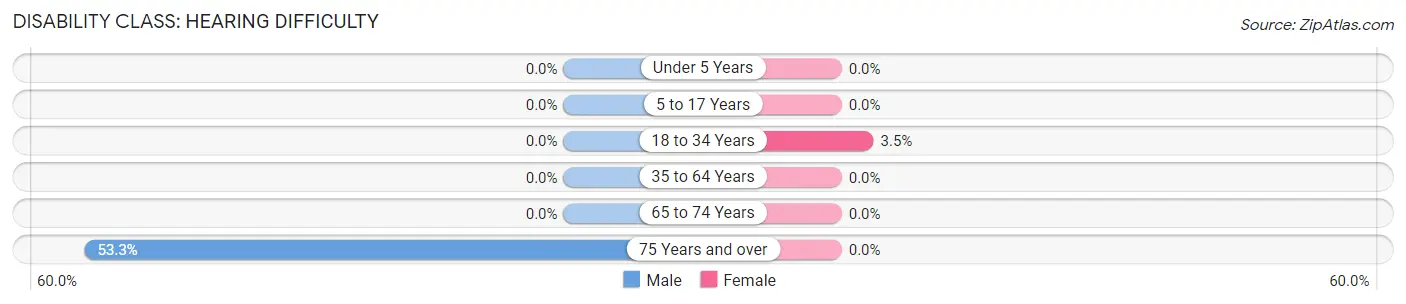
| Age Bracket | Male | Female |
| Under 5 Years | 0 (0.0%) | 0 (0.0%) |
| 5 to 17 Years | 0 (0.0%) | 0 (0.0%) |
| 18 to 34 Years | 0 (0.0%) | 4 (3.5%) |
| 35 to 64 Years | 0 (0.0%) | 0 (0.0%) |
| 65 to 74 Years | 0 (0.0%) | 0 (0.0%) |
| 75 Years and over | 24 (53.3%) | 0 (0.0%) |
Disability Class: Vision Difficulty
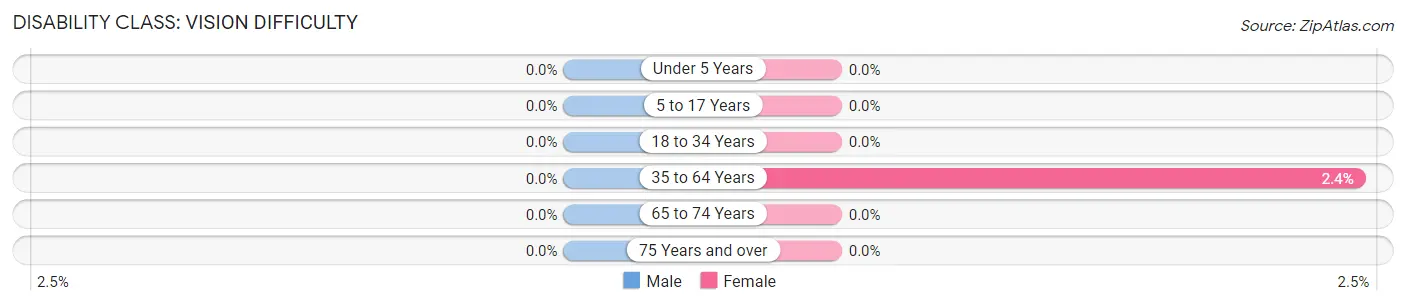
| Age Bracket | Male | Female |
| Under 5 Years | 0 (0.0%) | 0 (0.0%) |
| 5 to 17 Years | 0 (0.0%) | 0 (0.0%) |
| 18 to 34 Years | 0 (0.0%) | 0 (0.0%) |
| 35 to 64 Years | 0 (0.0%) | 9 (2.4%) |
| 65 to 74 Years | 0 (0.0%) | 0 (0.0%) |
| 75 Years and over | 0 (0.0%) | 0 (0.0%) |
Disability Class: Cognitive Difficulty
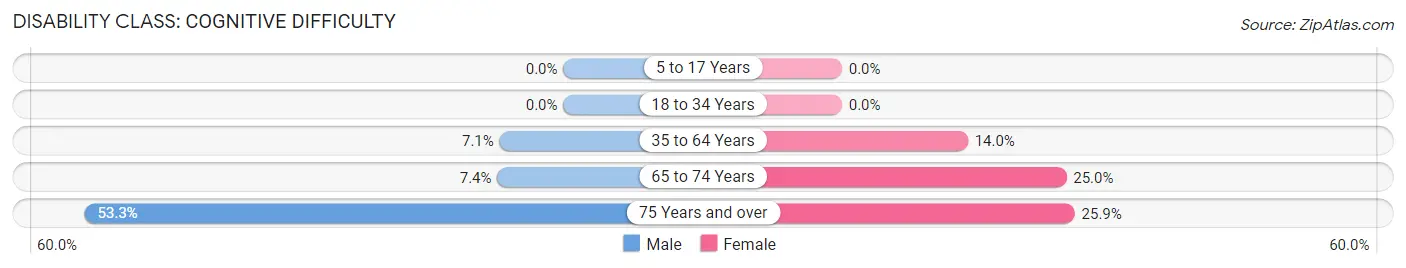
| Age Bracket | Male | Female |
| 5 to 17 Years | 0 (0.0%) | 0 (0.0%) |
| 18 to 34 Years | 0 (0.0%) | 0 (0.0%) |
| 35 to 64 Years | 22 (7.1%) | 52 (14.0%) |
| 65 to 74 Years | 5 (7.3%) | 9 (25.0%) |
| 75 Years and over | 24 (53.3%) | 21 (25.9%) |
Disability Class: Ambulatory Difficulty
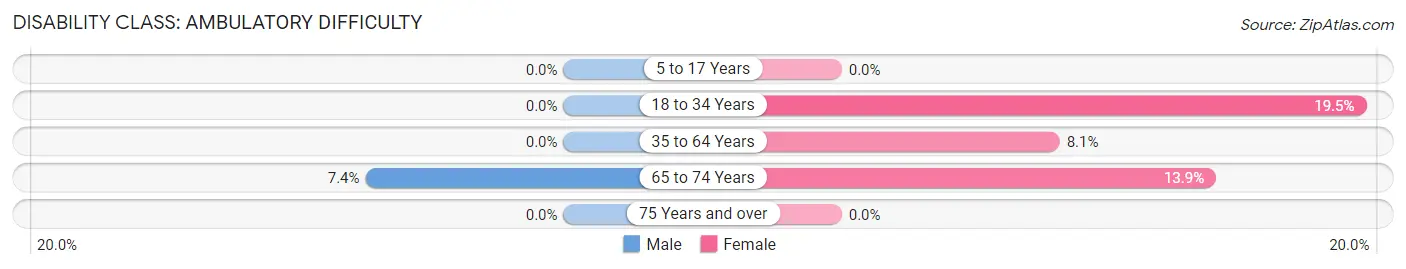
| Age Bracket | Male | Female |
| 5 to 17 Years | 0 (0.0%) | 0 (0.0%) |
| 18 to 34 Years | 0 (0.0%) | 22 (19.5%) |
| 35 to 64 Years | 0 (0.0%) | 30 (8.1%) |
| 65 to 74 Years | 5 (7.3%) | 5 (13.9%) |
| 75 Years and over | 0 (0.0%) | 0 (0.0%) |
Disability Class: Self-Care Difficulty
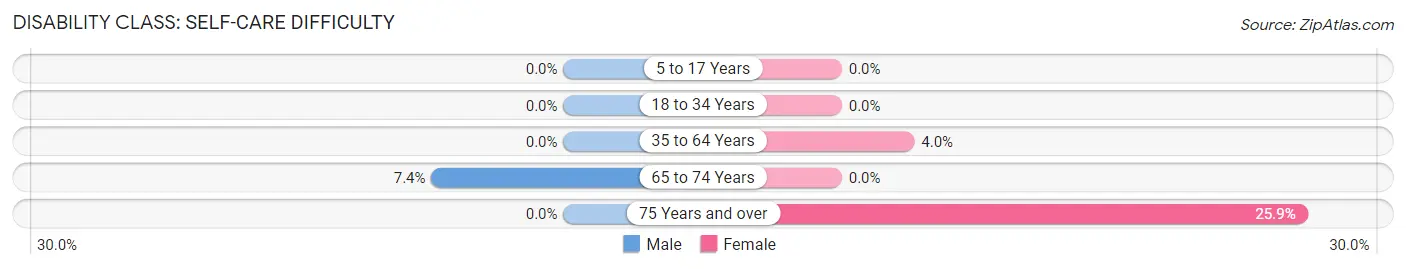
| Age Bracket | Male | Female |
| 5 to 17 Years | 0 (0.0%) | 0 (0.0%) |
| 18 to 34 Years | 0 (0.0%) | 0 (0.0%) |
| 35 to 64 Years | 0 (0.0%) | 15 (4.0%) |
| 65 to 74 Years | 5 (7.3%) | 0 (0.0%) |
| 75 Years and over | 0 (0.0%) | 21 (25.9%) |
Technology Access in Dallesport
Computing Device Access in Dallesport
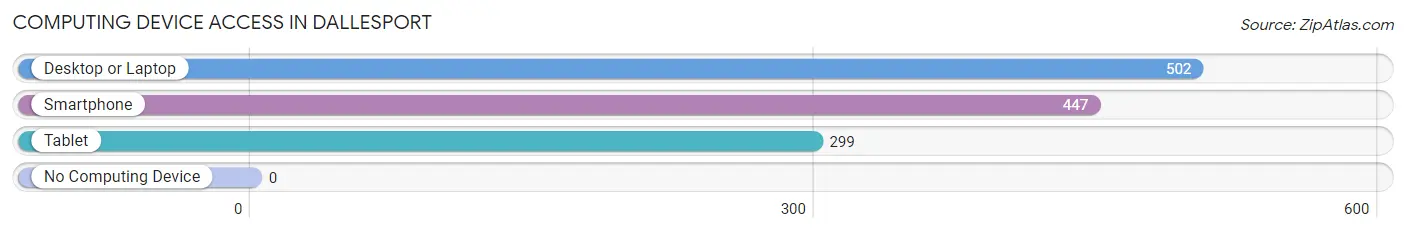
| Device Type | # Households | % Households |
| Desktop or Laptop | 502 | 85.2% |
| Smartphone | 447 | 75.9% |
| Tablet | 299 | 50.8% |
| No Computing Device | 0 | 0.0% |
| Total | 589 | 100.0% |
Internet Access in Dallesport
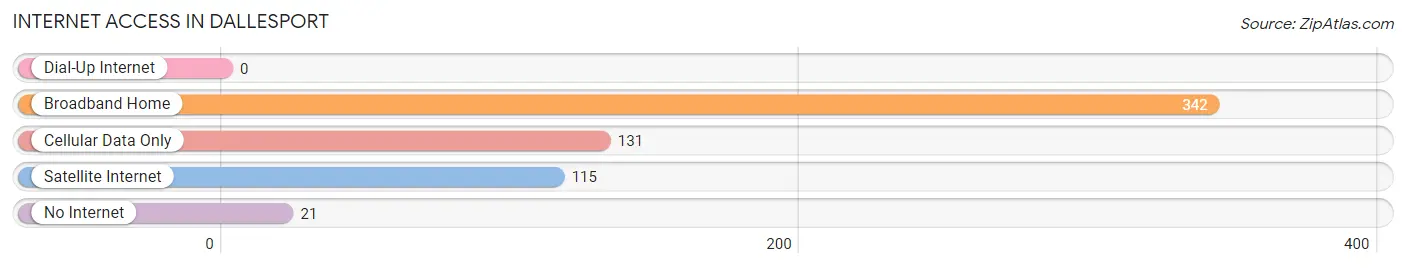
| Internet Type | # Households | % Households |
| Dial-Up Internet | 0 | 0.0% |
| Broadband Home | 342 | 58.1% |
| Cellular Data Only | 131 | 22.2% |
| Satellite Internet | 115 | 19.5% |
| No Internet | 21 | 3.6% |
| Total | 589 | 100.0% |
Dallesport Summary
Dallesport is a small unincorporated community located in Klickitat County, Washington, United States. It is situated along the Columbia River, just south of the city of The Dalles, Oregon. The population of Dallesport was 1,093 at the 2010 census.
History
Dallesport was first settled in the late 19th century by settlers from The Dalles, Oregon. The town was originally known as "Dalles City" and was later renamed "Dallesport" in 1891. The name was chosen to reflect the town's proximity to the Columbia River and its importance as a port.
The town was incorporated in 1892 and was home to a number of businesses, including a sawmill, a flour mill, a hotel, and a general store. The town also had a post office, which opened in 1891 and closed in 1902.
In the early 20th century, Dallesport was a popular destination for tourists, who came to enjoy the scenery and the fishing. The town was also home to a number of Native American tribes, including the Yakama, Umatilla, and Nez Perce.
Geography
Dallesport is located in Klickitat County, Washington, at the confluence of the Columbia and Klickitat Rivers. The town is situated on the south bank of the Columbia River, just south of the city of The Dalles, Oregon.
The town has a total area of 0.9 square miles, all of which is land. The elevation of Dallesport is 545 feet above sea level.
Economy
The economy of Dallesport is largely based on tourism and agriculture. The town is home to a number of tourist attractions, including the Columbia Gorge Discovery Center and the Columbia Gorge Interpretive Center.
Agriculture is also an important part of the local economy. The town is home to a number of farms, which produce a variety of crops, including apples, cherries, and grapes.
Demographics
As of the 2010 census, there were 1,093 people, 441 households, and 294 families residing in Dallesport. The population density was 1,203.3 people per square mile. The racial makeup of the town was 92.2% White, 0.2% African American, 0.9% Native American, 0.7% Asian, 0.1% Pacific Islander, 2.2% from other races, and 3.7% from two or more races. Hispanic or Latino of any race were 5.2% of the population.
The median income for a household in Dallesport was $37,500, and the median income for a family was $45,000. The per capita income for the town was $18,945. About 11.2% of families and 14.2% of the population were below the poverty line, including 18.2% of those under age 18 and 8.3% of those age 65 or over.
Common Questions
What is Per Capita Income in Dallesport?
Per Capita income in Dallesport is $35,940.
What is the Median Family Income in Dallesport?
Median Family Income in Dallesport is $80,179.
What is the Median Household income in Dallesport?
Median Household Income in Dallesport is $62,759.
What is Inequality or Gini Index in Dallesport?
Inequality or Gini Index in Dallesport is 0.48.
What is the Total Population of Dallesport?
Total Population of Dallesport is 1,426.
What is the Total Male Population of Dallesport?
Total Male Population of Dallesport is 660.
What is the Total Female Population of Dallesport?
Total Female Population of Dallesport is 766.
What is the Ratio of Males per 100 Females in Dallesport?
There are 86.16 Males per 100 Females in Dallesport.
What is the Ratio of Females per 100 Males in Dallesport?
There are 116.06 Females per 100 Males in Dallesport.
What is the Median Population Age in Dallesport?
Median Population Age in Dallesport is 42.3 Years.
What is the Average Family Size in Dallesport
Average Family Size in Dallesport is 3.1 People.
What is the Average Household Size in Dallesport
Average Household Size in Dallesport is 2.4 People.
How Large is the Labor Force in Dallesport?
There are 618 People in the Labor Forcein in Dallesport.
What is the Percentage of People in the Labor Force in Dallesport?
54.3% of People are in the Labor Force in Dallesport.
What is the Unemployment Rate in Dallesport?
Unemployment Rate in Dallesport is 14.1%.