Prosser, WA Map & Demographics
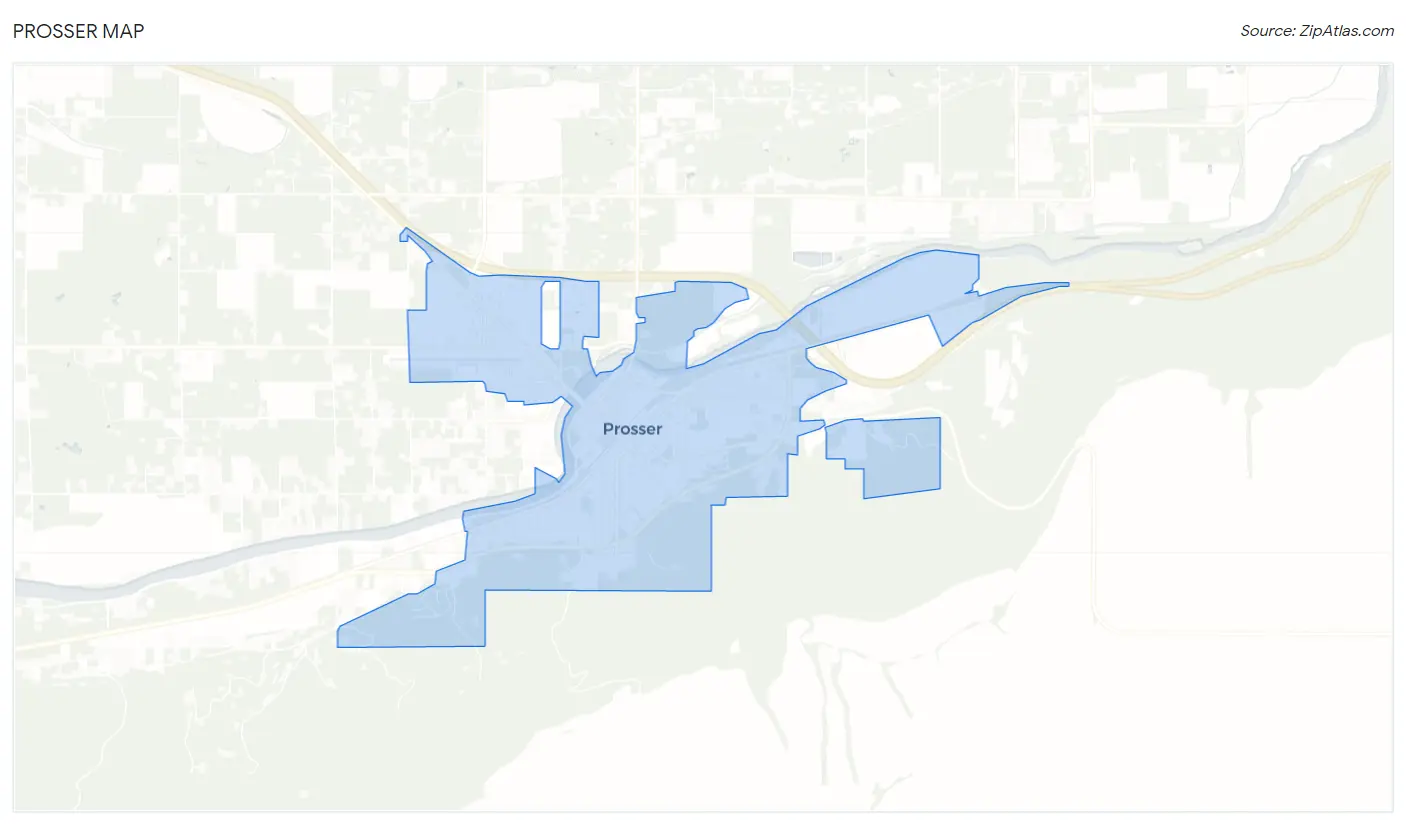
Prosser Map
Prosser Overview
$28,871
PER CAPITA INCOME
$66,250
AVG FAMILY INCOME
$64,622
AVG HOUSEHOLD INCOME
47.4%
WAGE / INCOME GAP [ % ]
52.6¢/ $1
WAGE / INCOME GAP [ $ ]
0.41
INEQUALITY / GINI INDEX
6,138
TOTAL POPULATION
2,906
MALE POPULATION
3,232
FEMALE POPULATION
89.91
MALES / 100 FEMALES
111.22
FEMALES / 100 MALES
33.4
MEDIAN AGE
3.3
AVG FAMILY SIZE
2.7
AVG HOUSEHOLD SIZE
2,708
LABOR FORCE [ PEOPLE ]
59.6%
PERCENT IN LABOR FORCE
10.5%
UNEMPLOYMENT RATE
Prosser Zip Codes
Prosser Area Codes
Income in Prosser
Income Overview in Prosser
Per Capita Income in Prosser is $28,871, while median incomes of families and households are $66,250 and $64,622 respectively.
| Characteristic | Number | Measure |
| Per Capita Income | 6,138 | $28,871 |
| Median Family Income | 1,559 | $66,250 |
| Mean Family Income | 1,559 | $84,535 |
| Median Household Income | 2,255 | $64,622 |
| Mean Household Income | 2,255 | $76,069 |
| Income Deficit | 1,559 | $0 |
| Wage / Income Gap (%) | 6,138 | 47.37% |
| Wage / Income Gap ($) | 6,138 | 52.63¢ per $1 |
| Gini / Inequality Index | 6,138 | 0.41 |
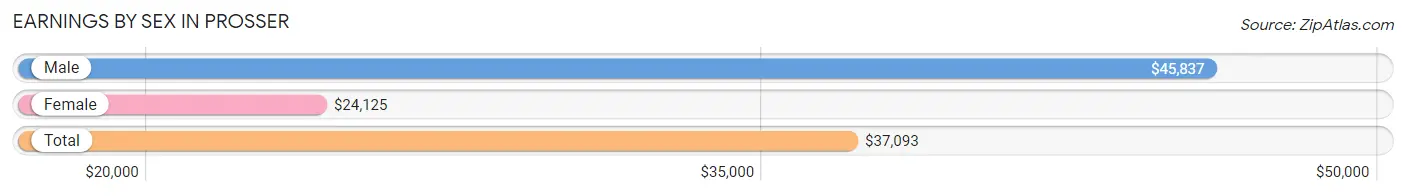
Earnings by Sex in Prosser
Average Earnings in Prosser are $37,093, $45,837 for men and $24,125 for women, a difference of 47.4%.
| Sex | Number | Average Earnings |
| Male | 1,500 (54.4%) | $45,837 |
| Female | 1,255 (45.6%) | $24,125 |
| Total | 2,755 (100.0%) | $37,093 |
Earnings by Sex by Income Bracket in Prosser
The most common earnings brackets in Prosser are $45,000 to $49,999 for men (289 | 19.3%) and $55,000 to $64,999 for women (190 | 15.1%).
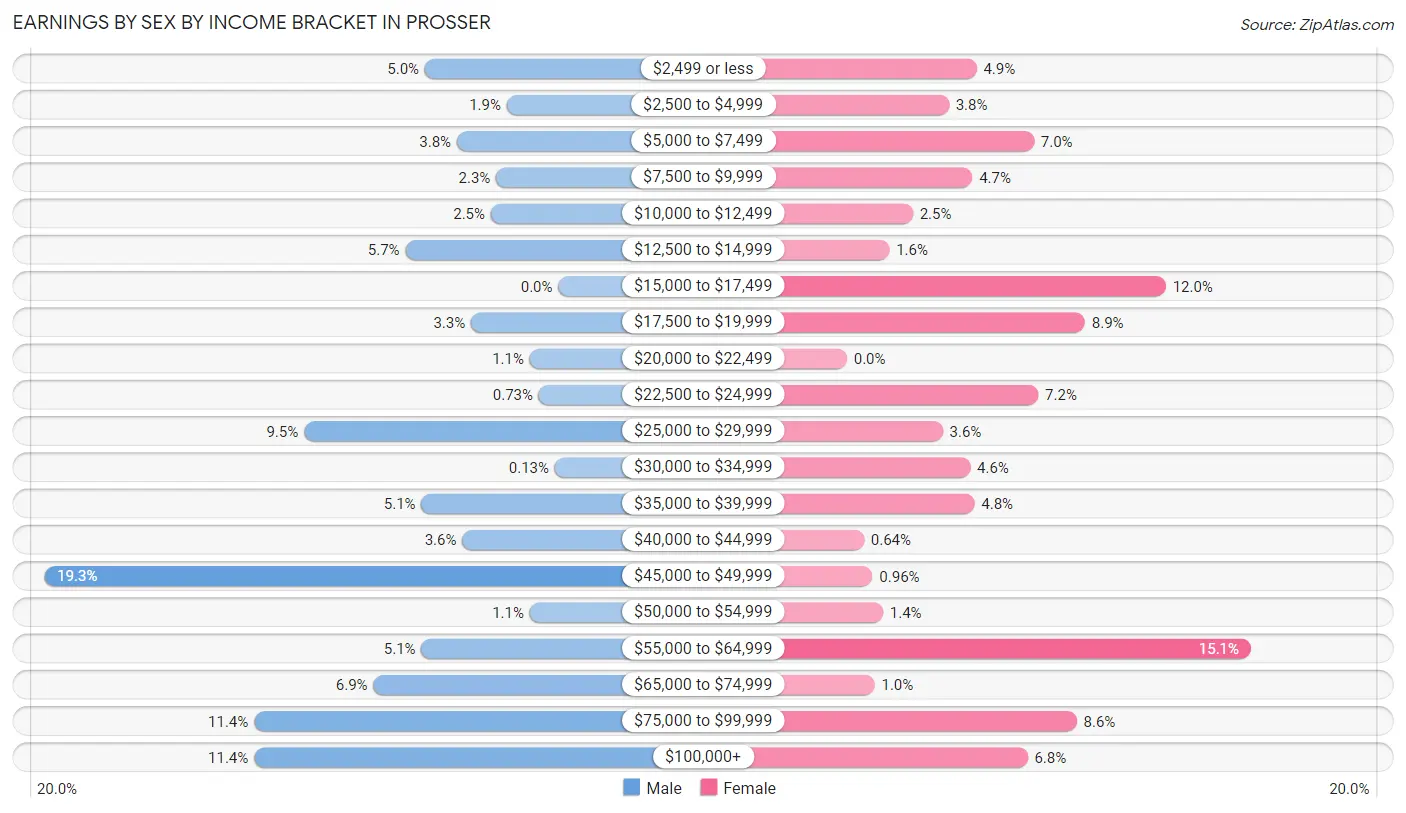
| Income | Male | Female |
| $2,499 or less | 75 (5.0%) | 61 (4.9%) |
| $2,500 to $4,999 | 29 (1.9%) | 48 (3.8%) |
| $5,000 to $7,499 | 57 (3.8%) | 88 (7.0%) |
| $7,500 to $9,999 | 35 (2.3%) | 59 (4.7%) |
| $10,000 to $12,499 | 38 (2.5%) | 31 (2.5%) |
| $12,500 to $14,999 | 86 (5.7%) | 20 (1.6%) |
| $15,000 to $17,499 | 0 (0.0%) | 150 (11.9%) |
| $17,500 to $19,999 | 49 (3.3%) | 112 (8.9%) |
| $20,000 to $22,499 | 16 (1.1%) | 0 (0.0%) |
| $22,500 to $24,999 | 11 (0.7%) | 90 (7.2%) |
| $25,000 to $29,999 | 143 (9.5%) | 45 (3.6%) |
| $30,000 to $34,999 | 2 (0.1%) | 58 (4.6%) |
| $35,000 to $39,999 | 77 (5.1%) | 60 (4.8%) |
| $40,000 to $44,999 | 54 (3.6%) | 8 (0.6%) |
| $45,000 to $49,999 | 289 (19.3%) | 12 (1.0%) |
| $50,000 to $54,999 | 16 (1.1%) | 17 (1.3%) |
| $55,000 to $64,999 | 77 (5.1%) | 190 (15.1%) |
| $65,000 to $74,999 | 104 (6.9%) | 13 (1.0%) |
| $75,000 to $99,999 | 171 (11.4%) | 108 (8.6%) |
| $100,000+ | 171 (11.4%) | 85 (6.8%) |
| Total | 1,500 (100.0%) | 1,255 (100.0%) |
Earnings by Sex by Educational Attainment in Prosser
Average earnings in Prosser are $47,001 for men and $31,875 for women, a difference of 32.2%. Men with an educational attainment of bachelor's degree enjoy the highest average annual earnings of $99,420, while those with less than high school education earn the least with $42,396. Women with an educational attainment of bachelor's degree earn the most with the average annual earnings of $75,589, while those with less than high school education have the smallest earnings of $16,019.
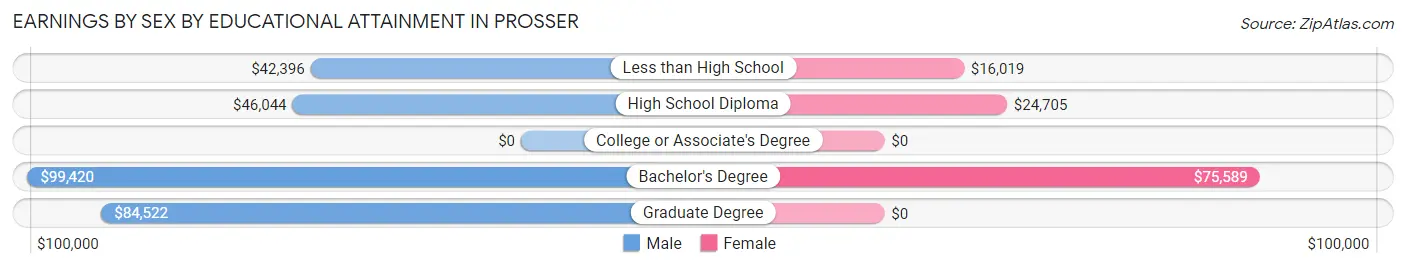
| Educational Attainment | Male Income | Female Income |
| Less than High School | $42,396 | $16,019 |
| High School Diploma | $46,044 | $24,705 |
| College or Associate's Degree | - | - |
| Bachelor's Degree | $99,420 | $75,589 |
| Graduate Degree | $84,522 | $0 |
| Total | $47,001 | $31,875 |
Family Income in Prosser
Family Income Brackets in Prosser
According to the Prosser family income data, there are 483 families falling into the $50,000 to $74,999 income range, which is the most common income bracket and makes up 31.0% of all families.
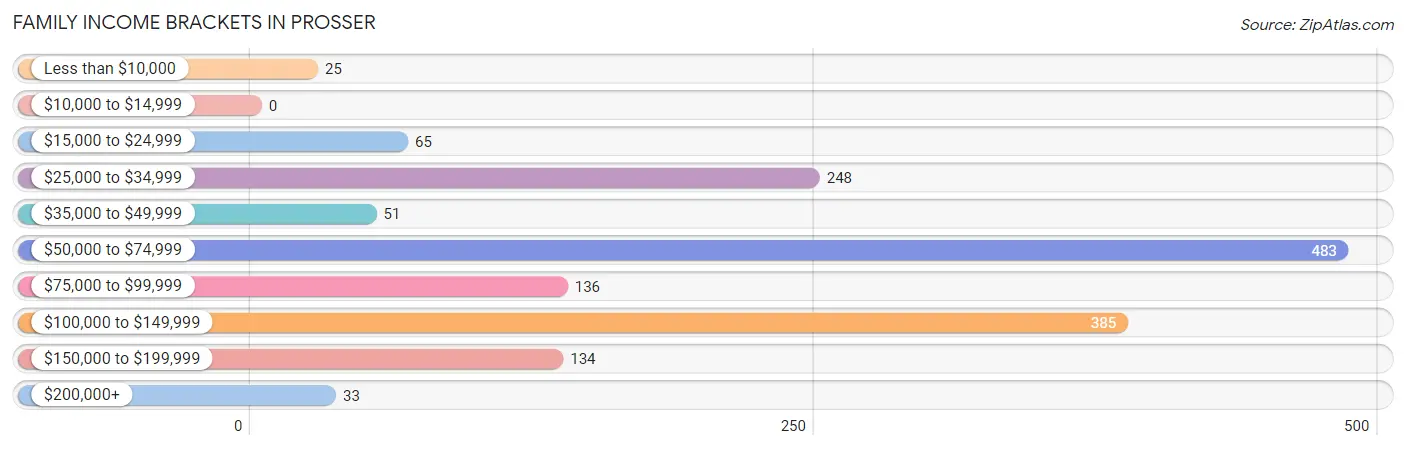
| Income Bracket | # Families | % Families |
| Less than $10,000 | 25 | 1.6% |
| $10,000 to $14,999 | 0 | 0.0% |
| $15,000 to $24,999 | 65 | 4.2% |
| $25,000 to $34,999 | 248 | 15.9% |
| $35,000 to $49,999 | 51 | 3.3% |
| $50,000 to $74,999 | 483 | 31.0% |
| $75,000 to $99,999 | 136 | 8.7% |
| $100,000 to $149,999 | 385 | 24.7% |
| $150,000 to $199,999 | 134 | 8.6% |
| $200,000+ | 33 | 2.1% |
Family Income by Famaliy Size in Prosser
2-person families (579 | 37.1%) account for the highest median family income in Prosser with $69,435 per family, while 2-person families (579 | 37.1%) have the highest median income of $34,718 per family member.
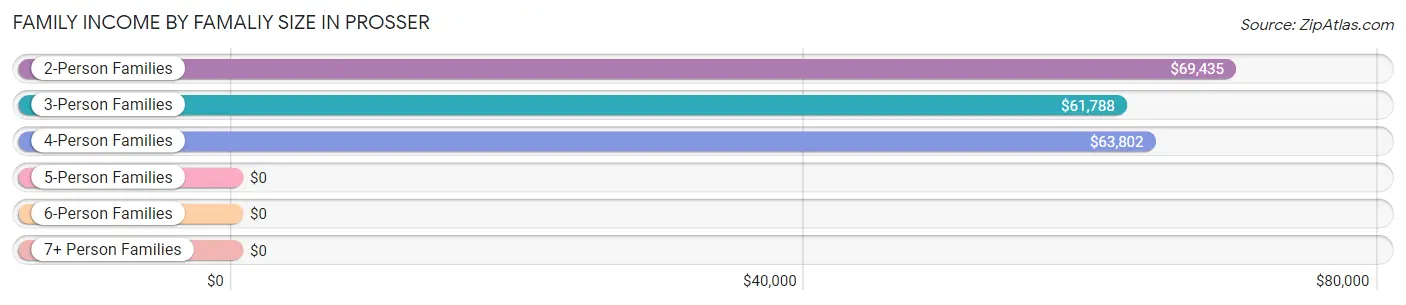
| Income Bracket | # Families | Median Income |
| 2-Person Families | 579 (37.1%) | $69,435 |
| 3-Person Families | 411 (26.4%) | $61,788 |
| 4-Person Families | 380 (24.4%) | $63,802 |
| 5-Person Families | 123 (7.9%) | $0 |
| 6-Person Families | 66 (4.2%) | $0 |
| 7+ Person Families | 0 (0.0%) | $0 |
| Total | 1,559 (100.0%) | $66,250 |
Family Income by Number of Earners in Prosser
The median family income in Prosser is $66,250, with families comprising 3+ earners (167) having the highest median family income of $122,539, while families with 1 earner (821) have the lowest median family income of $56,914, accounting for 10.7% and 52.7% of families, respectively.
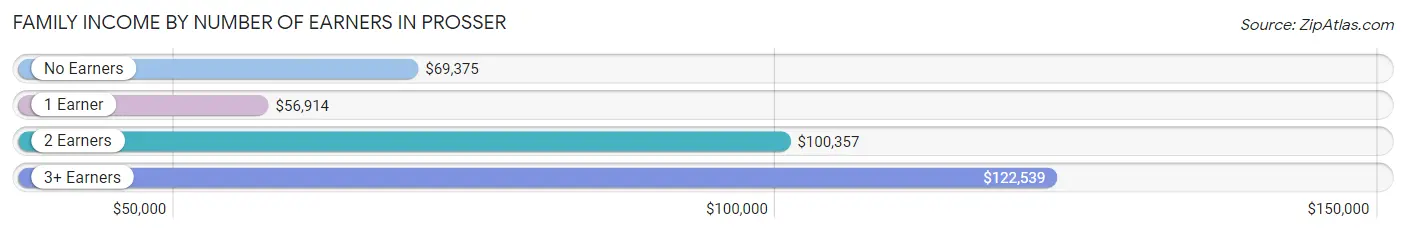
| Number of Earners | # Families | Median Income |
| No Earners | 215 (13.8%) | $69,375 |
| 1 Earner | 821 (52.7%) | $56,914 |
| 2 Earners | 356 (22.8%) | $100,357 |
| 3+ Earners | 167 (10.7%) | $122,539 |
| Total | 1,559 (100.0%) | $66,250 |
Household Income in Prosser
Household Income Brackets in Prosser
With 530 households falling in the category, the $100,000 to $149,999 income range is the most frequent in Prosser, accounting for 23.5% of all households. In contrast, only 54 households (2.4%) fall into the $200,000+ income bracket, making it the least populous group.
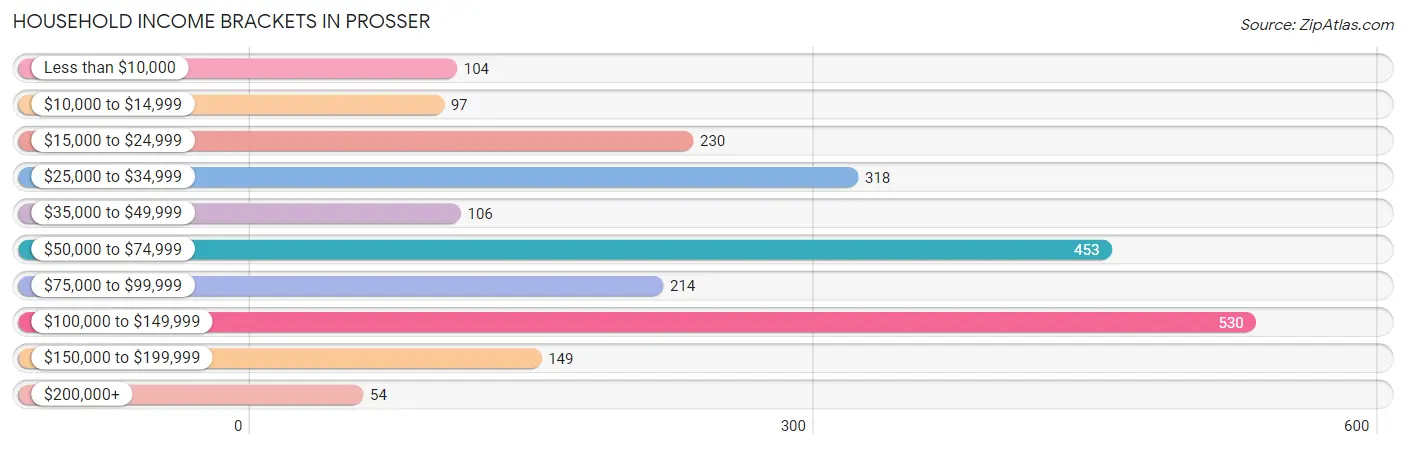
| Income Bracket | # Households | % Households |
| Less than $10,000 | 104 | 4.6% |
| $10,000 to $14,999 | 97 | 4.3% |
| $15,000 to $24,999 | 230 | 10.2% |
| $25,000 to $34,999 | 318 | 14.1% |
| $35,000 to $49,999 | 106 | 4.7% |
| $50,000 to $74,999 | 453 | 20.1% |
| $75,000 to $99,999 | 214 | 9.5% |
| $100,000 to $149,999 | 530 | 23.5% |
| $150,000 to $199,999 | 149 | 6.6% |
| $200,000+ | 54 | 2.4% |
Household Income by Householder Age in Prosser
The median household income in Prosser is $64,622, with the highest median household income of $101,572 found in the 45 to 64 years age bracket for the primary householder. A total of 657 households (29.1%) fall into this category. Meanwhile, the 15 to 24 years age bracket for the primary householder has the lowest median household income of $0, with 16 households (0.7%) in this group.
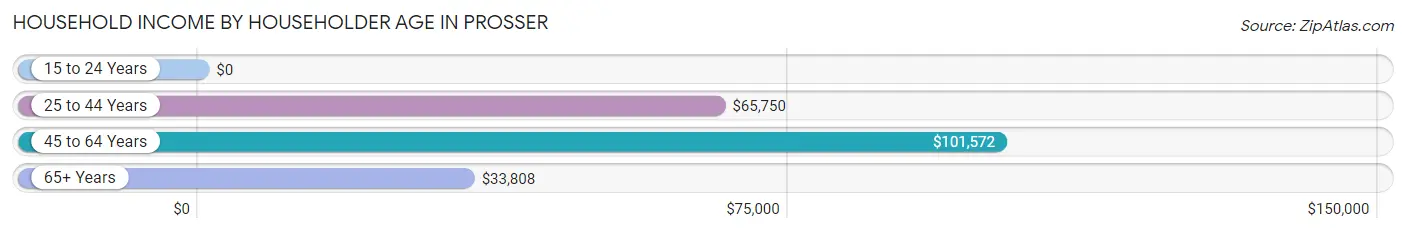
| Income Bracket | # Households | Median Income |
| 15 to 24 Years | 16 (0.7%) | $0 |
| 25 to 44 Years | 749 (33.2%) | $65,750 |
| 45 to 64 Years | 657 (29.1%) | $101,572 |
| 65+ Years | 833 (36.9%) | $33,808 |
| Total | 2,255 (100.0%) | $64,622 |
Poverty in Prosser
Income Below Poverty by Sex and Age in Prosser
With 19.3% poverty level for males and 21.7% for females among the residents of Prosser, 12 to 14 year old males and 6 to 11 year old females are the most vulnerable to poverty, with 193 males (71.8%) and 117 females (42.9%) in their respective age groups living below the poverty level.
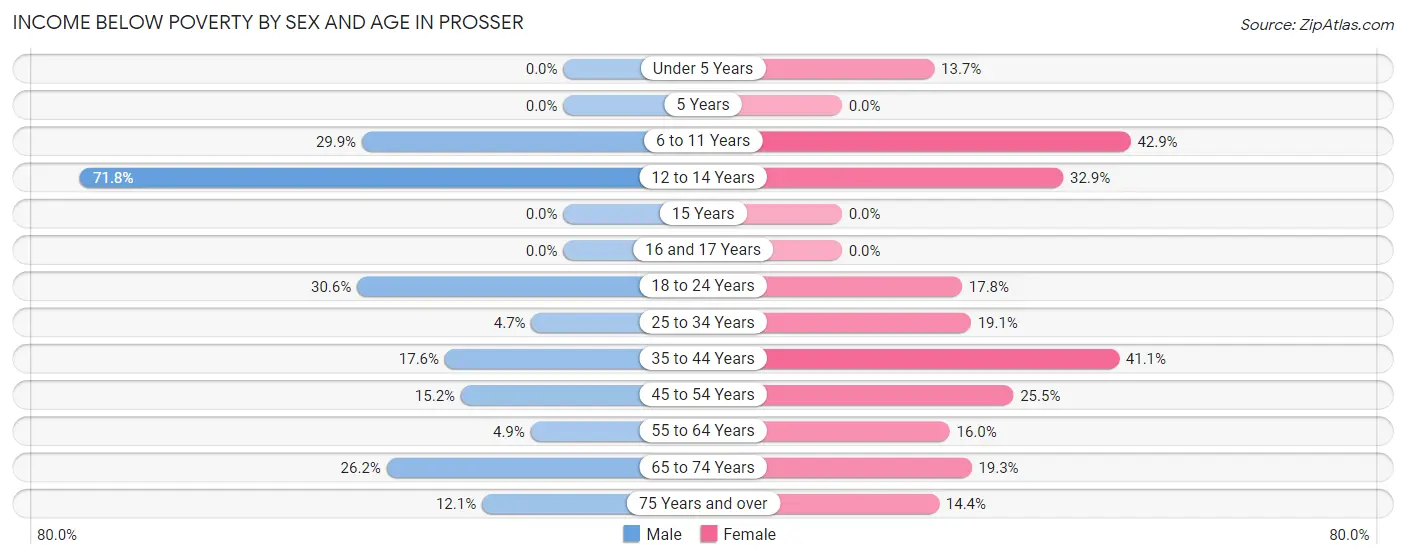
| Age Bracket | Male | Female |
| Under 5 Years | 0 (0.0%) | 34 (13.7%) |
| 5 Years | 0 (0.0%) | 0 (0.0%) |
| 6 to 11 Years | 70 (29.9%) | 117 (42.9%) |
| 12 to 14 Years | 193 (71.8%) | 68 (32.9%) |
| 15 Years | 0 (0.0%) | 0 (0.0%) |
| 16 and 17 Years | 0 (0.0%) | 0 (0.0%) |
| 18 to 24 Years | 72 (30.6%) | 74 (17.8%) |
| 25 to 34 Years | 25 (4.7%) | 80 (19.1%) |
| 35 to 44 Years | 51 (17.6%) | 72 (41.1%) |
| 45 to 54 Years | 59 (15.2%) | 97 (25.5%) |
| 55 to 64 Years | 12 (4.9%) | 36 (16.0%) |
| 65 to 74 Years | 53 (26.2%) | 72 (19.3%) |
| 75 Years and over | 25 (12.1%) | 49 (14.4%) |
| Total | 560 (19.3%) | 699 (21.7%) |
Income Above Poverty by Sex and Age in Prosser
According to the poverty statistics in Prosser, males aged under 5 years and females aged 5 years are the age groups that are most secure financially, with 100.0% of males and 100.0% of females in these age groups living above the poverty line.
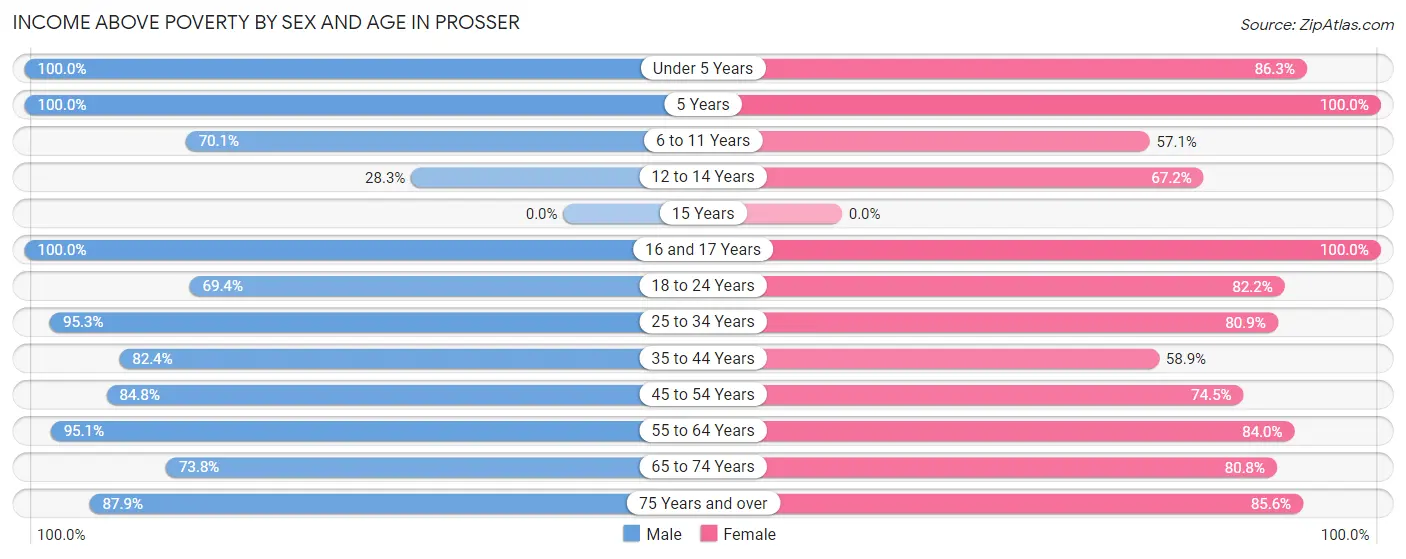
| Age Bracket | Male | Female |
| Under 5 Years | 150 (100.0%) | 214 (86.3%) |
| 5 Years | 89 (100.0%) | 124 (100.0%) |
| 6 to 11 Years | 164 (70.1%) | 156 (57.1%) |
| 12 to 14 Years | 76 (28.2%) | 139 (67.1%) |
| 15 Years | 0 (0.0%) | 0 (0.0%) |
| 16 and 17 Years | 66 (100.0%) | 46 (100.0%) |
| 18 to 24 Years | 163 (69.4%) | 341 (82.2%) |
| 25 to 34 Years | 502 (95.3%) | 338 (80.9%) |
| 35 to 44 Years | 239 (82.4%) | 103 (58.9%) |
| 45 to 54 Years | 329 (84.8%) | 284 (74.5%) |
| 55 to 64 Years | 235 (95.1%) | 189 (84.0%) |
| 65 to 74 Years | 149 (73.8%) | 302 (80.7%) |
| 75 Years and over | 182 (87.9%) | 291 (85.6%) |
| Total | 2,344 (80.7%) | 2,527 (78.3%) |
Income Below Poverty Among Married-Couple Families in Prosser
The poverty statistics for married-couple families in Prosser show that 16.7% or 178 of the total 1,069 families live below the poverty line. Families with 1 or 2 children have the highest poverty rate of 31.5%, comprising of 139 families. On the other hand, families with 3 or 4 children have the lowest poverty rate of 0.0%, which includes 0 families.
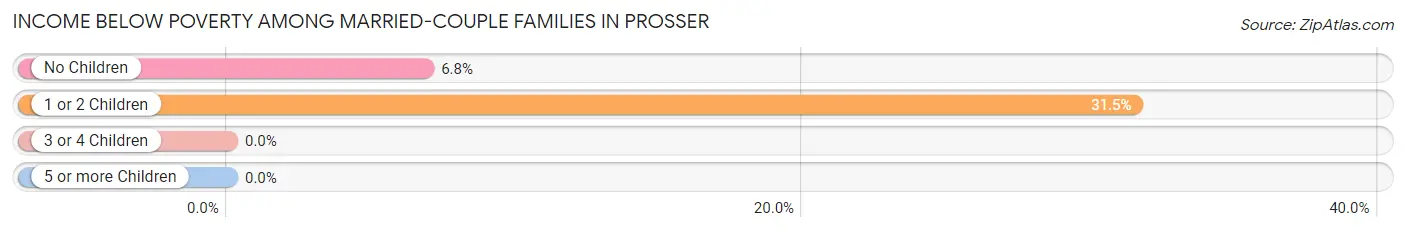
| Children | Above Poverty | Below Poverty |
| No Children | 532 (93.2%) | 39 (6.8%) |
| 1 or 2 Children | 302 (68.5%) | 139 (31.5%) |
| 3 or 4 Children | 57 (100.0%) | 0 (0.0%) |
| 5 or more Children | 0 (0.0%) | 0 (0.0%) |
| Total | 891 (83.4%) | 178 (16.7%) |
Income Below Poverty Among Single-Parent Households in Prosser
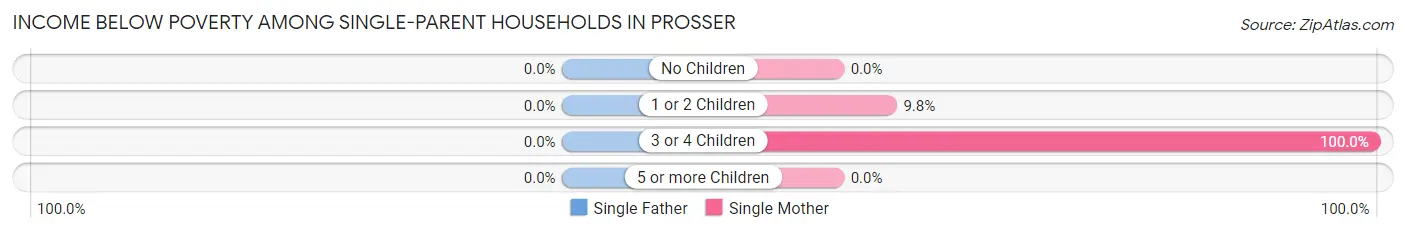
| Children | Single Father | Single Mother |
| No Children | 0 (0.0%) | 0 (0.0%) |
| 1 or 2 Children | 0 (0.0%) | 19 (9.8%) |
| 3 or 4 Children | 0 (0.0%) | 72 (100.0%) |
| 5 or more Children | 0 (0.0%) | 0 (0.0%) |
| Total | 0 (0.0%) | 91 (29.4%) |
Income Below Poverty Among Married-Couple vs Single-Parent Households in Prosser
The poverty data for Prosser shows that 178 of the married-couple family households (16.7%) and 91 of the single-parent households (18.6%) are living below the poverty level. Within the married-couple family households, those with 1 or 2 children have the highest poverty rate, with 139 households (31.5%) falling below the poverty line. Among the single-parent households, those with 3 or 4 children have the highest poverty rate, with 72 household (100.0%) living below poverty.
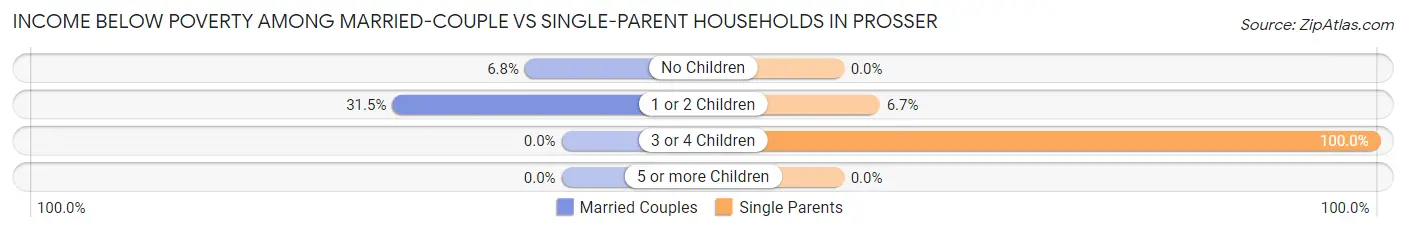
| Children | Married-Couple Families | Single-Parent Households |
| No Children | 39 (6.8%) | 0 (0.0%) |
| 1 or 2 Children | 139 (31.5%) | 19 (6.7%) |
| 3 or 4 Children | 0 (0.0%) | 72 (100.0%) |
| 5 or more Children | 0 (0.0%) | 0 (0.0%) |
| Total | 178 (16.7%) | 91 (18.6%) |
Race in Prosser
The most populous races in Prosser are White / Caucasian (3,905 | 63.6%), Hispanic or Latino (3,270 | 53.3%), and Some other Race (1,231 | 20.1%).
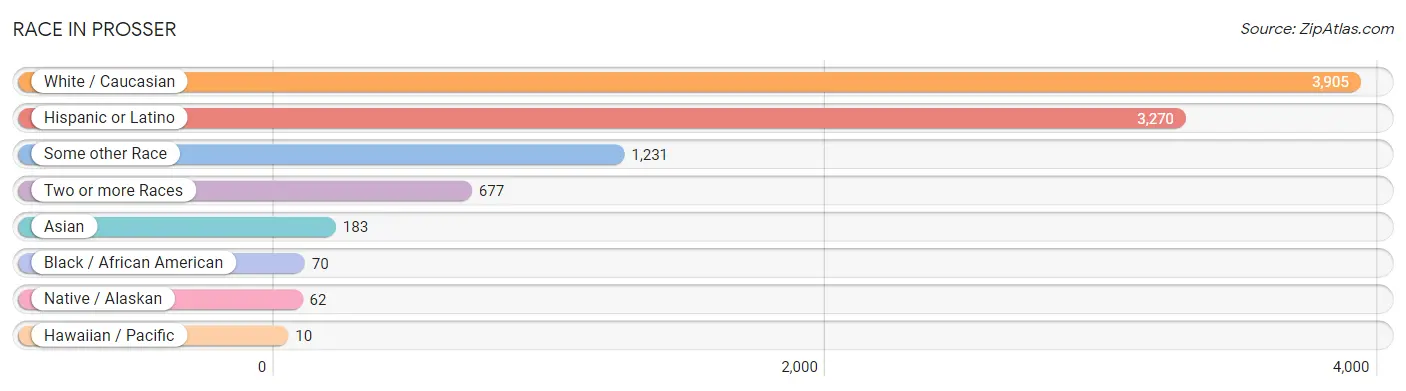
| Race | # Population | % Population |
| Asian | 183 | 3.0% |
| Black / African American | 70 | 1.1% |
| Hawaiian / Pacific | 10 | 0.2% |
| Hispanic or Latino | 3,270 | 53.3% |
| Native / Alaskan | 62 | 1.0% |
| White / Caucasian | 3,905 | 63.6% |
| Two or more Races | 677 | 11.0% |
| Some other Race | 1,231 | 20.1% |
| Total | 6,138 | 100.0% |
Ancestry in Prosser
The most populous ancestries reported in Prosser are Mexican (3,098 | 50.5%), English (857 | 14.0%), German (553 | 9.0%), Irish (546 | 8.9%), and American (205 | 3.3%), together accounting for 85.7% of all Prosser residents.
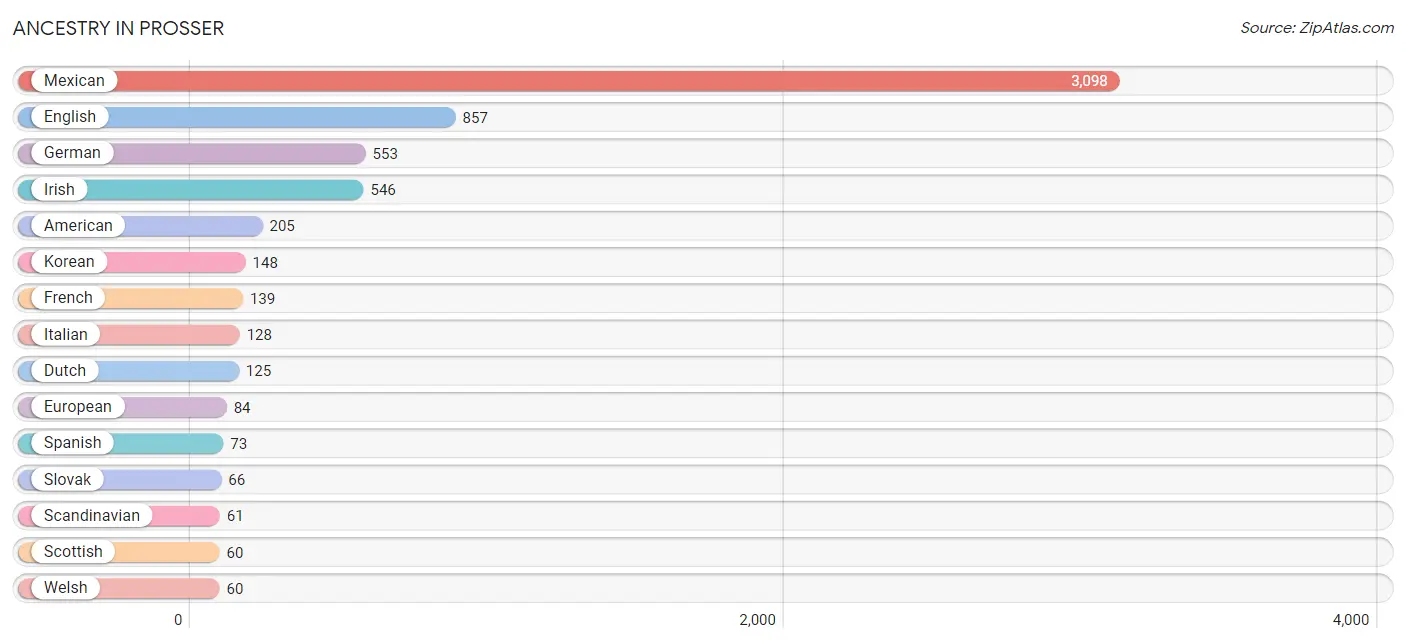
| Ancestry | # Population | % Population |
| American | 205 | 3.3% |
| Belgian | 12 | 0.2% |
| British | 19 | 0.3% |
| Canadian | 39 | 0.6% |
| Central American | 16 | 0.3% |
| Central American Indian | 49 | 0.8% |
| Croatian | 40 | 0.6% |
| Danish | 36 | 0.6% |
| Dutch | 125 | 2.0% |
| English | 857 | 14.0% |
| European | 84 | 1.4% |
| Finnish | 27 | 0.4% |
| French | 139 | 2.3% |
| French Canadian | 23 | 0.4% |
| German | 553 | 9.0% |
| Indian (Asian) | 11 | 0.2% |
| Irish | 546 | 8.9% |
| Italian | 128 | 2.1% |
| Korean | 148 | 2.4% |
| Mexican | 3,098 | 50.5% |
| Mexican American Indian | 58 | 0.9% |
| Norwegian | 50 | 0.8% |
| Polish | 34 | 0.5% |
| Puerto Rican | 11 | 0.2% |
| Russian | 15 | 0.2% |
| Salvadoran | 16 | 0.3% |
| Scandinavian | 61 | 1.0% |
| Scotch-Irish | 36 | 0.6% |
| Scottish | 60 | 1.0% |
| Slovak | 66 | 1.1% |
| Spanish | 73 | 1.2% |
| Swedish | 39 | 0.6% |
| Swiss | 26 | 0.4% |
| Thai | 24 | 0.4% |
| Welsh | 60 | 1.0% | View All 35 Rows |
Immigrants in Prosser
The most numerous immigrant groups reported in Prosser came from Central America (891 | 14.5%), Latin America (891 | 14.5%), Mexico (779 | 12.7%), Asia (118 | 1.9%), and Nicaragua (96 | 1.6%), together accounting for 45.2% of all Prosser residents.
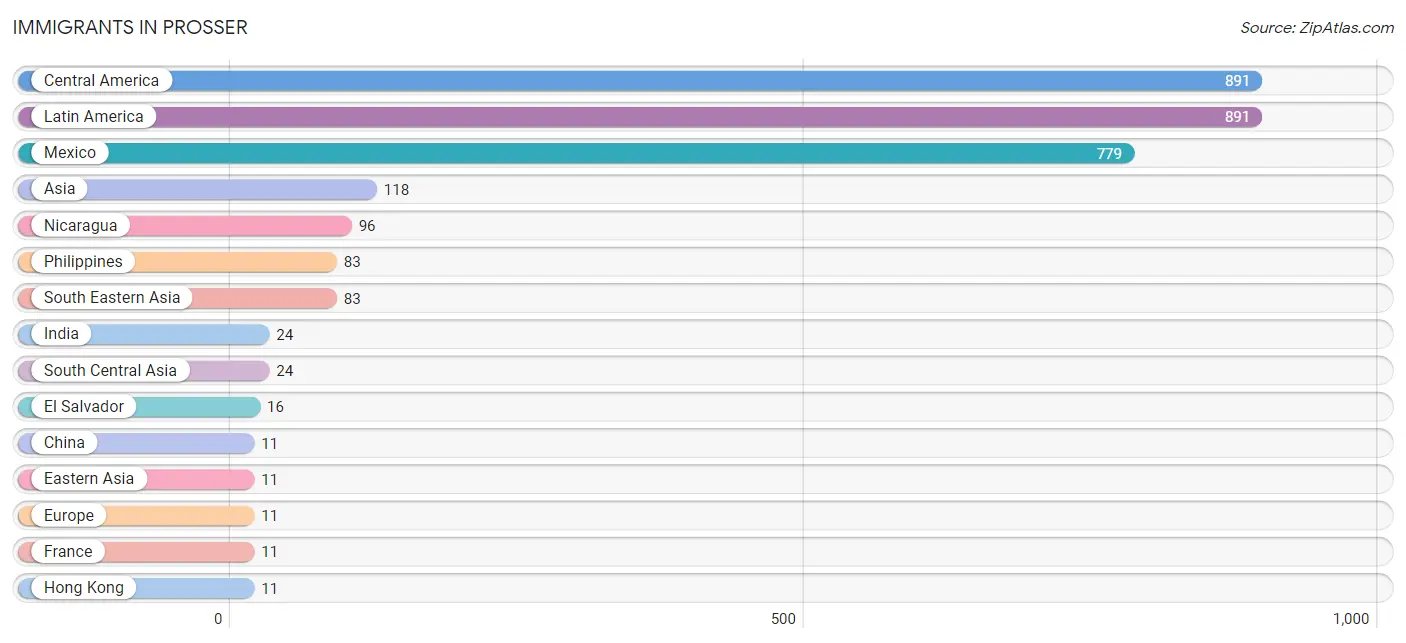
| Immigration Origin | # Population | % Population |
| Asia | 118 | 1.9% |
| Central America | 891 | 14.5% |
| China | 11 | 0.2% |
| Eastern Asia | 11 | 0.2% |
| El Salvador | 16 | 0.3% |
| Europe | 11 | 0.2% |
| France | 11 | 0.2% |
| Hong Kong | 11 | 0.2% |
| India | 24 | 0.4% |
| Latin America | 891 | 14.5% |
| Mexico | 779 | 12.7% |
| Nicaragua | 96 | 1.6% |
| Philippines | 83 | 1.3% |
| South Central Asia | 24 | 0.4% |
| South Eastern Asia | 83 | 1.3% |
| Western Europe | 11 | 0.2% | View All 16 Rows |
Sex and Age in Prosser
Sex and Age in Prosser
The most populous age groups in Prosser are 10 to 14 Years (335 | 11.5%) for men and 20 to 24 Years (415 | 12.8%) for women.
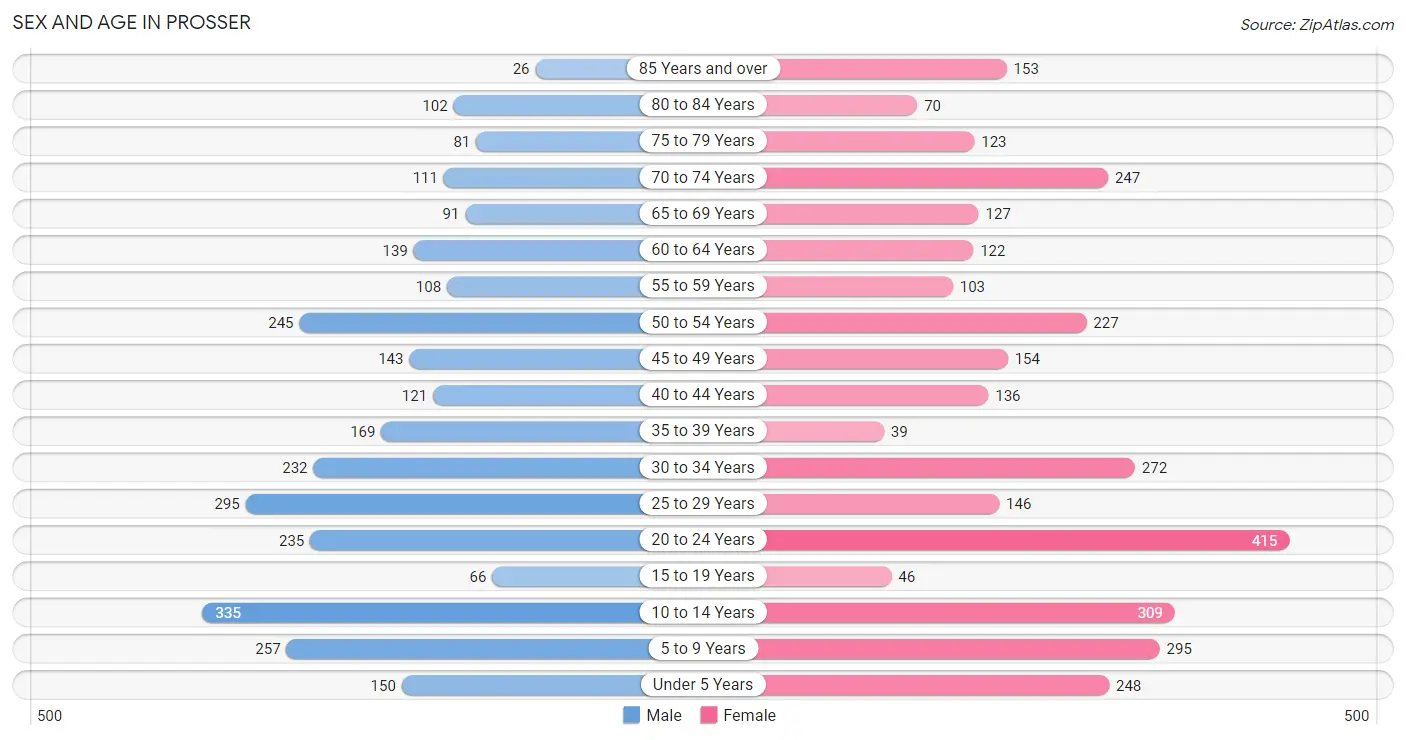
| Age Bracket | Male | Female |
| Under 5 Years | 150 (5.2%) | 248 (7.7%) |
| 5 to 9 Years | 257 (8.8%) | 295 (9.1%) |
| 10 to 14 Years | 335 (11.5%) | 309 (9.6%) |
| 15 to 19 Years | 66 (2.3%) | 46 (1.4%) |
| 20 to 24 Years | 235 (8.1%) | 415 (12.8%) |
| 25 to 29 Years | 295 (10.2%) | 146 (4.5%) |
| 30 to 34 Years | 232 (8.0%) | 272 (8.4%) |
| 35 to 39 Years | 169 (5.8%) | 39 (1.2%) |
| 40 to 44 Years | 121 (4.2%) | 136 (4.2%) |
| 45 to 49 Years | 143 (4.9%) | 154 (4.8%) |
| 50 to 54 Years | 245 (8.4%) | 227 (7.0%) |
| 55 to 59 Years | 108 (3.7%) | 103 (3.2%) |
| 60 to 64 Years | 139 (4.8%) | 122 (3.8%) |
| 65 to 69 Years | 91 (3.1%) | 127 (3.9%) |
| 70 to 74 Years | 111 (3.8%) | 247 (7.6%) |
| 75 to 79 Years | 81 (2.8%) | 123 (3.8%) |
| 80 to 84 Years | 102 (3.5%) | 70 (2.2%) |
| 85 Years and over | 26 (0.9%) | 153 (4.7%) |
| Total | 2,906 (100.0%) | 3,232 (100.0%) |
Families and Households in Prosser
Median Family Size in Prosser
The median family size in Prosser is 3.28 persons per family, with single female/mother families (309 | 19.8%) accounting for the largest median family size of 3.3 persons per family. On the other hand, single male/father families (181 | 11.6%) represent the smallest median family size with 3.17 persons per family.
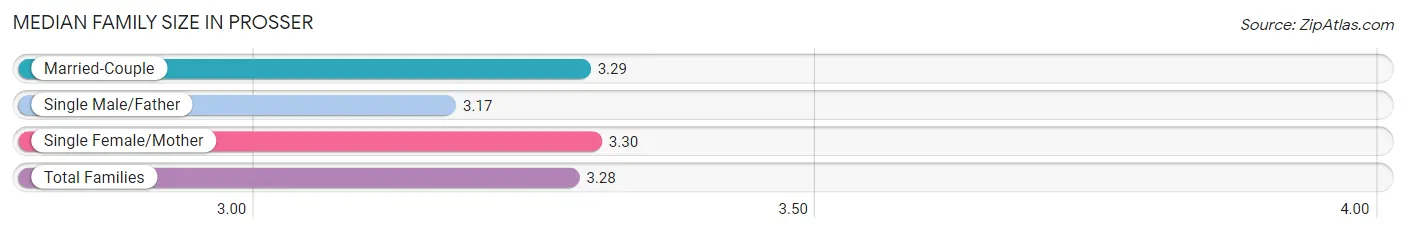
| Family Type | # Families | Family Size |
| Married-Couple | 1,069 (68.6%) | 3.29 |
| Single Male/Father | 181 (11.6%) | 3.17 |
| Single Female/Mother | 309 (19.8%) | 3.30 |
| Total Families | 1,559 (100.0%) | 3.28 |
Median Household Size in Prosser
The median household size in Prosser is 2.72 persons per household, with single male/father households (181 | 8.0%) accounting for the largest median household size of 3.92 persons per household. non-family households (696 | 30.9%) represent the smallest median household size with 1.03 persons per household.

| Household Type | # Households | Household Size |
| Married-Couple | 1,069 (47.4%) | 3.29 |
| Single Male/Father | 181 (8.0%) | 3.92 |
| Single Female/Mother | 309 (13.7%) | 3.85 |
| Non-family | 696 (30.9%) | 1.03 |
| Total Households | 2,255 (100.0%) | 2.72 |
Household Size by Marriage Status in Prosser
Out of a total of 2,255 households in Prosser, 1,559 (69.1%) are family households, while 696 (30.9%) are nonfamily households. The most numerous type of family households are 3-person households, comprising 443, and the most common type of nonfamily households are 1-person households, comprising 678.
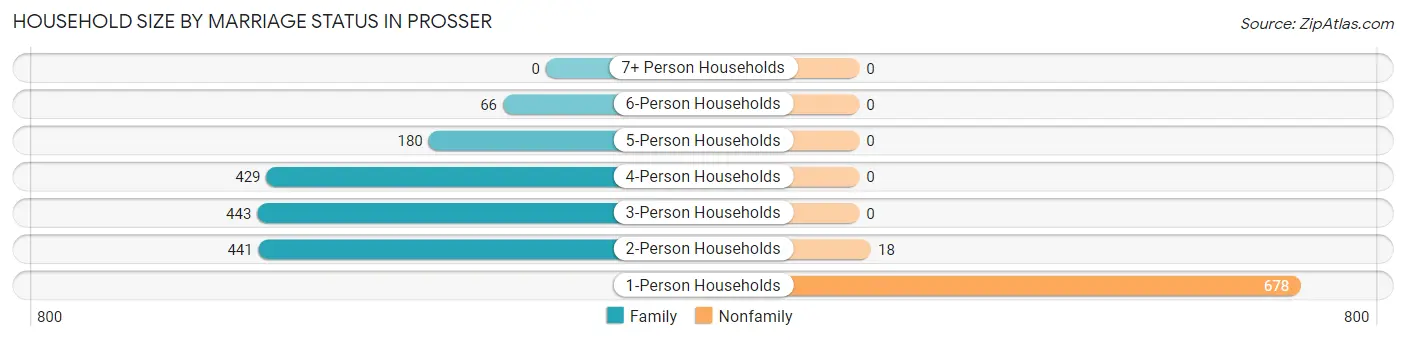
| Household Size | Family Households | Nonfamily Households |
| 1-Person Households | - | 678 (30.1%) |
| 2-Person Households | 441 (19.6%) | 18 (0.8%) |
| 3-Person Households | 443 (19.7%) | 0 (0.0%) |
| 4-Person Households | 429 (19.0%) | 0 (0.0%) |
| 5-Person Households | 180 (8.0%) | 0 (0.0%) |
| 6-Person Households | 66 (2.9%) | 0 (0.0%) |
| 7+ Person Households | 0 (0.0%) | 0 (0.0%) |
| Total | 1,559 (69.1%) | 696 (30.9%) |
Female Fertility in Prosser
Fertility by Age in Prosser
| Age Bracket | Women with Births | Births / 1,000 Women |
| 15 to 19 years | 0 (0.0%) | 0.0 |
| 20 to 34 years | 0 (0.0%) | 0.0 |
| 35 to 50 years | 0 (0.0%) | 0.0 |
| Total | 0 (0.0%) | 0.0 |
Fertility by Age by Marriage Status in Prosser
| Age Bracket | Married | Unmarried |
| 15 to 19 years | 0 (0.0%) | 0 (0.0%) |
| 20 to 34 years | 0 (0.0%) | 0 (0.0%) |
| 35 to 50 years | 0 (0.0%) | 0 (0.0%) |
| Total | 0 (0.0%) | 0 (0.0%) |
Fertility by Education in Prosser
| Educational Attainment | Women with Births | Births / 1,000 Women |
| Less than High School | 0 (0.0%) | 0.0 |
| High School Diploma | 0 (0.0%) | 0.0 |
| College or Associate's Degree | 0 (0.0%) | 0.0 |
| Bachelor's Degree | 0 (0.0%) | 0.0 |
| Graduate Degree | 0 (0.0%) | 0.0 |
| Total | 0 (0.0%) | 0.0 |
Fertility by Education by Marriage Status in Prosser
| Educational Attainment | Married | Unmarried |
| Less than High School | 0 (0.0%) | 0 (0.0%) |
| High School Diploma | 0 (0.0%) | 0 (0.0%) |
| College or Associate's Degree | 0 (0.0%) | 0 (0.0%) |
| Bachelor's Degree | 0 (0.0%) | 0 (0.0%) |
| Graduate Degree | 0 (0.0%) | 0 (0.0%) |
| Total | 0 (0.0%) | 0 (0.0%) |
Employment Characteristics in Prosser
Employment by Class of Employer in Prosser
Among the 2,408 employed individuals in Prosser, private company employees (1,561 | 64.8%), state government employees (313 | 13.0%), and local government employees (236 | 9.8%) make up the most common classes of employment.
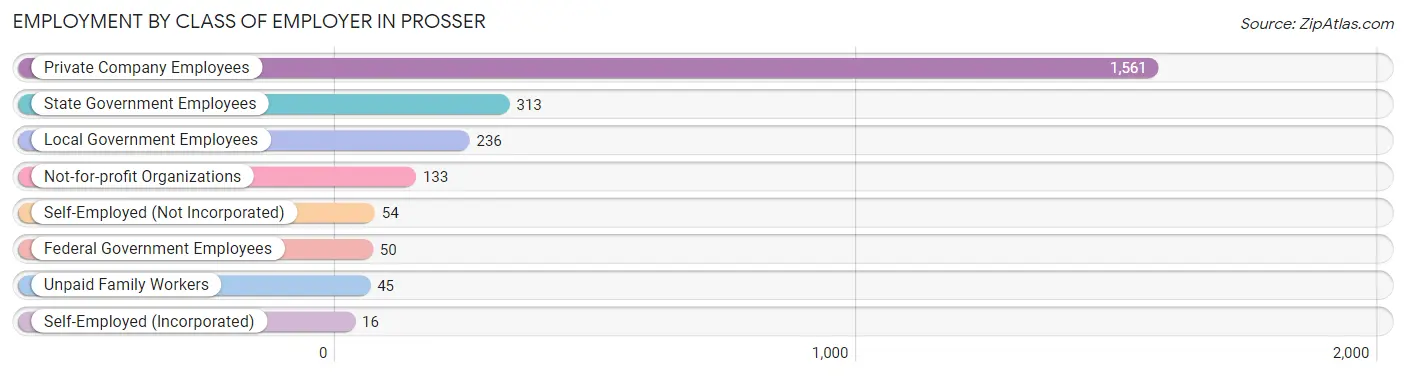
| Employer Class | # Employees | % Employees |
| Private Company Employees | 1,561 | 64.8% |
| Self-Employed (Incorporated) | 16 | 0.7% |
| Self-Employed (Not Incorporated) | 54 | 2.2% |
| Not-for-profit Organizations | 133 | 5.5% |
| Local Government Employees | 236 | 9.8% |
| State Government Employees | 313 | 13.0% |
| Federal Government Employees | 50 | 2.1% |
| Unpaid Family Workers | 45 | 1.9% |
| Total | 2,408 | 100.0% |
Employment Status by Age in Prosser
According to the labor force statistics for Prosser, out of the total population over 16 years of age (4,544), 59.6% or 2,708 individuals are in the labor force, with 10.5% or 284 of them unemployed. The age group with the highest labor force participation rate is 25 to 29 years, with 95.0% or 419 individuals in the labor force. Within the labor force, the 75 years and over age range has the highest percentage of unemployed individuals, with 43.9% or 29 of them being unemployed.
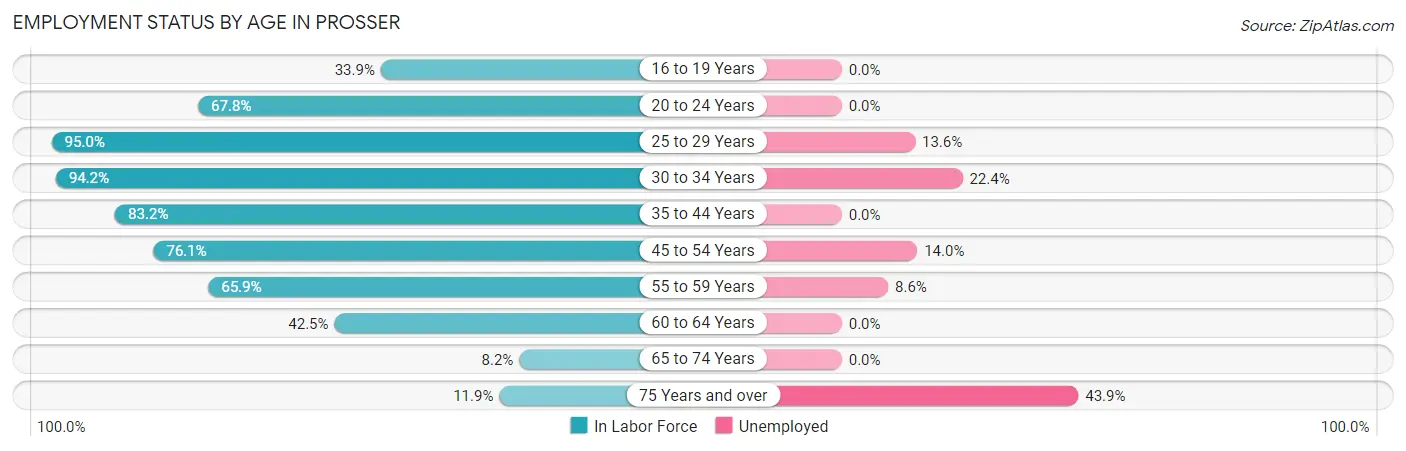
| Age Bracket | In Labor Force | Unemployed |
| 16 to 19 Years | 38 (33.9%) | 0 (0.0%) |
| 20 to 24 Years | 441 (67.8%) | 0 (0.0%) |
| 25 to 29 Years | 419 (95.0%) | 57 (13.6%) |
| 30 to 34 Years | 475 (94.2%) | 106 (22.4%) |
| 35 to 44 Years | 387 (83.2%) | 0 (0.0%) |
| 45 to 54 Years | 585 (76.1%) | 82 (14.0%) |
| 55 to 59 Years | 139 (65.9%) | 12 (8.6%) |
| 60 to 64 Years | 111 (42.5%) | 0 (0.0%) |
| 65 to 74 Years | 47 (8.2%) | 0 (0.0%) |
| 75 Years and over | 66 (11.9%) | 29 (43.9%) |
| Total | 2,708 (59.6%) | 284 (10.5%) |
Employment Status by Educational Attainment in Prosser
According to labor force statistics for Prosser, 79.8% of individuals (2,115) out of the total population between 25 and 64 years of age (2,651) are in the labor force, with 12.0% or 254 of them being unemployed. The group with the highest labor force participation rate are those with the educational attainment of high school diploma, with 94.5% or 583 individuals in the labor force. Within the labor force, individuals with high school diploma education have the highest percentage of unemployment, with 26.4% or 154 of them being unemployed.
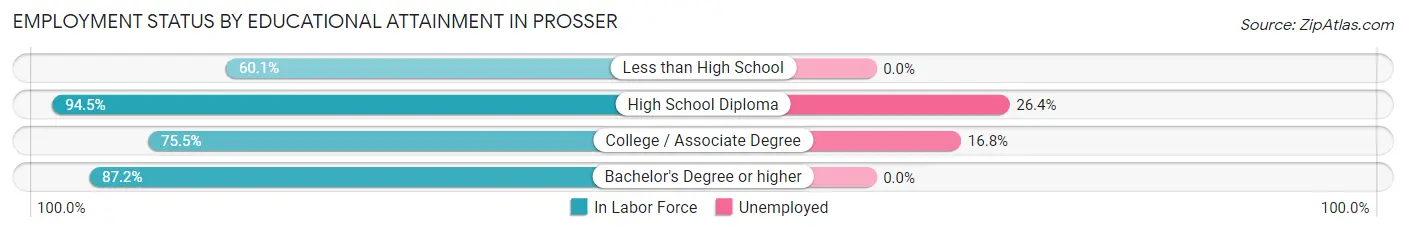
| Educational Attainment | In Labor Force | Unemployed |
| Less than High School | 327 (60.1%) | 0 (0.0%) |
| High School Diploma | 583 (94.5%) | 163 (26.4%) |
| College / Associate Degree | 605 (75.5%) | 135 (16.8%) |
| Bachelor's Degree or higher | 601 (87.2%) | 0 (0.0%) |
| Total | 2,115 (79.8%) | 318 (12.0%) |
Employment Occupations by Sex in Prosser
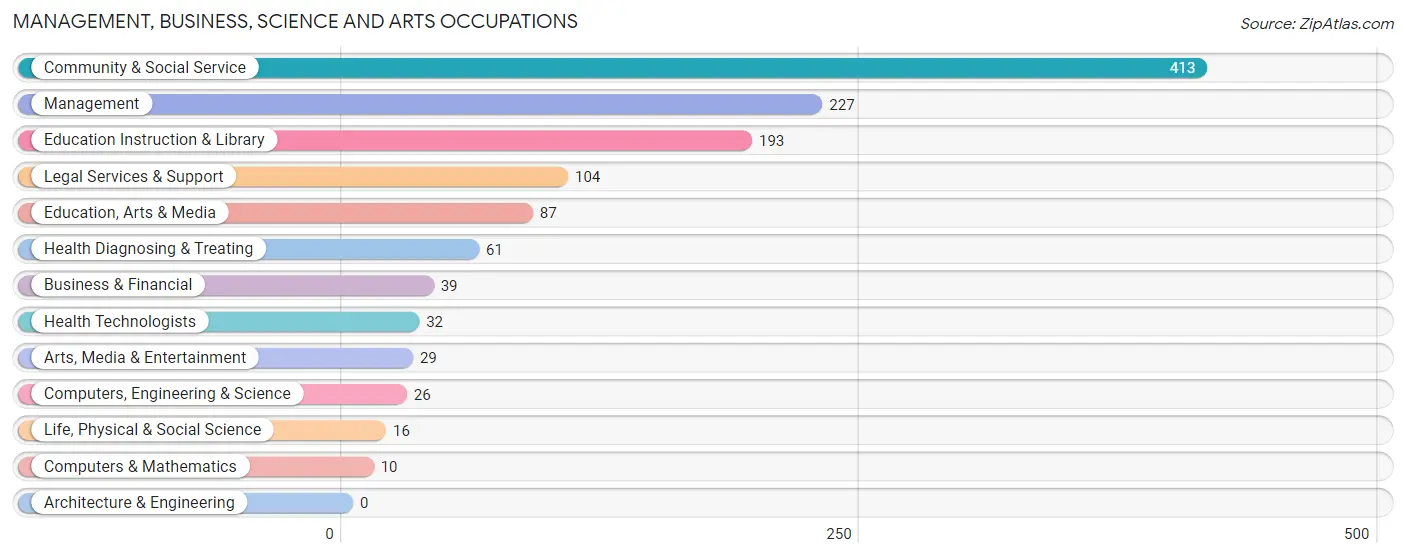
Management, Business, Science and Arts Occupations
The most common Management, Business, Science and Arts occupations in Prosser are Community & Social Service (413 | 17.2%), Management (227 | 9.5%), Education Instruction & Library (193 | 8.1%), Legal Services & Support (104 | 4.3%), and Education, Arts & Media (87 | 3.6%).
Management, Business, Science and Arts Occupations by Sex
Within the Management, Business, Science and Arts occupations in Prosser, the most male-oriented occupations are Computers & Mathematics (100.0%), Arts, Media & Entertainment (100.0%), and Legal Services & Support (92.3%), while the most female-oriented occupations are Business & Financial (100.0%), Education, Arts & Media (100.0%), and Education Instruction & Library (62.2%).
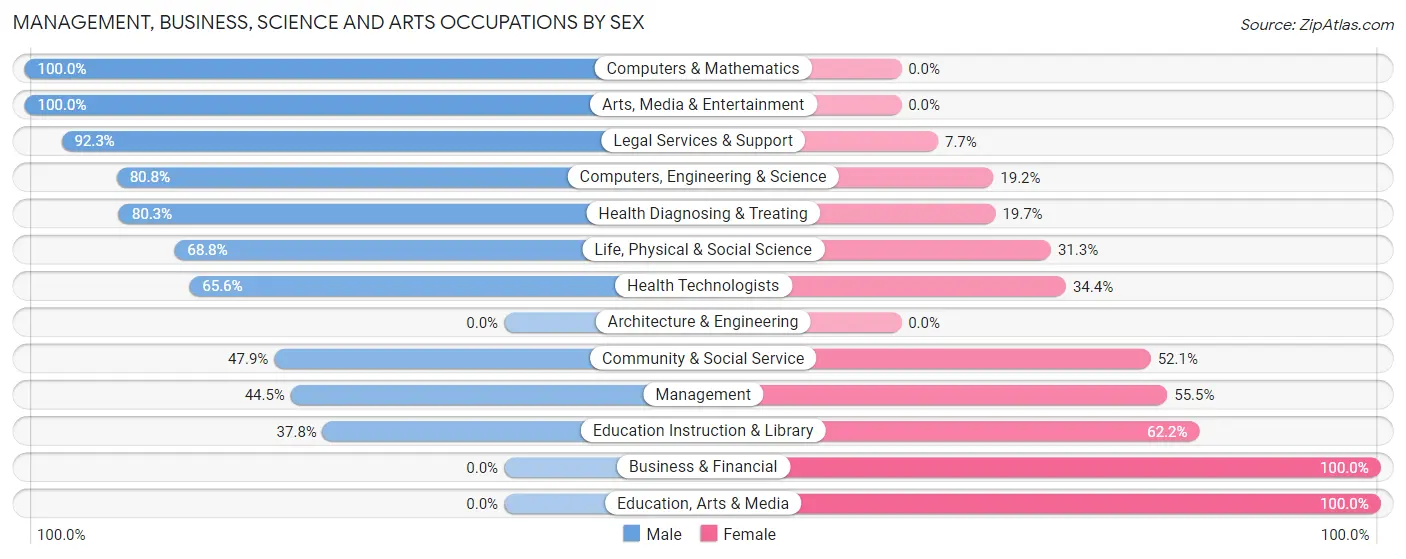
| Occupation | Male | Female |
| Management | 101 (44.5%) | 126 (55.5%) |
| Business & Financial | 0 (0.0%) | 39 (100.0%) |
| Computers, Engineering & Science | 21 (80.8%) | 5 (19.2%) |
| Computers & Mathematics | 10 (100.0%) | 0 (0.0%) |
| Architecture & Engineering | 0 (0.0%) | 0 (0.0%) |
| Life, Physical & Social Science | 11 (68.8%) | 5 (31.2%) |
| Community & Social Service | 198 (47.9%) | 215 (52.1%) |
| Education, Arts & Media | 0 (0.0%) | 87 (100.0%) |
| Legal Services & Support | 96 (92.3%) | 8 (7.7%) |
| Education Instruction & Library | 73 (37.8%) | 120 (62.2%) |
| Arts, Media & Entertainment | 29 (100.0%) | 0 (0.0%) |
| Health Diagnosing & Treating | 49 (80.3%) | 12 (19.7%) |
| Health Technologists | 21 (65.6%) | 11 (34.4%) |
| Total (Category) | 369 (48.2%) | 397 (51.8%) |
| Total (Overall) | 1,236 (51.5%) | 1,163 (48.5%) |
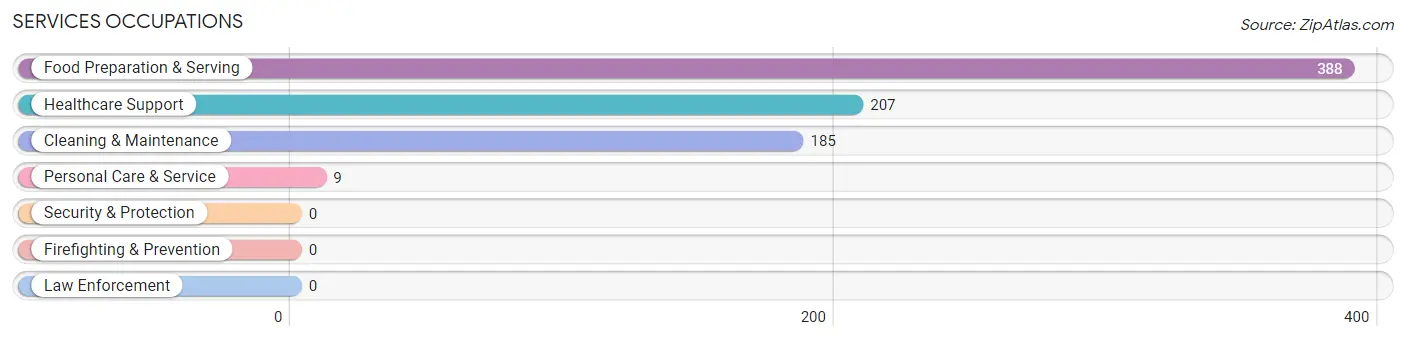
Services Occupations
The most common Services occupations in Prosser are Food Preparation & Serving (388 | 16.2%), Healthcare Support (207 | 8.6%), Cleaning & Maintenance (185 | 7.7%), and Personal Care & Service (9 | 0.4%).
Services Occupations by Sex
Within the Services occupations in Prosser, the most male-oriented occupations are Cleaning & Maintenance (100.0%), and Food Preparation & Serving (36.6%), while the most female-oriented occupations are Healthcare Support (100.0%), Personal Care & Service (100.0%), and Food Preparation & Serving (63.4%).
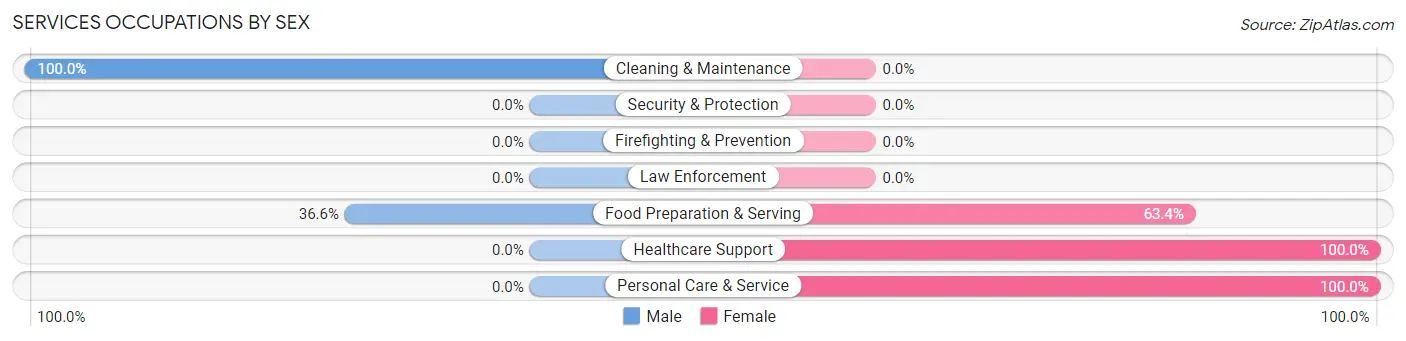
| Occupation | Male | Female |
| Healthcare Support | 0 (0.0%) | 207 (100.0%) |
| Security & Protection | 0 (0.0%) | 0 (0.0%) |
| Firefighting & Prevention | 0 (0.0%) | 0 (0.0%) |
| Law Enforcement | 0 (0.0%) | 0 (0.0%) |
| Food Preparation & Serving | 142 (36.6%) | 246 (63.4%) |
| Cleaning & Maintenance | 185 (100.0%) | 0 (0.0%) |
| Personal Care & Service | 0 (0.0%) | 9 (100.0%) |
| Total (Category) | 327 (41.4%) | 462 (58.6%) |
| Total (Overall) | 1,236 (51.5%) | 1,163 (48.5%) |
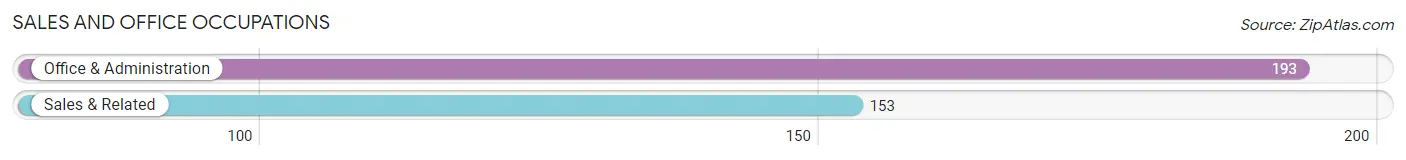
Sales and Office Occupations
The most common Sales and Office occupations in Prosser are Office & Administration (193 | 8.1%), and Sales & Related (153 | 6.4%).
Sales and Office Occupations by Sex
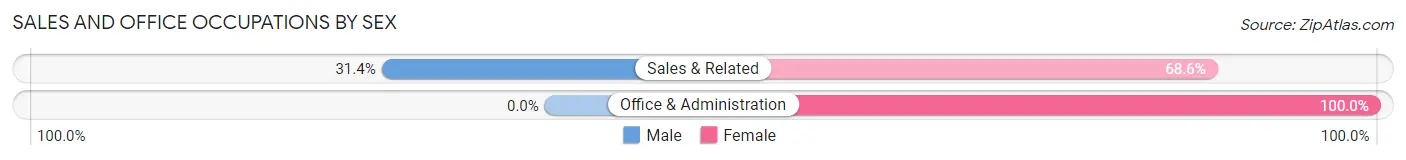
| Occupation | Male | Female |
| Sales & Related | 48 (31.4%) | 105 (68.6%) |
| Office & Administration | 0 (0.0%) | 193 (100.0%) |
| Total (Category) | 48 (13.9%) | 298 (86.1%) |
| Total (Overall) | 1,236 (51.5%) | 1,163 (48.5%) |
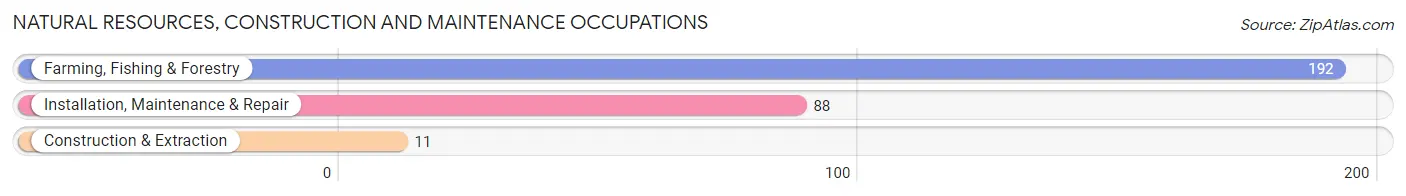
Natural Resources, Construction and Maintenance Occupations
The most common Natural Resources, Construction and Maintenance occupations in Prosser are Farming, Fishing & Forestry (192 | 8.0%), Installation, Maintenance & Repair (88 | 3.7%), and Construction & Extraction (11 | 0.5%).
Natural Resources, Construction and Maintenance Occupations by Sex
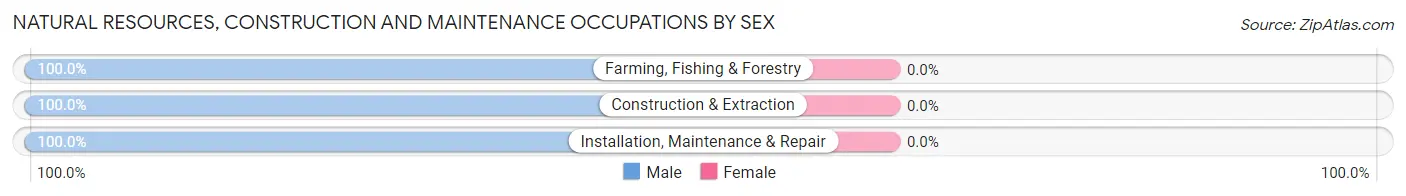
| Occupation | Male | Female |
| Farming, Fishing & Forestry | 192 (100.0%) | 0 (0.0%) |
| Construction & Extraction | 11 (100.0%) | 0 (0.0%) |
| Installation, Maintenance & Repair | 88 (100.0%) | 0 (0.0%) |
| Total (Category) | 291 (100.0%) | 0 (0.0%) |
| Total (Overall) | 1,236 (51.5%) | 1,163 (48.5%) |
Production, Transportation and Moving Occupations
The most common Production, Transportation and Moving occupations in Prosser are Production (117 | 4.9%), and Material Moving (90 | 3.7%).
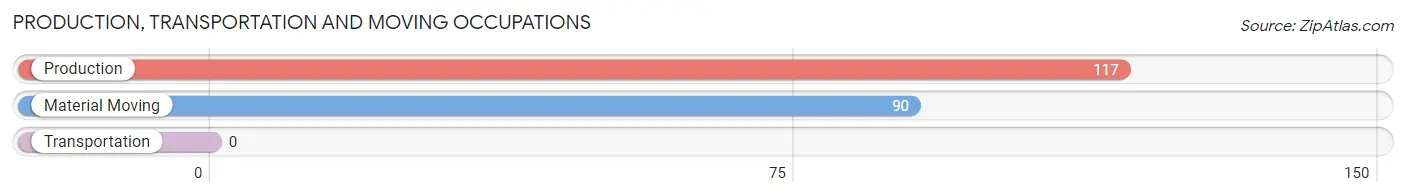
Production, Transportation and Moving Occupations by Sex
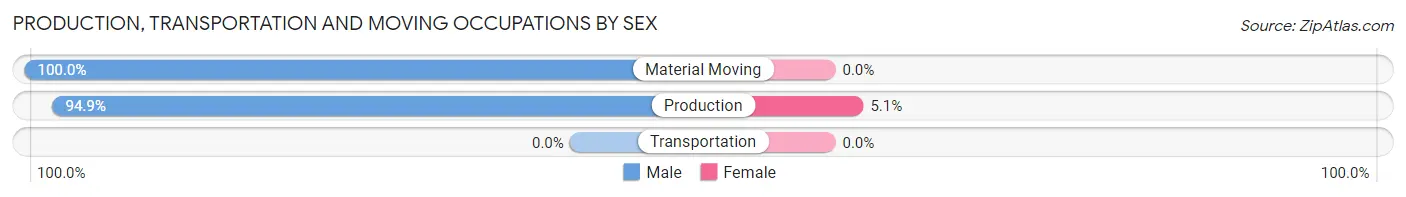
| Occupation | Male | Female |
| Production | 111 (94.9%) | 6 (5.1%) |
| Transportation | 0 (0.0%) | 0 (0.0%) |
| Material Moving | 90 (100.0%) | 0 (0.0%) |
| Total (Category) | 201 (97.1%) | 6 (2.9%) |
| Total (Overall) | 1,236 (51.5%) | 1,163 (48.5%) |
Employment Industries by Sex in Prosser
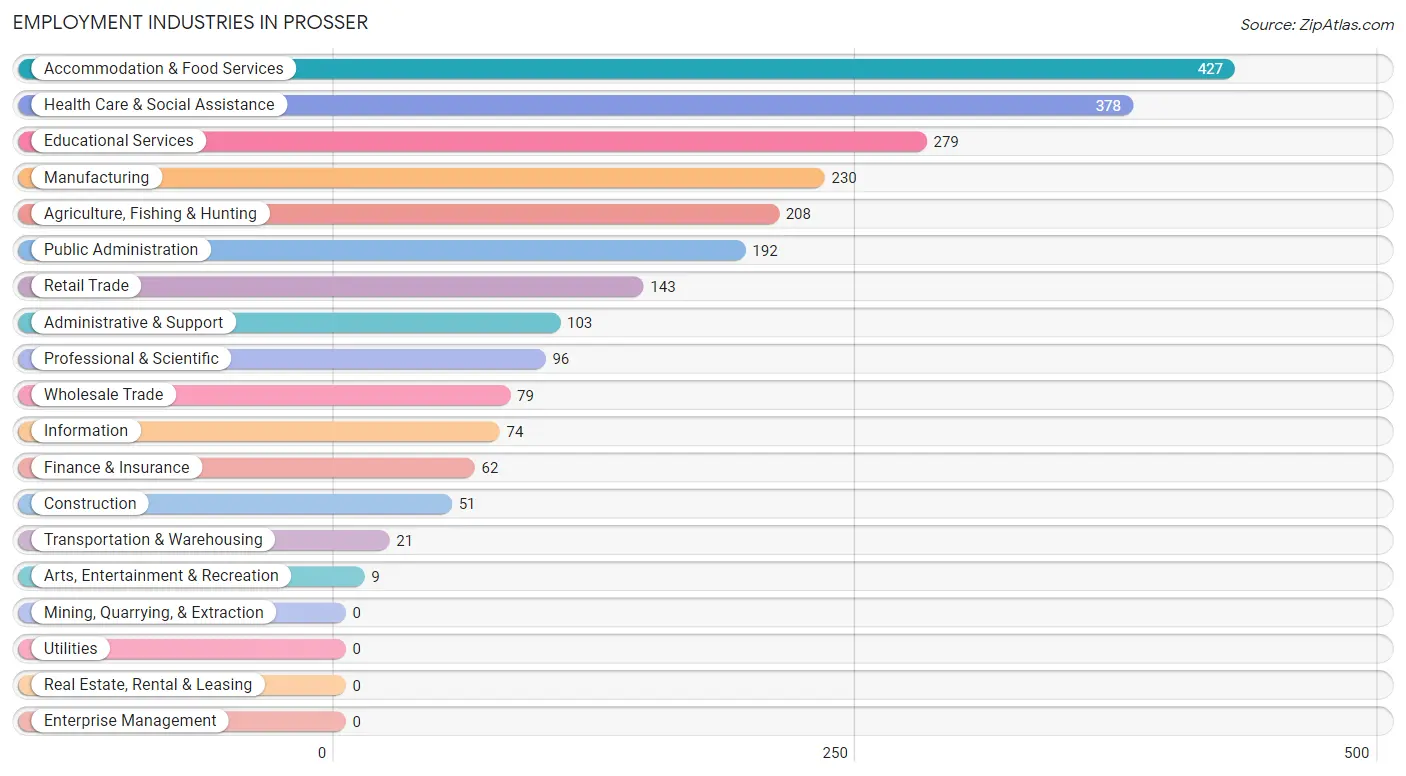
Employment Industries in Prosser
The major employment industries in Prosser include Accommodation & Food Services (427 | 17.8%), Health Care & Social Assistance (378 | 15.8%), Educational Services (279 | 11.6%), Manufacturing (230 | 9.6%), and Agriculture, Fishing & Hunting (208 | 8.7%).
Employment Industries by Sex in Prosser
The Prosser industries that see more men than women are Agriculture, Fishing & Hunting (100.0%), Construction (100.0%), and Information (100.0%), whereas the industries that tend to have a higher number of women are Transportation & Warehousing (100.0%), Arts, Entertainment & Recreation (100.0%), and Public Administration (100.0%).
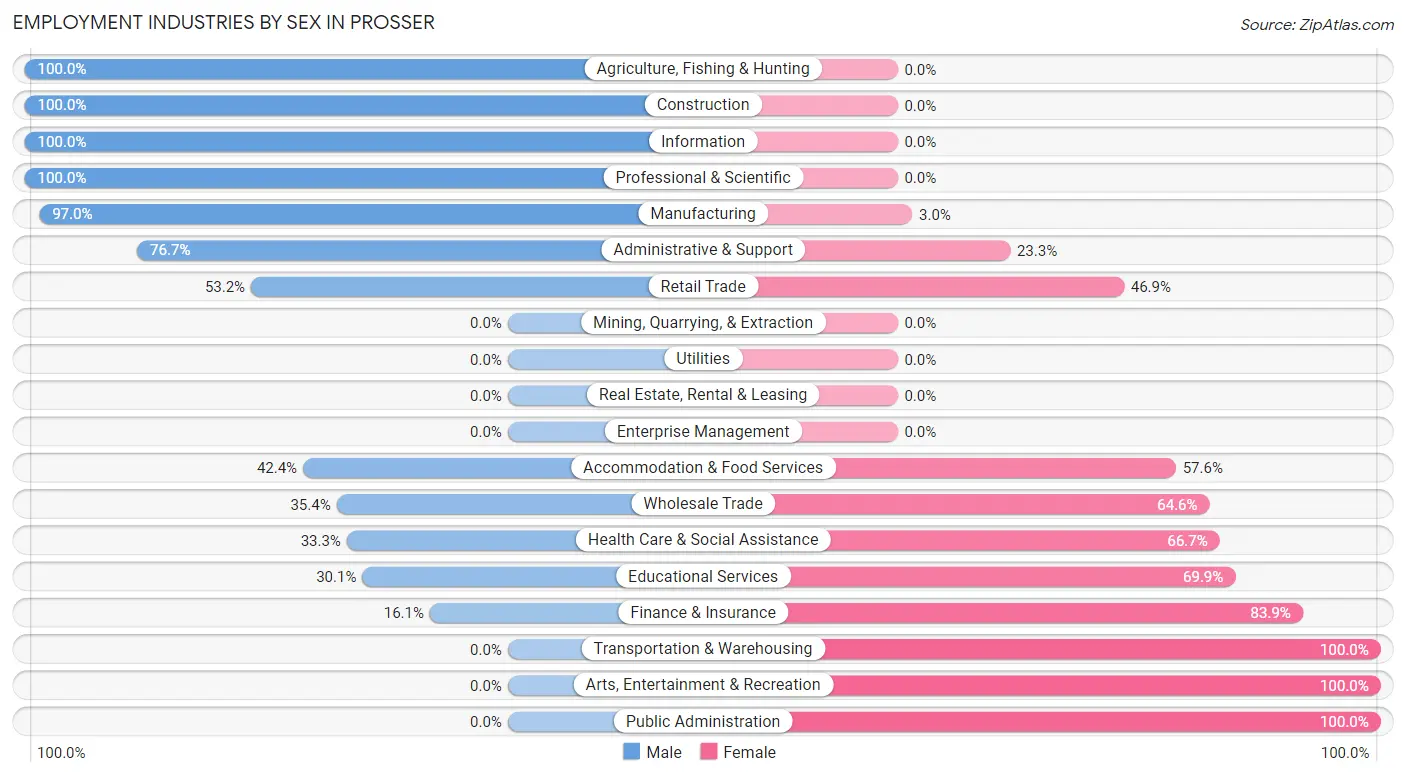
| Industry | Male | Female |
| Agriculture, Fishing & Hunting | 208 (100.0%) | 0 (0.0%) |
| Mining, Quarrying, & Extraction | 0 (0.0%) | 0 (0.0%) |
| Construction | 51 (100.0%) | 0 (0.0%) |
| Manufacturing | 223 (97.0%) | 7 (3.0%) |
| Wholesale Trade | 28 (35.4%) | 51 (64.6%) |
| Retail Trade | 76 (53.1%) | 67 (46.9%) |
| Transportation & Warehousing | 0 (0.0%) | 21 (100.0%) |
| Utilities | 0 (0.0%) | 0 (0.0%) |
| Information | 74 (100.0%) | 0 (0.0%) |
| Finance & Insurance | 10 (16.1%) | 52 (83.9%) |
| Real Estate, Rental & Leasing | 0 (0.0%) | 0 (0.0%) |
| Professional & Scientific | 96 (100.0%) | 0 (0.0%) |
| Enterprise Management | 0 (0.0%) | 0 (0.0%) |
| Administrative & Support | 79 (76.7%) | 24 (23.3%) |
| Educational Services | 84 (30.1%) | 195 (69.9%) |
| Health Care & Social Assistance | 126 (33.3%) | 252 (66.7%) |
| Arts, Entertainment & Recreation | 0 (0.0%) | 9 (100.0%) |
| Accommodation & Food Services | 181 (42.4%) | 246 (57.6%) |
| Public Administration | 0 (0.0%) | 192 (100.0%) |
| Total | 1,236 (51.5%) | 1,163 (48.5%) |
Education in Prosser
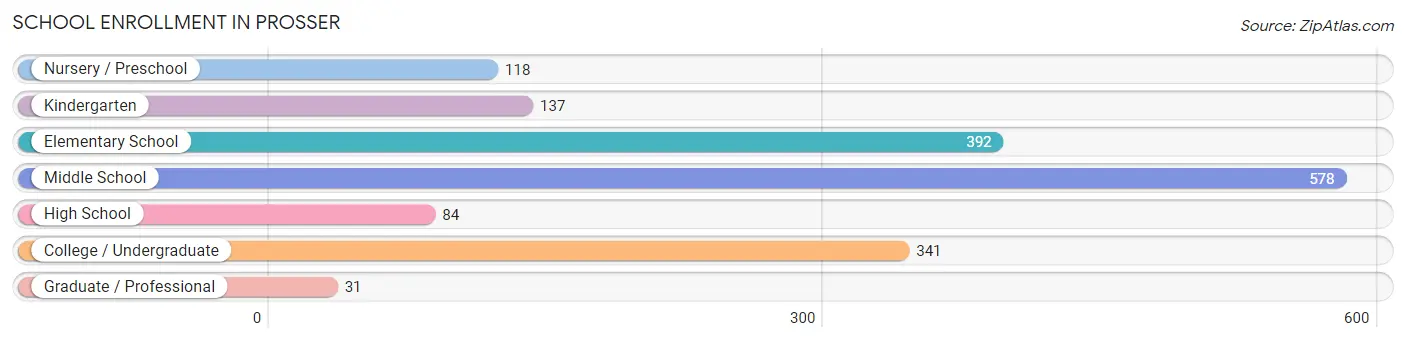
School Enrollment in Prosser
The most common levels of schooling among the 1,681 students in Prosser are middle school (578 | 34.4%), elementary school (392 | 23.3%), and college / undergraduate (341 | 20.3%).
| School Level | # Students | % Students |
| Nursery / Preschool | 118 | 7.0% |
| Kindergarten | 137 | 8.2% |
| Elementary School | 392 | 23.3% |
| Middle School | 578 | 34.4% |
| High School | 84 | 5.0% |
| College / Undergraduate | 341 | 20.3% |
| Graduate / Professional | 31 | 1.8% |
| Total | 1,681 | 100.0% |
School Enrollment by Age by Funding Source in Prosser
Out of a total of 1,681 students who are enrolled in schools in Prosser, 138 (8.2%) attend a private institution, while the remaining 1,543 (91.8%) are enrolled in public schools. The age group of 3 to 4 year olds has the highest likelihood of being enrolled in private schools, with 29 (100.0% in the age bracket) enrolled. Conversely, the age group of 10 to 14 year olds has the lowest likelihood of being enrolled in a private school, with 644 (100.0% in the age bracket) attending a public institution.
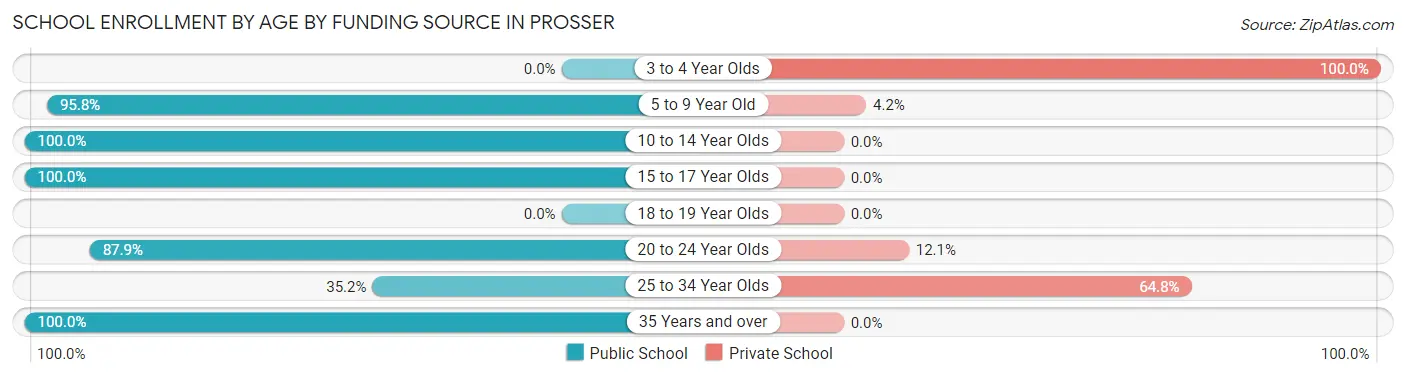
| Age Bracket | Public School | Private School |
| 3 to 4 Year Olds | 0 (0.0%) | 29 (100.0%) |
| 5 to 9 Year Old | 529 (95.8%) | 23 (4.2%) |
| 10 to 14 Year Olds | 644 (100.0%) | 0 (0.0%) |
| 15 to 17 Year Olds | 84 (100.0%) | 0 (0.0%) |
| 18 to 19 Year Olds | 0 (0.0%) | 0 (0.0%) |
| 20 to 24 Year Olds | 210 (87.9%) | 29 (12.1%) |
| 25 to 34 Year Olds | 31 (35.2%) | 57 (64.8%) |
| 35 Years and over | 45 (100.0%) | 0 (0.0%) |
| Total | 1,543 (91.8%) | 138 (8.2%) |
Educational Attainment by Field of Study in Prosser
Education (283 | 28.3%), business (195 | 19.5%), arts & humanities (170 | 17.0%), science & technology (162 | 16.2%), and bio, nature & agricultural (61 | 6.1%) are the most common fields of study among 1,000 individuals in Prosser who have obtained a bachelor's degree or higher.

| Field of Study | # Graduates | % Graduates |
| Computers & Mathematics | 0 | 0.0% |
| Bio, Nature & Agricultural | 61 | 6.1% |
| Physical & Health Sciences | 0 | 0.0% |
| Psychology | 9 | 0.9% |
| Social Sciences | 26 | 2.6% |
| Engineering | 5 | 0.5% |
| Multidisciplinary Studies | 22 | 2.2% |
| Science & Technology | 162 | 16.2% |
| Business | 195 | 19.5% |
| Education | 283 | 28.3% |
| Literature & Languages | 0 | 0.0% |
| Liberal Arts & History | 55 | 5.5% |
| Visual & Performing Arts | 12 | 1.2% |
| Communications | 0 | 0.0% |
| Arts & Humanities | 170 | 17.0% |
| Total | 1,000 | 100.0% |
Transportation & Commute in Prosser
Vehicle Availability by Sex in Prosser
The most prevalent vehicle ownership categories in Prosser are males with 2 vehicles (415, accounting for 34.1%) and females with 2 vehicles (292, making up 34.8%).
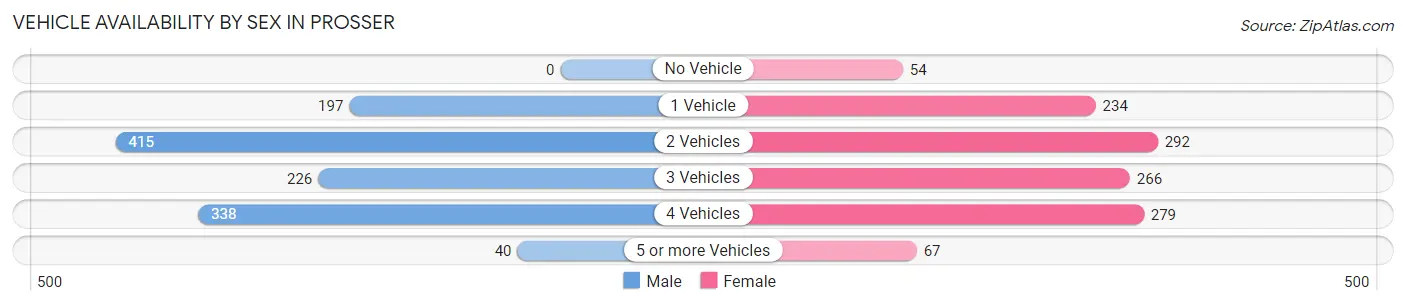
| Vehicles Available | Male | Female |
| No Vehicle | 0 (0.0%) | 54 (4.5%) |
| 1 Vehicle | 197 (16.2%) | 234 (19.6%) |
| 2 Vehicles | 415 (34.1%) | 292 (24.5%) |
| 3 Vehicles | 226 (18.6%) | 266 (22.3%) |
| 4 Vehicles | 338 (27.8%) | 279 (23.4%) |
| 5 or more Vehicles | 40 (3.3%) | 67 (5.6%) |
| Total | 1,216 (100.0%) | 1,192 (100.0%) |
Commute Time in Prosser
The most frequently occuring commute durations in Prosser are 20 to 24 minutes (366 commuters, 16.9%), 10 to 14 minutes (341 commuters, 15.7%), and 5 to 9 minutes (337 commuters, 15.5%).
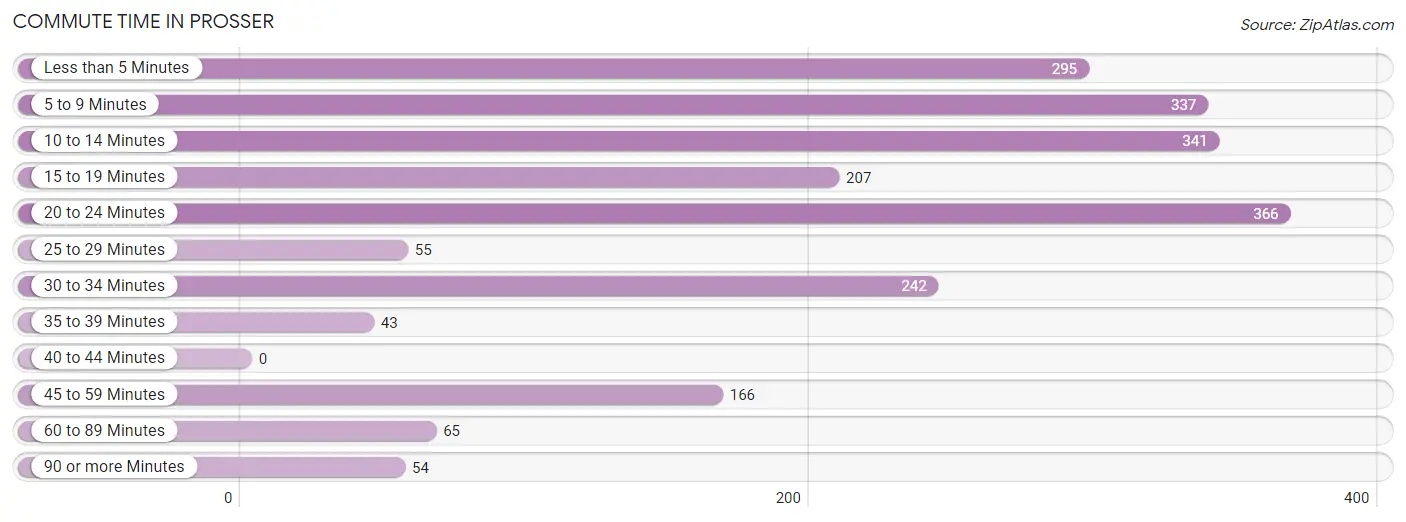
| Commute Time | # Commuters | % Commuters |
| Less than 5 Minutes | 295 | 13.6% |
| 5 to 9 Minutes | 337 | 15.5% |
| 10 to 14 Minutes | 341 | 15.7% |
| 15 to 19 Minutes | 207 | 9.5% |
| 20 to 24 Minutes | 366 | 16.9% |
| 25 to 29 Minutes | 55 | 2.5% |
| 30 to 34 Minutes | 242 | 11.2% |
| 35 to 39 Minutes | 43 | 2.0% |
| 40 to 44 Minutes | 0 | 0.0% |
| 45 to 59 Minutes | 166 | 7.6% |
| 60 to 89 Minutes | 65 | 3.0% |
| 90 or more Minutes | 54 | 2.5% |
Commute Time by Sex in Prosser
The most common commute times in Prosser are 20 to 24 minutes (292 commuters, 24.6%) for males and 10 to 14 minutes (232 commuters, 23.6%) for females.
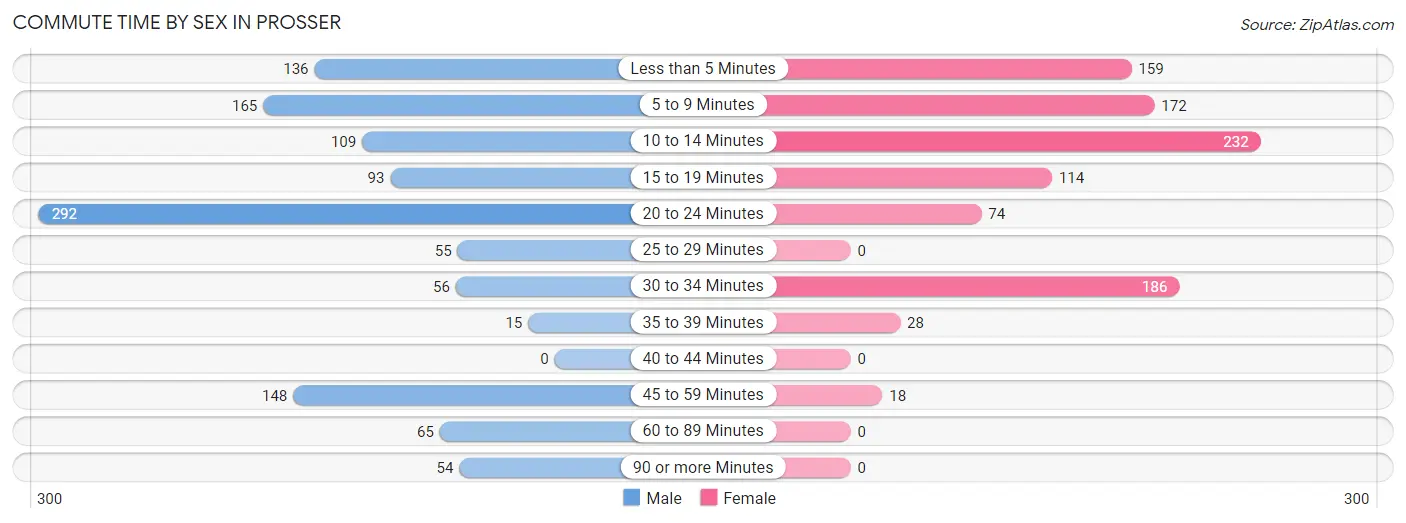
| Commute Time | Male | Female |
| Less than 5 Minutes | 136 (11.5%) | 159 (16.2%) |
| 5 to 9 Minutes | 165 (13.9%) | 172 (17.5%) |
| 10 to 14 Minutes | 109 (9.2%) | 232 (23.6%) |
| 15 to 19 Minutes | 93 (7.8%) | 114 (11.6%) |
| 20 to 24 Minutes | 292 (24.6%) | 74 (7.5%) |
| 25 to 29 Minutes | 55 (4.6%) | 0 (0.0%) |
| 30 to 34 Minutes | 56 (4.7%) | 186 (18.9%) |
| 35 to 39 Minutes | 15 (1.3%) | 28 (2.9%) |
| 40 to 44 Minutes | 0 (0.0%) | 0 (0.0%) |
| 45 to 59 Minutes | 148 (12.5%) | 18 (1.8%) |
| 60 to 89 Minutes | 65 (5.5%) | 0 (0.0%) |
| 90 or more Minutes | 54 (4.5%) | 0 (0.0%) |
Time of Departure to Work by Sex in Prosser
The most frequent times of departure to work in Prosser are 7:00 AM to 7:29 AM (317, 26.7%) for males and 7:00 AM to 7:29 AM (199, 20.2%) for females.
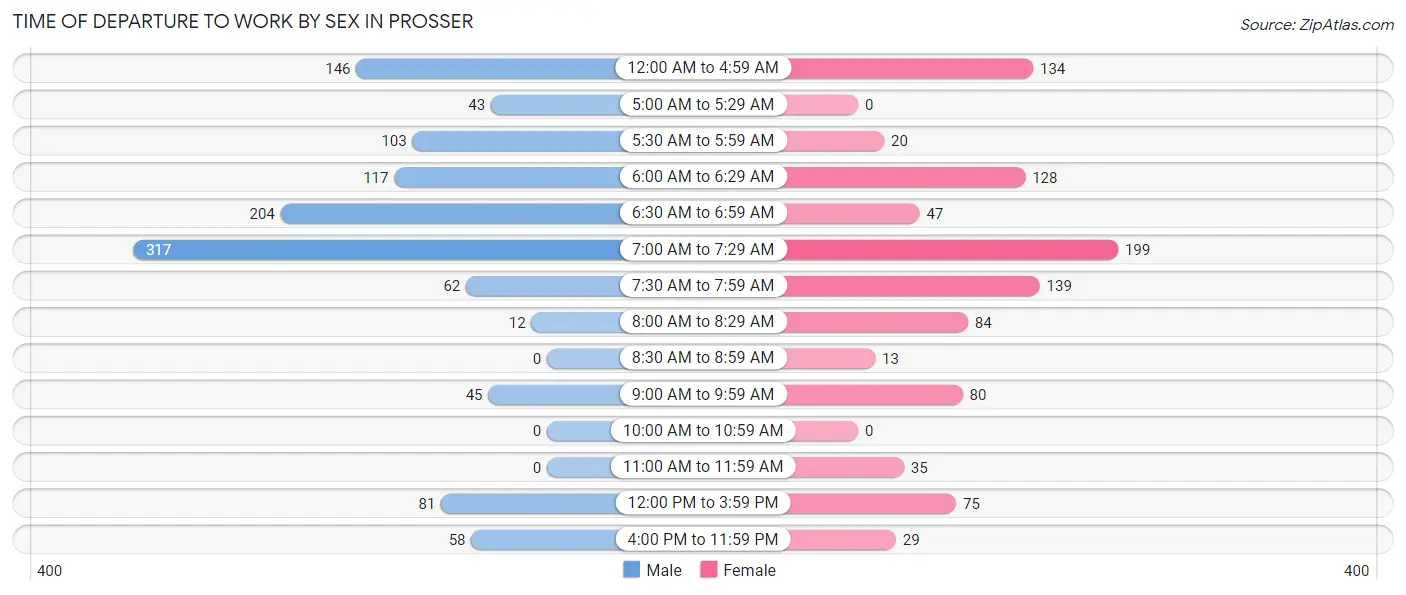
| Time of Departure | Male | Female |
| 12:00 AM to 4:59 AM | 146 (12.3%) | 134 (13.6%) |
| 5:00 AM to 5:29 AM | 43 (3.6%) | 0 (0.0%) |
| 5:30 AM to 5:59 AM | 103 (8.7%) | 20 (2.0%) |
| 6:00 AM to 6:29 AM | 117 (9.9%) | 128 (13.0%) |
| 6:30 AM to 6:59 AM | 204 (17.2%) | 47 (4.8%) |
| 7:00 AM to 7:29 AM | 317 (26.7%) | 199 (20.2%) |
| 7:30 AM to 7:59 AM | 62 (5.2%) | 139 (14.1%) |
| 8:00 AM to 8:29 AM | 12 (1.0%) | 84 (8.6%) |
| 8:30 AM to 8:59 AM | 0 (0.0%) | 13 (1.3%) |
| 9:00 AM to 9:59 AM | 45 (3.8%) | 80 (8.1%) |
| 10:00 AM to 10:59 AM | 0 (0.0%) | 0 (0.0%) |
| 11:00 AM to 11:59 AM | 0 (0.0%) | 35 (3.6%) |
| 12:00 PM to 3:59 PM | 81 (6.8%) | 75 (7.6%) |
| 4:00 PM to 11:59 PM | 58 (4.9%) | 29 (2.9%) |
| Total | 1,188 (100.0%) | 983 (100.0%) |
Housing Occupancy in Prosser
Occupancy by Ownership in Prosser
Of the total 2,255 dwellings in Prosser, owner-occupied units account for 1,247 (55.3%), while renter-occupied units make up 1,008 (44.7%).
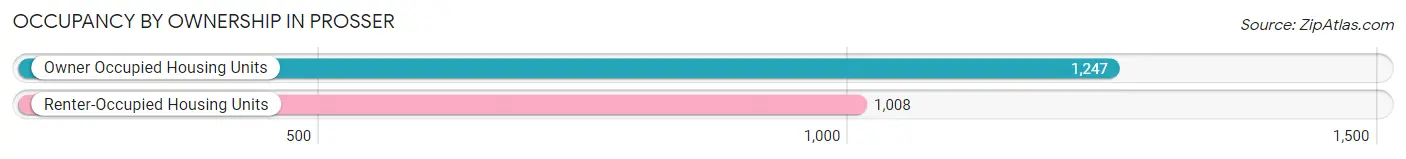
| Occupancy | # Housing Units | % Housing Units |
| Owner Occupied Housing Units | 1,247 | 55.3% |
| Renter-Occupied Housing Units | 1,008 | 44.7% |
| Total Occupied Housing Units | 2,255 | 100.0% |
Occupancy by Household Size in Prosser
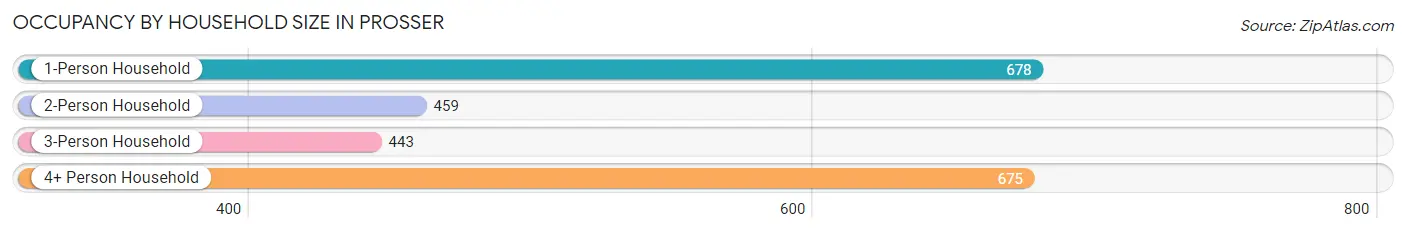
| Household Size | # Housing Units | % Housing Units |
| 1-Person Household | 678 | 30.1% |
| 2-Person Household | 459 | 20.3% |
| 3-Person Household | 443 | 19.7% |
| 4+ Person Household | 675 | 29.9% |
| Total Housing Units | 2,255 | 100.0% |
Occupancy by Ownership by Household Size in Prosser
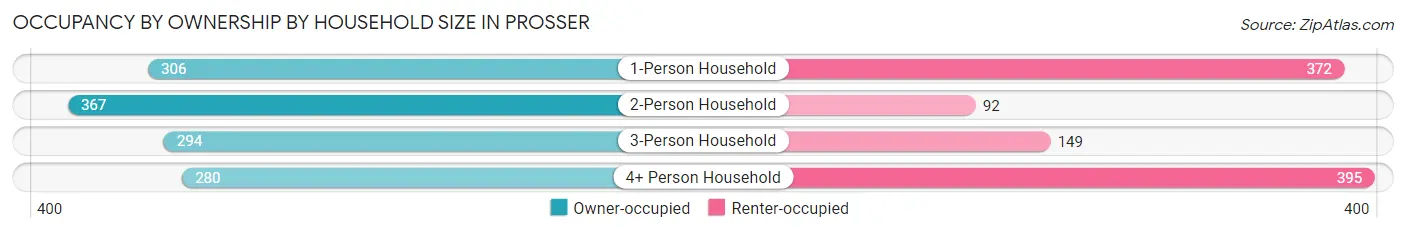
| Household Size | Owner-occupied | Renter-occupied |
| 1-Person Household | 306 (45.1%) | 372 (54.9%) |
| 2-Person Household | 367 (80.0%) | 92 (20.0%) |
| 3-Person Household | 294 (66.4%) | 149 (33.6%) |
| 4+ Person Household | 280 (41.5%) | 395 (58.5%) |
| Total Housing Units | 1,247 (55.3%) | 1,008 (44.7%) |
Occupancy by Educational Attainment in Prosser
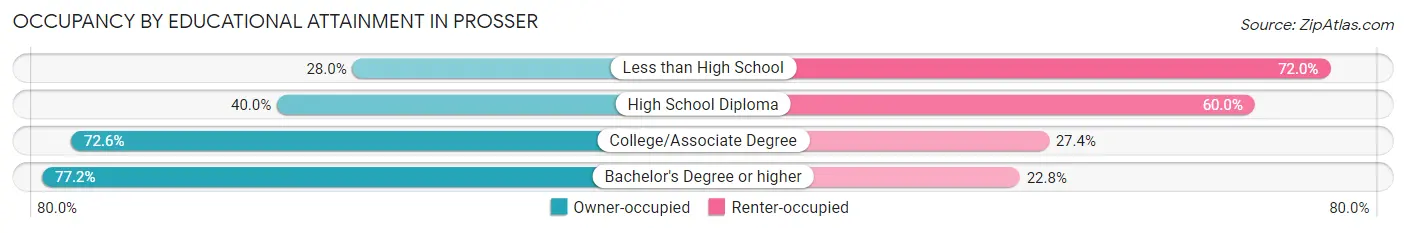
| Household Size | Owner-occupied | Renter-occupied |
| Less than High School | 152 (28.0%) | 391 (72.0%) |
| High School Diploma | 215 (40.0%) | 323 (60.0%) |
| College/Associate Degree | 422 (72.6%) | 159 (27.4%) |
| Bachelor's Degree or higher | 458 (77.2%) | 135 (22.8%) |
Occupancy by Age of Householder in Prosser
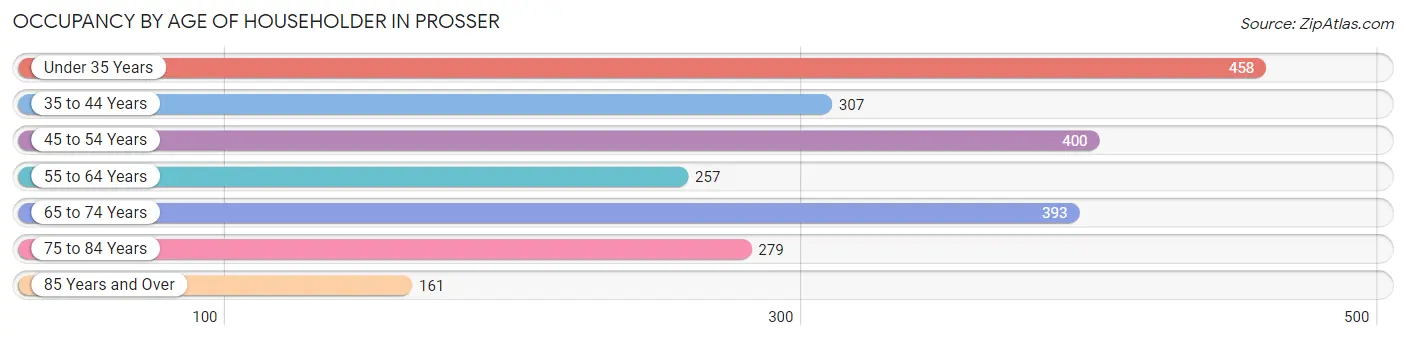
| Age Bracket | # Households | % Households |
| Under 35 Years | 458 | 20.3% |
| 35 to 44 Years | 307 | 13.6% |
| 45 to 54 Years | 400 | 17.7% |
| 55 to 64 Years | 257 | 11.4% |
| 65 to 74 Years | 393 | 17.4% |
| 75 to 84 Years | 279 | 12.4% |
| 85 Years and Over | 161 | 7.1% |
| Total | 2,255 | 100.0% |
Housing Finances in Prosser
Median Income by Occupancy in Prosser
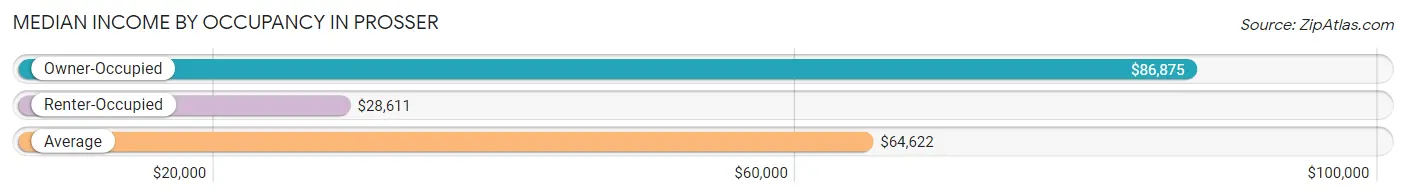
| Occupancy Type | # Households | Median Income |
| Owner-Occupied | 1,247 (55.3%) | $86,875 |
| Renter-Occupied | 1,008 (44.7%) | $28,611 |
| Average | 2,255 (100.0%) | $64,622 |
Occupancy by Householder Income Bracket in Prosser
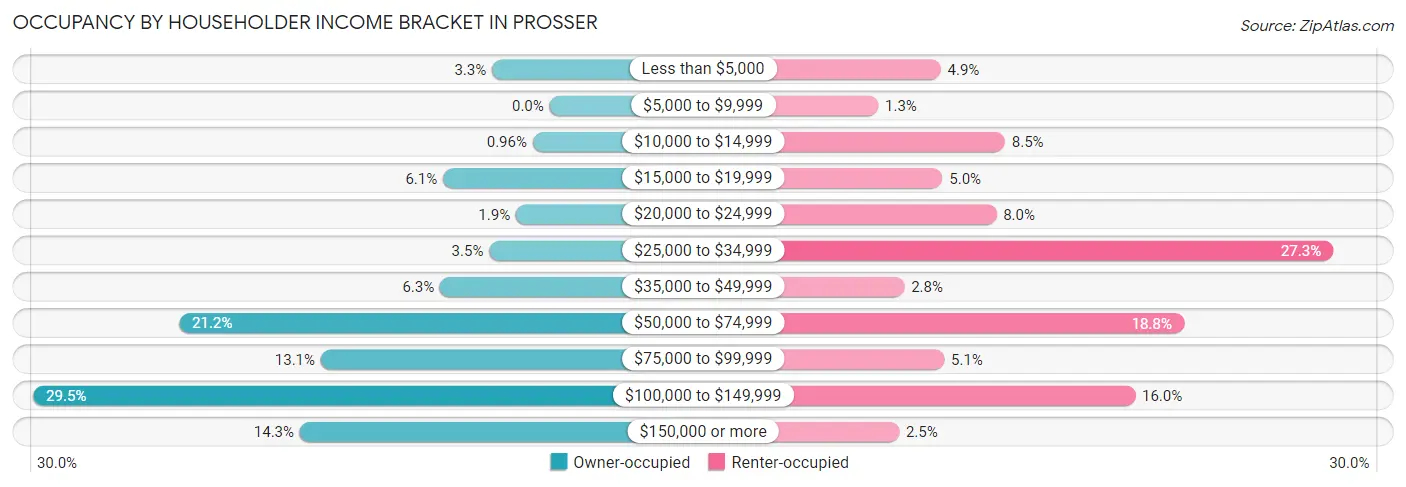
| Income Bracket | Owner-occupied | Renter-occupied |
| Less than $5,000 | 41 (3.3%) | 49 (4.9%) |
| $5,000 to $9,999 | 0 (0.0%) | 13 (1.3%) |
| $10,000 to $14,999 | 12 (1.0%) | 86 (8.5%) |
| $15,000 to $19,999 | 76 (6.1%) | 50 (5.0%) |
| $20,000 to $24,999 | 24 (1.9%) | 81 (8.0%) |
| $25,000 to $34,999 | 43 (3.5%) | 275 (27.3%) |
| $35,000 to $49,999 | 78 (6.3%) | 28 (2.8%) |
| $50,000 to $74,999 | 264 (21.2%) | 189 (18.8%) |
| $75,000 to $99,999 | 163 (13.1%) | 51 (5.1%) |
| $100,000 to $149,999 | 368 (29.5%) | 161 (16.0%) |
| $150,000 or more | 178 (14.3%) | 25 (2.5%) |
| Total | 1,247 (100.0%) | 1,008 (100.0%) |
Monthly Housing Cost Tiers in Prosser
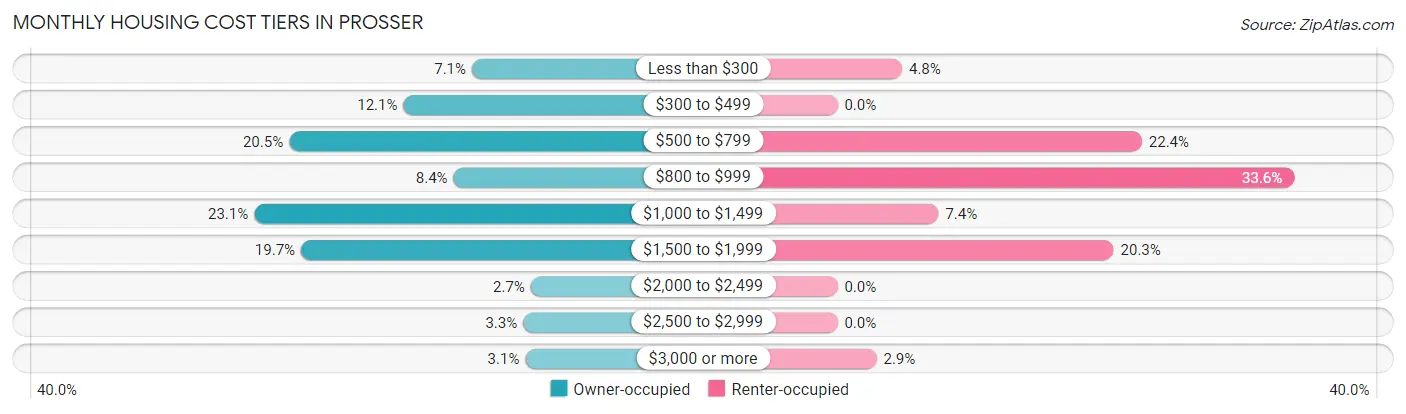
| Monthly Cost | Owner-occupied | Renter-occupied |
| Less than $300 | 88 (7.1%) | 48 (4.8%) |
| $300 to $499 | 151 (12.1%) | 0 (0.0%) |
| $500 to $799 | 256 (20.5%) | 226 (22.4%) |
| $800 to $999 | 105 (8.4%) | 339 (33.6%) |
| $1,000 to $1,499 | 288 (23.1%) | 75 (7.4%) |
| $1,500 to $1,999 | 245 (19.7%) | 205 (20.3%) |
| $2,000 to $2,499 | 34 (2.7%) | 0 (0.0%) |
| $2,500 to $2,999 | 41 (3.3%) | 0 (0.0%) |
| $3,000 or more | 39 (3.1%) | 29 (2.9%) |
| Total | 1,247 (100.0%) | 1,008 (100.0%) |
Physical Housing Characteristics in Prosser
Housing Structures in Prosser
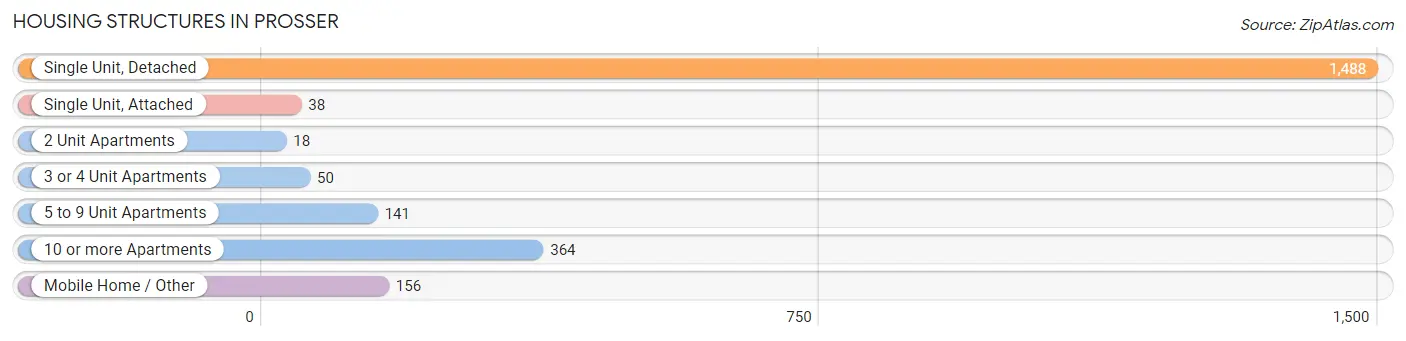
| Structure Type | # Housing Units | % Housing Units |
| Single Unit, Detached | 1,488 | 66.0% |
| Single Unit, Attached | 38 | 1.7% |
| 2 Unit Apartments | 18 | 0.8% |
| 3 or 4 Unit Apartments | 50 | 2.2% |
| 5 to 9 Unit Apartments | 141 | 6.2% |
| 10 or more Apartments | 364 | 16.1% |
| Mobile Home / Other | 156 | 6.9% |
| Total | 2,255 | 100.0% |
Housing Structures by Occupancy in Prosser
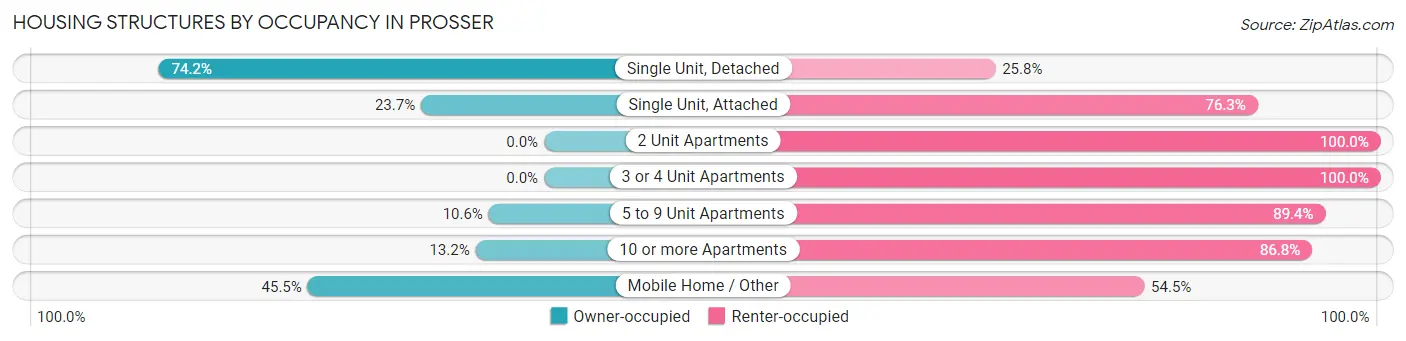
| Structure Type | Owner-occupied | Renter-occupied |
| Single Unit, Detached | 1,104 (74.2%) | 384 (25.8%) |
| Single Unit, Attached | 9 (23.7%) | 29 (76.3%) |
| 2 Unit Apartments | 0 (0.0%) | 18 (100.0%) |
| 3 or 4 Unit Apartments | 0 (0.0%) | 50 (100.0%) |
| 5 to 9 Unit Apartments | 15 (10.6%) | 126 (89.4%) |
| 10 or more Apartments | 48 (13.2%) | 316 (86.8%) |
| Mobile Home / Other | 71 (45.5%) | 85 (54.5%) |
| Total | 1,247 (55.3%) | 1,008 (44.7%) |
Housing Structures by Number of Rooms in Prosser
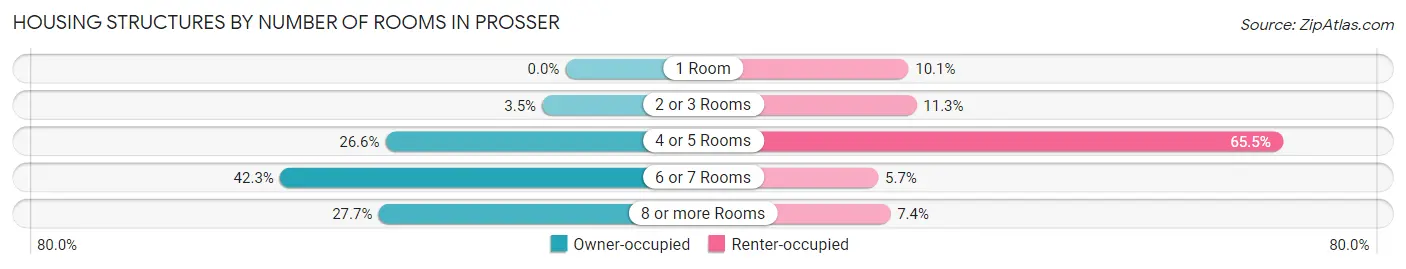
| Number of Rooms | Owner-occupied | Renter-occupied |
| 1 Room | 0 (0.0%) | 102 (10.1%) |
| 2 or 3 Rooms | 43 (3.5%) | 114 (11.3%) |
| 4 or 5 Rooms | 332 (26.6%) | 660 (65.5%) |
| 6 or 7 Rooms | 527 (42.3%) | 57 (5.7%) |
| 8 or more Rooms | 345 (27.7%) | 75 (7.4%) |
| Total | 1,247 (100.0%) | 1,008 (100.0%) |
Housing Structure by Heating Type in Prosser
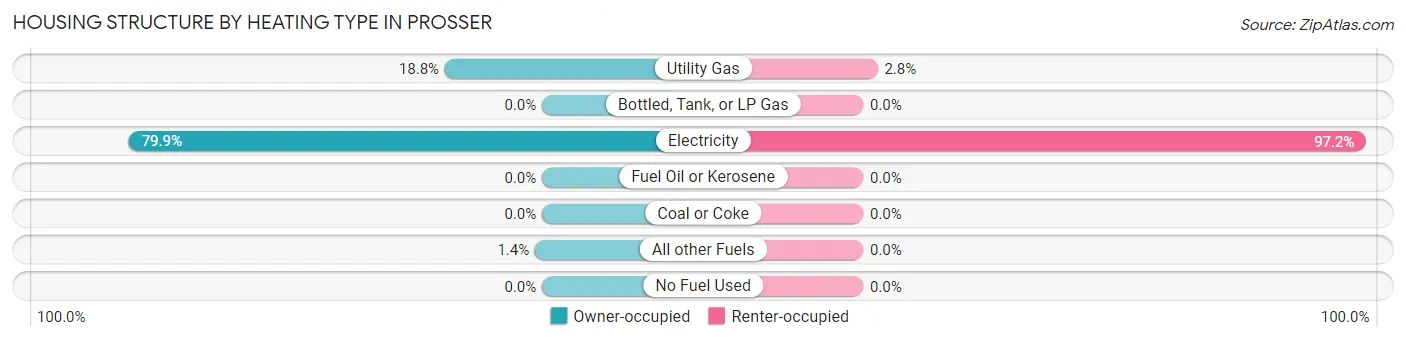
| Heating Type | Owner-occupied | Renter-occupied |
| Utility Gas | 234 (18.8%) | 28 (2.8%) |
| Bottled, Tank, or LP Gas | 0 (0.0%) | 0 (0.0%) |
| Electricity | 996 (79.9%) | 980 (97.2%) |
| Fuel Oil or Kerosene | 0 (0.0%) | 0 (0.0%) |
| Coal or Coke | 0 (0.0%) | 0 (0.0%) |
| All other Fuels | 17 (1.4%) | 0 (0.0%) |
| No Fuel Used | 0 (0.0%) | 0 (0.0%) |
| Total | 1,247 (100.0%) | 1,008 (100.0%) |
Household Vehicle Usage in Prosser
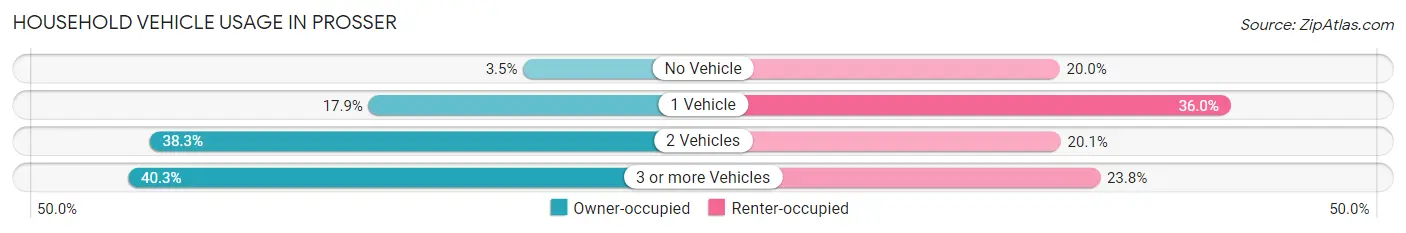
| Vehicles per Household | Owner-occupied | Renter-occupied |
| No Vehicle | 43 (3.5%) | 202 (20.0%) |
| 1 Vehicle | 223 (17.9%) | 363 (36.0%) |
| 2 Vehicles | 478 (38.3%) | 203 (20.1%) |
| 3 or more Vehicles | 503 (40.3%) | 240 (23.8%) |
| Total | 1,247 (100.0%) | 1,008 (100.0%) |
Real Estate & Mortgages in Prosser
Real Estate and Mortgage Overview in Prosser
| Characteristic | Without Mortgage | With Mortgage |
| Housing Units | 470 | 777 |
| Median Property Value | $255,200 | $248,200 |
| Median Household Income | $77,969 | $114 |
| Monthly Housing Costs | $518 | $39 |
| Real Estate Taxes | $2,242 | $0 |
Property Value by Mortgage Status in Prosser
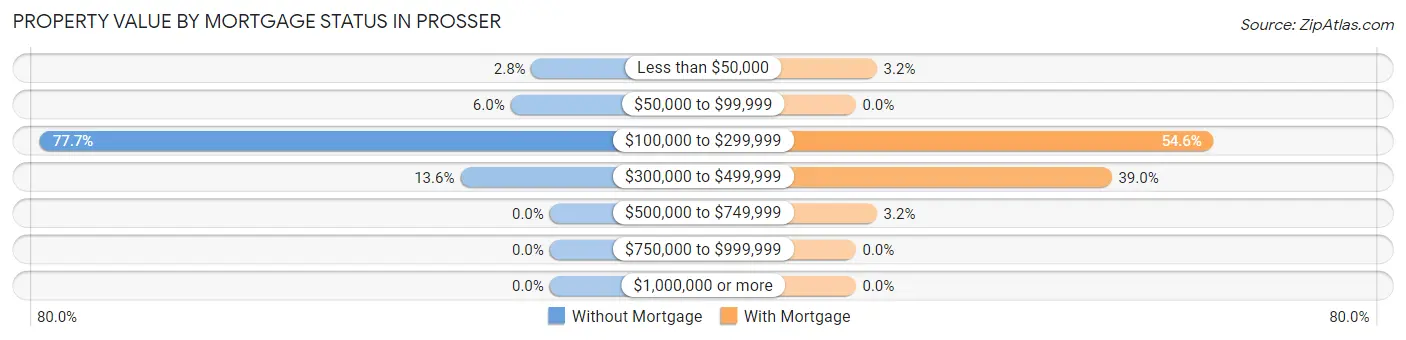
| Property Value | Without Mortgage | With Mortgage |
| Less than $50,000 | 13 (2.8%) | 25 (3.2%) |
| $50,000 to $99,999 | 28 (6.0%) | 0 (0.0%) |
| $100,000 to $299,999 | 365 (77.7%) | 424 (54.6%) |
| $300,000 to $499,999 | 64 (13.6%) | 303 (39.0%) |
| $500,000 to $749,999 | 0 (0.0%) | 25 (3.2%) |
| $750,000 to $999,999 | 0 (0.0%) | 0 (0.0%) |
| $1,000,000 or more | 0 (0.0%) | 0 (0.0%) |
| Total | 470 (100.0%) | 777 (100.0%) |
Household Income by Mortgage Status in Prosser
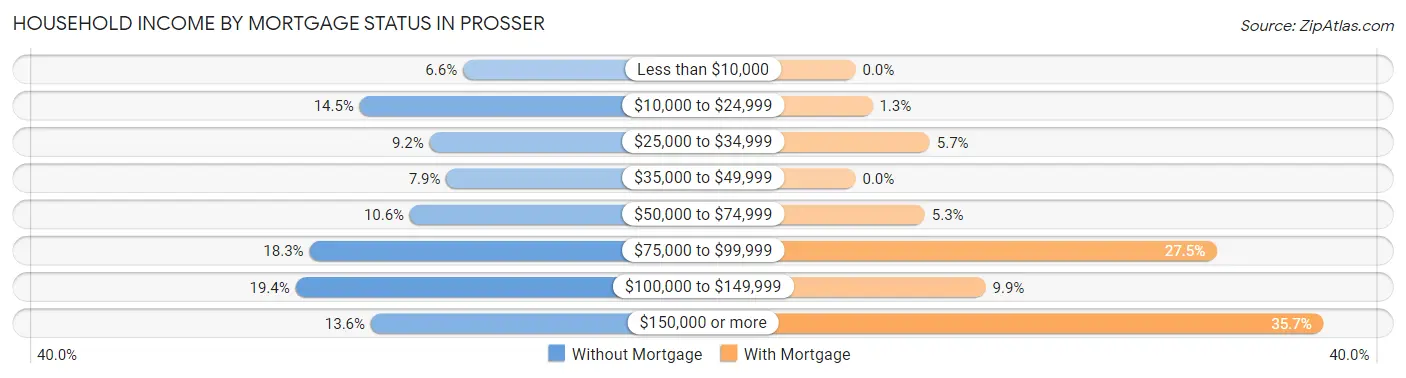
| Household Income | Without Mortgage | With Mortgage |
| Less than $10,000 | 31 (6.6%) | 0 (0.0%) |
| $10,000 to $24,999 | 68 (14.5%) | 10 (1.3%) |
| $25,000 to $34,999 | 43 (9.1%) | 44 (5.7%) |
| $35,000 to $49,999 | 37 (7.9%) | 0 (0.0%) |
| $50,000 to $74,999 | 50 (10.6%) | 41 (5.3%) |
| $75,000 to $99,999 | 86 (18.3%) | 214 (27.5%) |
| $100,000 to $149,999 | 91 (19.4%) | 77 (9.9%) |
| $150,000 or more | 64 (13.6%) | 277 (35.6%) |
| Total | 470 (100.0%) | 777 (100.0%) |
Property Value to Household Income Ratio in Prosser
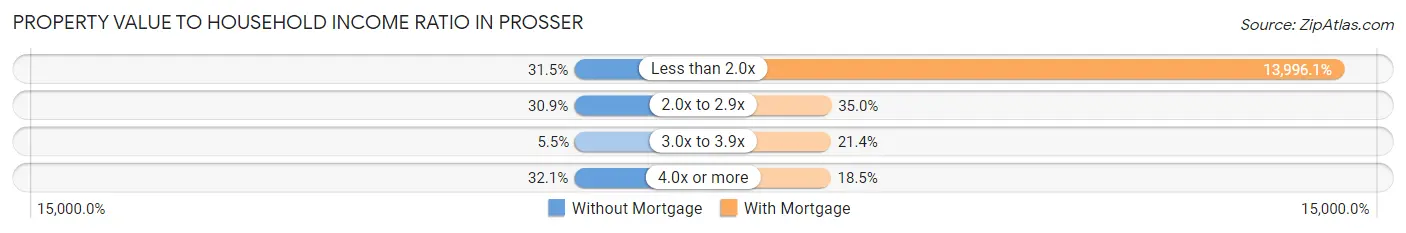
| Value-to-Income Ratio | Without Mortgage | With Mortgage |
| Less than 2.0x | 148 (31.5%) | 108,750 (13,996.1%) |
| 2.0x to 2.9x | 145 (30.8%) | 272 (35.0%) |
| 3.0x to 3.9x | 26 (5.5%) | 166 (21.4%) |
| 4.0x or more | 151 (32.1%) | 144 (18.5%) |
| Total | 470 (100.0%) | 777 (100.0%) |
Real Estate Taxes by Mortgage Status in Prosser
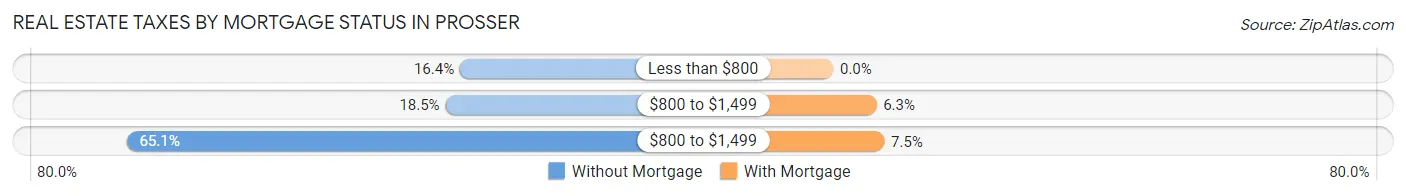
| Property Taxes | Without Mortgage | With Mortgage |
| Less than $800 | 77 (16.4%) | 0 (0.0%) |
| $800 to $1,499 | 87 (18.5%) | 49 (6.3%) |
| $800 to $1,499 | 306 (65.1%) | 58 (7.5%) |
| Total | 470 (100.0%) | 777 (100.0%) |
Health & Disability in Prosser
Health Insurance Coverage by Age in Prosser
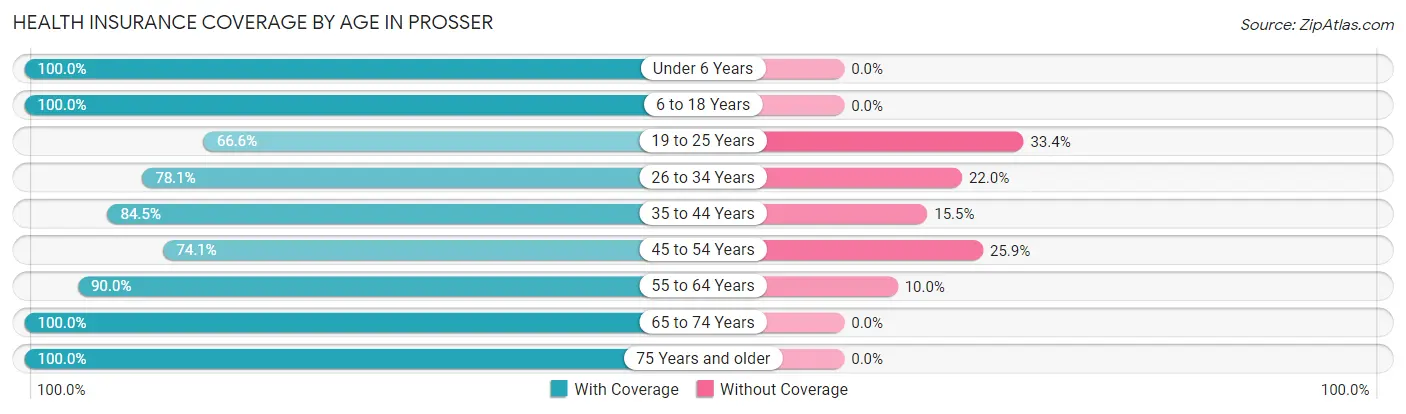
| Age Bracket | With Coverage | Without Coverage |
| Under 6 Years | 611 (100.0%) | 0 (0.0%) |
| 6 to 18 Years | 1,095 (100.0%) | 0 (0.0%) |
| 19 to 25 Years | 524 (66.6%) | 263 (33.4%) |
| 26 to 34 Years | 608 (78.0%) | 171 (22.0%) |
| 35 to 44 Years | 393 (84.5%) | 72 (15.5%) |
| 45 to 54 Years | 570 (74.1%) | 199 (25.9%) |
| 55 to 64 Years | 425 (90.0%) | 47 (10.0%) |
| 65 to 74 Years | 576 (100.0%) | 0 (0.0%) |
| 75 Years and older | 547 (100.0%) | 0 (0.0%) |
| Total | 5,349 (87.7%) | 752 (12.3%) |
Health Insurance Coverage by Citizenship Status in Prosser
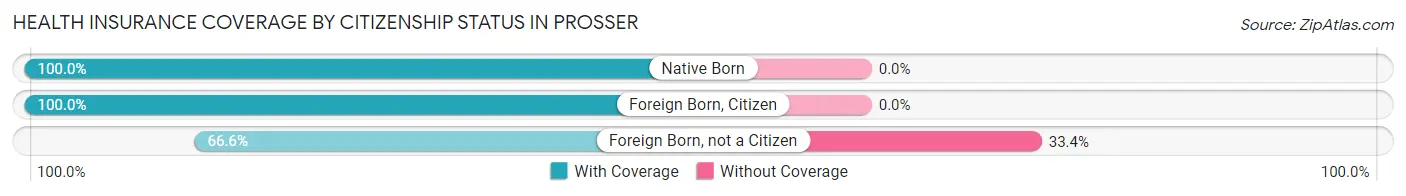
| Citizenship Status | With Coverage | Without Coverage |
| Native Born | 611 (100.0%) | 0 (0.0%) |
| Foreign Born, Citizen | 1,095 (100.0%) | 0 (0.0%) |
| Foreign Born, not a Citizen | 524 (66.6%) | 263 (33.4%) |
Health Insurance Coverage by Household Income in Prosser
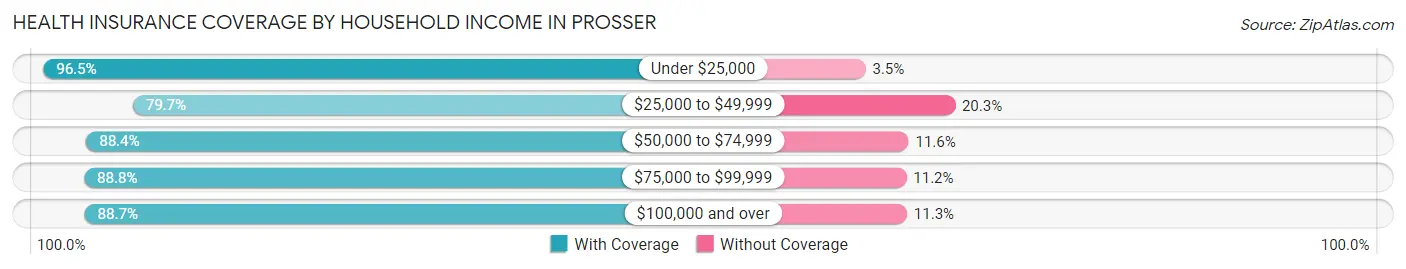
| Household Income | With Coverage | Without Coverage |
| Under $25,000 | 549 (96.5%) | 20 (3.5%) |
| $25,000 to $49,999 | 936 (79.7%) | 238 (20.3%) |
| $50,000 to $74,999 | 1,147 (88.4%) | 150 (11.6%) |
| $75,000 to $99,999 | 605 (88.8%) | 76 (11.2%) |
| $100,000 and over | 2,112 (88.7%) | 268 (11.3%) |
Public vs Private Health Insurance Coverage by Age in Prosser
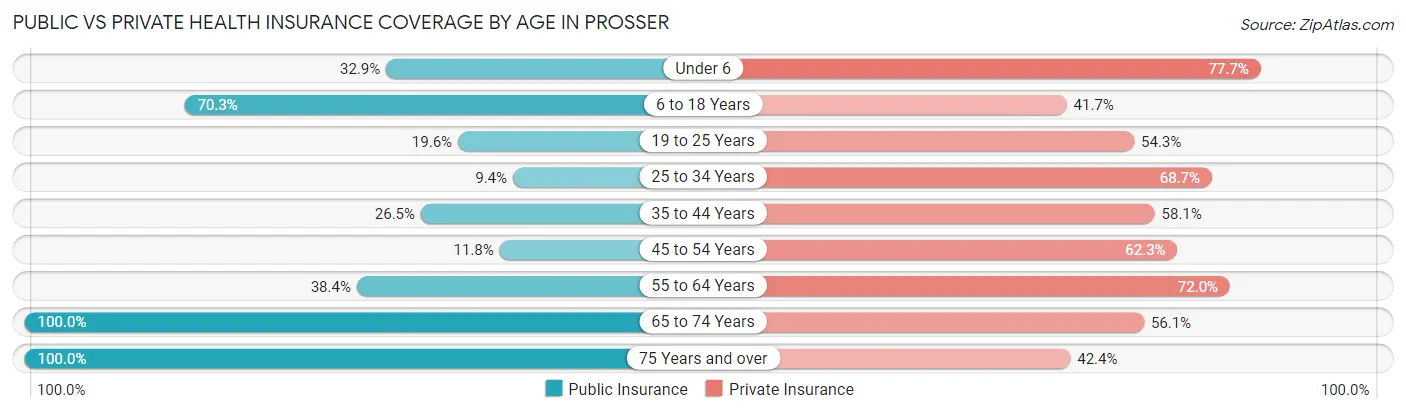
| Age Bracket | Public Insurance | Private Insurance |
| Under 6 | 201 (32.9%) | 475 (77.7%) |
| 6 to 18 Years | 770 (70.3%) | 457 (41.7%) |
| 19 to 25 Years | 154 (19.6%) | 427 (54.3%) |
| 25 to 34 Years | 73 (9.4%) | 535 (68.7%) |
| 35 to 44 Years | 123 (26.5%) | 270 (58.1%) |
| 45 to 54 Years | 91 (11.8%) | 479 (62.3%) |
| 55 to 64 Years | 181 (38.4%) | 340 (72.0%) |
| 65 to 74 Years | 576 (100.0%) | 323 (56.1%) |
| 75 Years and over | 547 (100.0%) | 232 (42.4%) |
| Total | 2,716 (44.5%) | 3,538 (58.0%) |
Disability Status by Sex by Age in Prosser
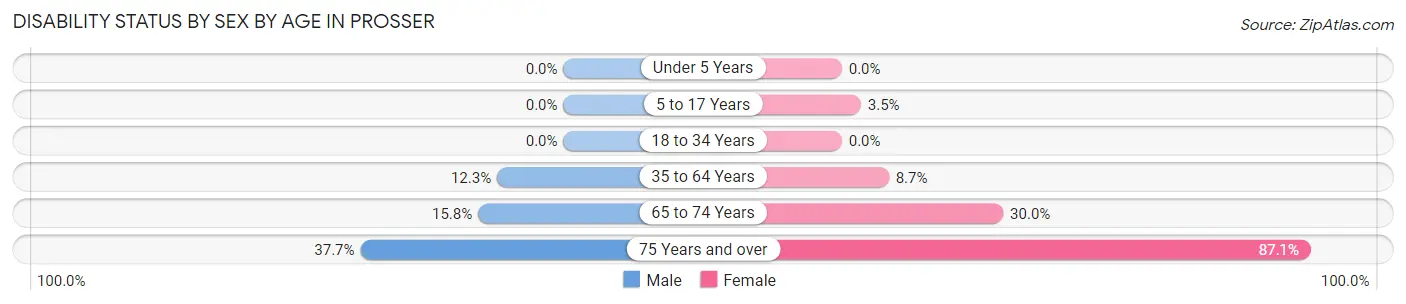
| Age Bracket | Male | Female |
| Under 5 Years | 0 (0.0%) | 0 (0.0%) |
| 5 to 17 Years | 0 (0.0%) | 23 (3.5%) |
| 18 to 34 Years | 0 (0.0%) | 0 (0.0%) |
| 35 to 64 Years | 114 (12.3%) | 68 (8.7%) |
| 65 to 74 Years | 32 (15.8%) | 112 (29.9%) |
| 75 Years and over | 78 (37.7%) | 296 (87.1%) |
Disability Class by Sex by Age in Prosser
Disability Class: Hearing Difficulty
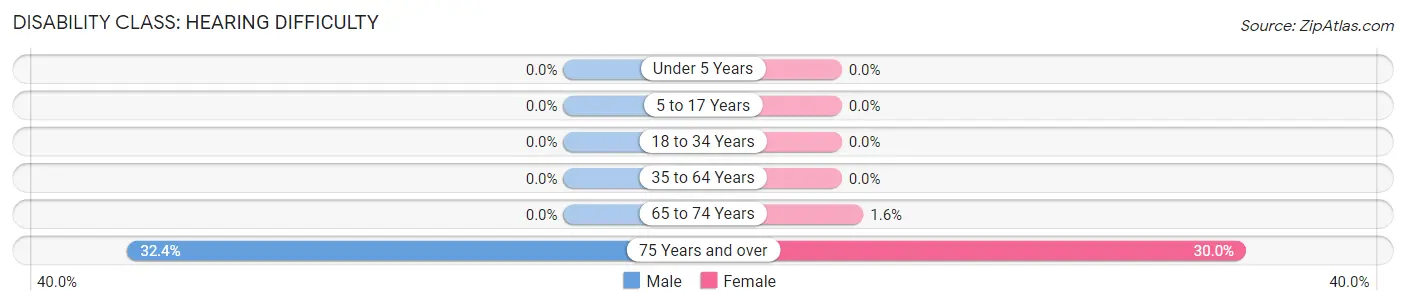
| Age Bracket | Male | Female |
| Under 5 Years | 0 (0.0%) | 0 (0.0%) |
| 5 to 17 Years | 0 (0.0%) | 0 (0.0%) |
| 18 to 34 Years | 0 (0.0%) | 0 (0.0%) |
| 35 to 64 Years | 0 (0.0%) | 0 (0.0%) |
| 65 to 74 Years | 0 (0.0%) | 6 (1.6%) |
| 75 Years and over | 67 (32.4%) | 102 (30.0%) |
Disability Class: Vision Difficulty
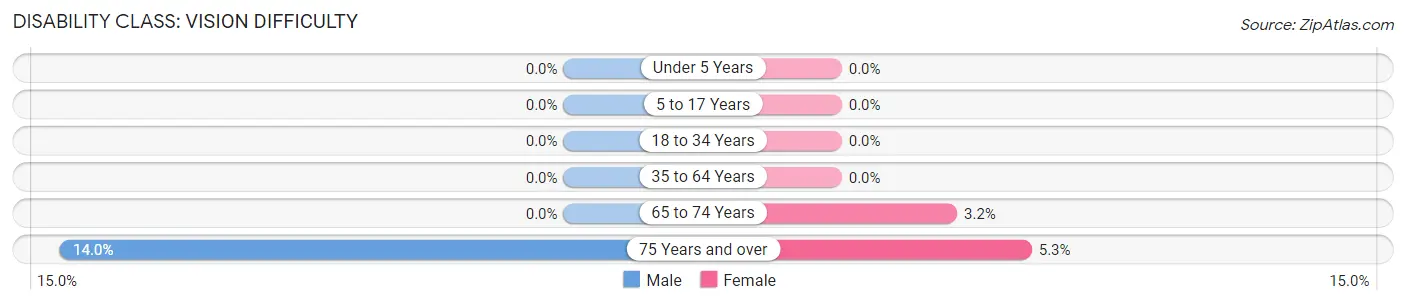
| Age Bracket | Male | Female |
| Under 5 Years | 0 (0.0%) | 0 (0.0%) |
| 5 to 17 Years | 0 (0.0%) | 0 (0.0%) |
| 18 to 34 Years | 0 (0.0%) | 0 (0.0%) |
| 35 to 64 Years | 0 (0.0%) | 0 (0.0%) |
| 65 to 74 Years | 0 (0.0%) | 12 (3.2%) |
| 75 Years and over | 29 (14.0%) | 18 (5.3%) |
Disability Class: Cognitive Difficulty
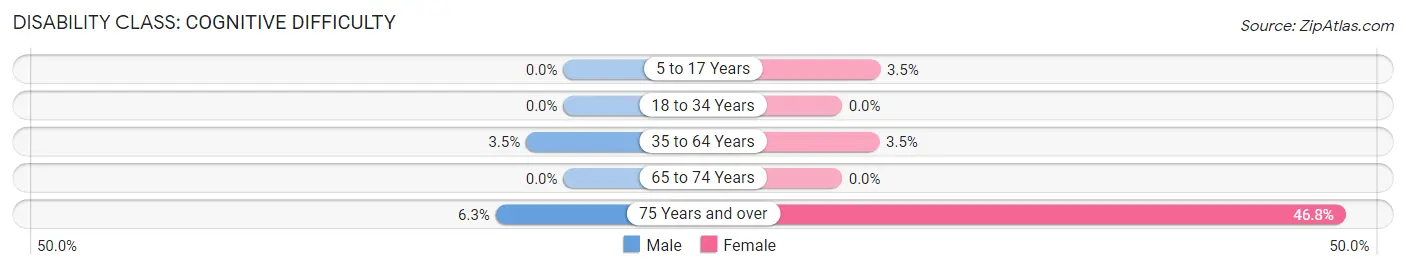
| Age Bracket | Male | Female |
| 5 to 17 Years | 0 (0.0%) | 23 (3.5%) |
| 18 to 34 Years | 0 (0.0%) | 0 (0.0%) |
| 35 to 64 Years | 32 (3.5%) | 27 (3.5%) |
| 65 to 74 Years | 0 (0.0%) | 0 (0.0%) |
| 75 Years and over | 13 (6.3%) | 159 (46.8%) |
Disability Class: Ambulatory Difficulty
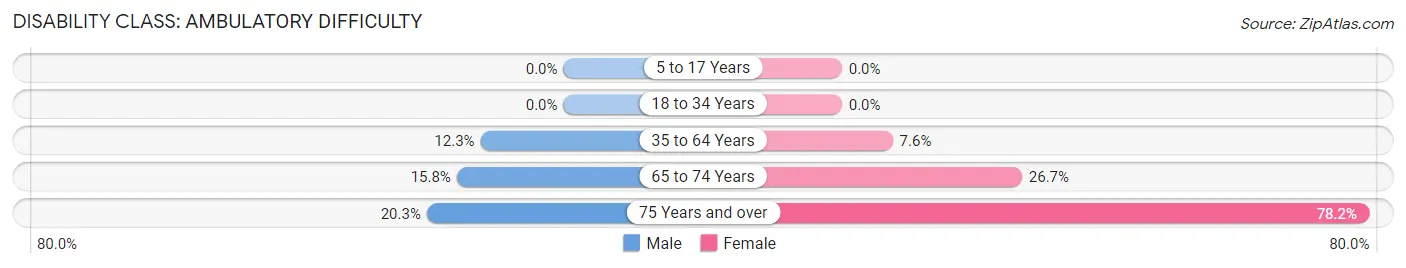
| Age Bracket | Male | Female |
| 5 to 17 Years | 0 (0.0%) | 0 (0.0%) |
| 18 to 34 Years | 0 (0.0%) | 0 (0.0%) |
| 35 to 64 Years | 114 (12.3%) | 59 (7.5%) |
| 65 to 74 Years | 32 (15.8%) | 100 (26.7%) |
| 75 Years and over | 42 (20.3%) | 266 (78.2%) |
Disability Class: Self-Care Difficulty
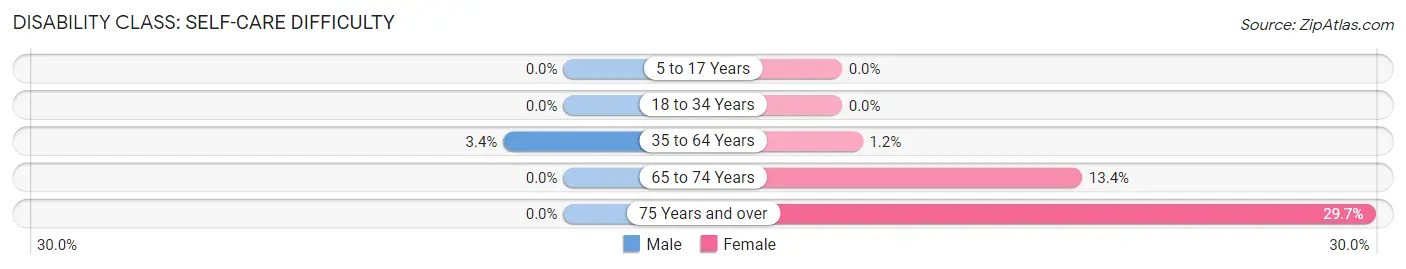
| Age Bracket | Male | Female |
| 5 to 17 Years | 0 (0.0%) | 0 (0.0%) |
| 18 to 34 Years | 0 (0.0%) | 0 (0.0%) |
| 35 to 64 Years | 31 (3.4%) | 9 (1.1%) |
| 65 to 74 Years | 0 (0.0%) | 50 (13.4%) |
| 75 Years and over | 0 (0.0%) | 101 (29.7%) |
Technology Access in Prosser
Computing Device Access in Prosser
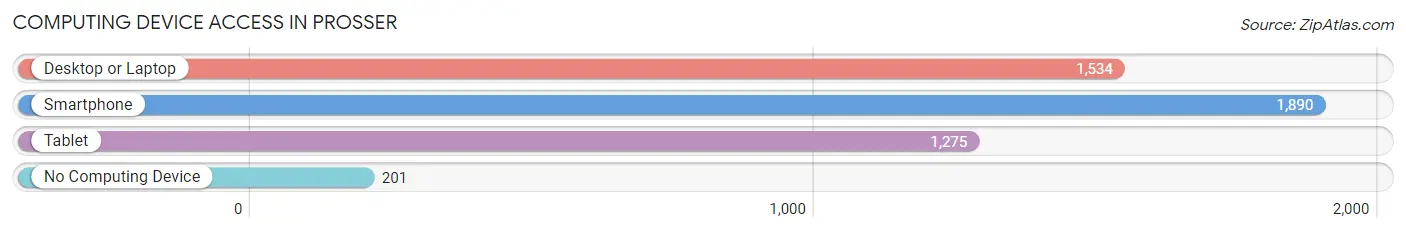
| Device Type | # Households | % Households |
| Desktop or Laptop | 1,534 | 68.0% |
| Smartphone | 1,890 | 83.8% |
| Tablet | 1,275 | 56.5% |
| No Computing Device | 201 | 8.9% |
| Total | 2,255 | 100.0% |
Internet Access in Prosser
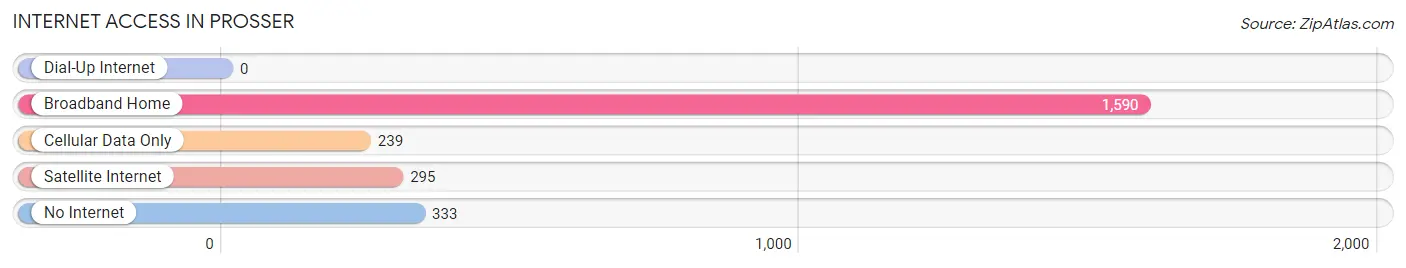
| Internet Type | # Households | % Households |
| Dial-Up Internet | 0 | 0.0% |
| Broadband Home | 1,590 | 70.5% |
| Cellular Data Only | 239 | 10.6% |
| Satellite Internet | 295 | 13.1% |
| No Internet | 333 | 14.8% |
| Total | 2,255 | 100.0% |
Prosser Summary
Prosser, Washington is a small city located in the Yakima Valley in the southeastern part of the state. It is the county seat of Benton County and is situated along the Yakima River. The city has a population of 5,714 as of the 2010 census, making it the largest city in Benton County.
History
Prosser was founded in 1892 by William Prosser, a settler from Iowa. He purchased land from the Northern Pacific Railway and established a small farming community. The town was officially incorporated in 1899.
In the early 1900s, Prosser was a thriving agricultural community, with many farmers growing apples, cherries, and other fruits. The town was also home to several wineries, which produced some of the finest wines in the state.
In the 1950s, Prosser began to experience a population boom as people moved to the area to take advantage of the fertile soil and mild climate. The city was also home to several large industries, including a sugar beet processing plant and a cannery.
Geography
Prosser is located in the Yakima Valley, which is part of the Columbia Plateau. The city is situated along the Yakima River, which provides irrigation for the surrounding agricultural lands. The city is located at an elevation of 1,068 feet (325 m).
The climate in Prosser is semi-arid, with hot summers and cold winters. The average annual temperature is 54°F (12°C). The average annual precipitation is 8.5 inches (216 mm).
Economy
Agriculture is the main economic driver in Prosser. The city is home to several large farms, which produce a variety of fruits and vegetables, including apples, cherries, and grapes. The city is also home to several wineries, which produce some of the finest wines in the state.
In addition to agriculture, Prosser is home to several large industries, including a sugar beet processing plant and a cannery. The city is also home to several retail stores, restaurants, and other businesses.
Demographics
As of the 2010 census, Prosser had a population of 5,714. The racial makeup of the city was 79.2% White, 0.7% African American, 0.9% Native American, 0.7% Asian, 0.1% Pacific Islander, 15.3% from other races, and 3.1% from two or more races. Hispanic or Latino of any race were 24.2% of the population.
The median household income in Prosser was $41,944, and the median family income was $48,958. The per capita income was $19,945. About 16.2% of families and 20.2% of the population were below the poverty line, including 28.2% of those under age 18 and 8.2% of those age 65 or over.
Prosser is a small city with a rich history and a diverse population. The city is home to several large farms and industries, which provide employment opportunities for its residents. The city is also home to several wineries, which produce some of the finest wines in the state. Prosser is a great place to live, work, and raise a family.
Common Questions
What is Per Capita Income in Prosser?
Per Capita income in Prosser is $28,871.
What is the Median Family Income in Prosser?
Median Family Income in Prosser is $66,250.
What is the Median Household income in Prosser?
Median Household Income in Prosser is $64,622.
What is Income or Wage Gap in Prosser?
Income or Wage Gap in Prosser is 47.4%.
Women in Prosser earn 52.6 cents for every dollar earned by a man.
What is Inequality or Gini Index in Prosser?
Inequality or Gini Index in Prosser is 0.41.
What is the Total Population of Prosser?
Total Population of Prosser is 6,138.
What is the Total Male Population of Prosser?
Total Male Population of Prosser is 2,906.
What is the Total Female Population of Prosser?
Total Female Population of Prosser is 3,232.
What is the Ratio of Males per 100 Females in Prosser?
There are 89.91 Males per 100 Females in Prosser.
What is the Ratio of Females per 100 Males in Prosser?
There are 111.22 Females per 100 Males in Prosser.
What is the Median Population Age in Prosser?
Median Population Age in Prosser is 33.4 Years.
What is the Average Family Size in Prosser
Average Family Size in Prosser is 3.3 People.
What is the Average Household Size in Prosser
Average Household Size in Prosser is 2.7 People.
How Large is the Labor Force in Prosser?
There are 2,708 People in the Labor Forcein in Prosser.
What is the Percentage of People in the Labor Force in Prosser?
59.6% of People are in the Labor Force in Prosser.
What is the Unemployment Rate in Prosser?
Unemployment Rate in Prosser is 10.5%.