Cities with the Highest Percentage of Hawaiian / Pacific Population in Washington
RELATED REPORTS & OPTIONS
Hawaiian / Pacific
Washington
Compare Cities
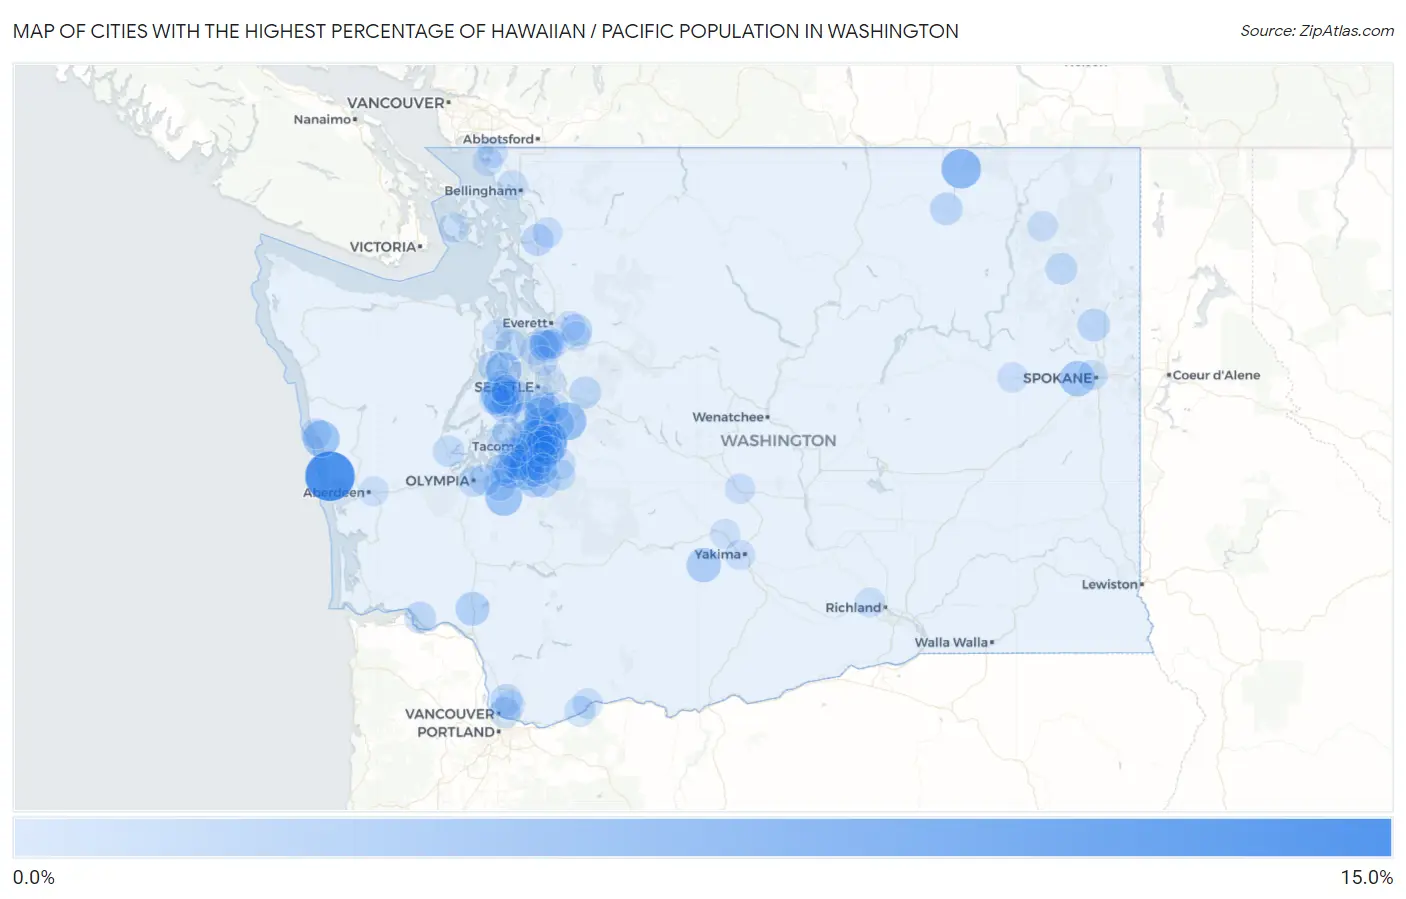
Map of Cities with the Highest Percentage of Hawaiian / Pacific Population in Washington
0.0%
15.0%
Cities with the Highest Percentage of Hawaiian / Pacific Population in Washington
| City | Hawaiian / Pacific | vs State | vs National | |
| 1. | Ocean City | 15.0% | 0.69%(+14.3)#1 | 0.19%(+14.8)#58 |
| 2. | Fife | 7.6% | 0.69%(+6.94)#2 | 0.19%(+7.44)#126 |
| 3. | Curlew | 7.4% | 0.69%(+6.72)#3 | 0.19%(+7.22)#134 |
| 4. | Pacific | 7.0% | 0.69%(+6.31)#4 | 0.19%(+6.81)#141 |
| 5. | Shadow Lake | 6.1% | 0.69%(+5.36)#5 | 0.19%(+5.86)#161 |
| 6. | Navy Yard City | 5.5% | 0.69%(+4.80)#6 | 0.19%(+5.30)#173 |
| 7. | Yelm | 5.4% | 0.69%(+4.69)#7 | 0.19%(+5.19)#178 |
| 8. | Santiago | 5.3% | 0.69%(+4.64)#8 | 0.19%(+5.14)#181 |
| 9. | Keyport | 4.6% | 0.69%(+3.89)#9 | 0.19%(+4.39)#209 |
| 10. | Airway Heights | 4.5% | 0.69%(+3.80)#10 | 0.19%(+4.31)#214 |
| 11. | Midland | 4.2% | 0.69%(+3.47)#11 | 0.19%(+3.97)#229 |
| 12. | Lakeland North | 4.2% | 0.69%(+3.47)#12 | 0.19%(+3.97)#230 |
| 13. | Spanaway | 4.1% | 0.69%(+3.44)#13 | 0.19%(+3.94)#232 |
| 14. | Tampico | 3.7% | 0.69%(+3.05)#14 | 0.19%(+3.55)#248 |
| 15. | Parkland | 3.7% | 0.69%(+3.04)#15 | 0.19%(+3.54)#252 |
| 16. | Manchester | 3.4% | 0.69%(+2.74)#16 | 0.19%(+3.24)#268 |
| 17. | Tukwila | 3.4% | 0.69%(+2.67)#17 | 0.19%(+3.17)#275 |
| 18. | Dash Point | 3.4% | 0.69%(+2.67)#18 | 0.19%(+3.17)#276 |
| 19. | Castle Rock | 3.3% | 0.69%(+2.63)#19 | 0.19%(+3.13)#281 |
| 20. | Seatac | 3.2% | 0.69%(+2.51)#20 | 0.19%(+3.02)#289 |
| 21. | Lakewood | 3.2% | 0.69%(+2.49)#21 | 0.19%(+2.99)#291 |
| 22. | Kent | 2.9% | 0.69%(+2.20)#22 | 0.19%(+2.70)#320 |
| 23. | Bethel | 2.7% | 0.69%(+2.06)#23 | 0.19%(+2.56)#333 |
| 24. | Edgewood | 2.7% | 0.69%(+2.03)#24 | 0.19%(+2.53)#334 |
| 25. | Auburn | 2.7% | 0.69%(+1.97)#25 | 0.19%(+2.47)#341 |
| 26. | Graham | 2.5% | 0.69%(+1.85)#26 | 0.19%(+2.35)#349 |
| 27. | Fort Lewis | 2.5% | 0.69%(+1.81)#27 | 0.19%(+2.31)#354 |
| 28. | Parkwood | 2.5% | 0.69%(+1.78)#28 | 0.19%(+2.28)#358 |
| 29. | Deer Park | 2.4% | 0.69%(+1.72)#29 | 0.19%(+2.22)#369 |
| 30. | Des Moines | 2.4% | 0.69%(+1.70)#30 | 0.19%(+2.20)#370 |
| 31. | Republic | 2.3% | 0.69%(+1.63)#31 | 0.19%(+2.13)#379 |
| 32. | Federal Way | 2.3% | 0.69%(+1.60)#32 | 0.19%(+2.10)#383 |
| 33. | Larch Way | 2.3% | 0.69%(+1.56)#33 | 0.19%(+2.06)#392 |
| 34. | Three Lakes | 2.1% | 0.69%(+1.41)#34 | 0.19%(+1.91)#408 |
| 35. | Port Orchard | 2.1% | 0.69%(+1.37)#35 | 0.19%(+1.87)#418 |
| 36. | Lakeland South | 2.1% | 0.69%(+1.37)#36 | 0.19%(+1.87)#419 |
| 37. | Elk Plain | 2.0% | 0.69%(+1.32)#37 | 0.19%(+1.82)#427 |
| 38. | Burlington | 2.0% | 0.69%(+1.31)#38 | 0.19%(+1.81)#432 |
| 39. | Fall City | 1.9% | 0.69%(+1.24)#39 | 0.19%(+1.74)#445 |
| 40. | Dupont | 1.9% | 0.69%(+1.22)#40 | 0.19%(+1.72)#452 |
| 41. | Barberton | 1.9% | 0.69%(+1.21)#41 | 0.19%(+1.71)#454 |
| 42. | Lake Stickney | 1.9% | 0.69%(+1.21)#42 | 0.19%(+1.71)#456 |
| 43. | North Fort Lewis | 1.9% | 0.69%(+1.20)#43 | 0.19%(+1.70)#458 |
| 44. | Nisqually Indian Community | 1.9% | 0.69%(+1.17)#44 | 0.19%(+1.67)#463 |
| 45. | Chewelah | 1.8% | 0.69%(+1.14)#45 | 0.19%(+1.65)#467 |
| 46. | Bremerton | 1.8% | 0.69%(+1.12)#46 | 0.19%(+1.62)#475 |
| 47. | Lower Elochoman | 1.8% | 0.69%(+1.11)#47 | 0.19%(+1.61)#479 |
| 48. | Vancouver | 1.6% | 0.69%(+0.951)#48 | 0.19%(+1.45)#521 |
| 49. | Shelton | 1.6% | 0.69%(+0.932)#49 | 0.19%(+1.43)#523 |
| 50. | Lacey | 1.6% | 0.69%(+0.866)#50 | 0.19%(+1.37)#545 |
| 51. | Frederickson | 1.6% | 0.69%(+0.863)#51 | 0.19%(+1.36)#546 |
| 52. | Tracyton | 1.5% | 0.69%(+0.789)#52 | 0.19%(+1.29)#561 |
| 53. | Prairie Ridge | 1.4% | 0.69%(+0.757)#53 | 0.19%(+1.26)#568 |
| 54. | North Bonneville | 1.4% | 0.69%(+0.707)#54 | 0.19%(+1.21)#584 |
| 55. | Milton | 1.4% | 0.69%(+0.680)#55 | 0.19%(+1.18)#596 |
| 56. | Bangor Base | 1.3% | 0.69%(+0.651)#56 | 0.19%(+1.15)#606 |
| 57. | Crocker | 1.3% | 0.69%(+0.624)#57 | 0.19%(+1.12)#617 |
| 58. | Port Gamble Tribal Community | 1.3% | 0.69%(+0.605)#58 | 0.19%(+1.11)#623 |
| 59. | Olympia | 1.3% | 0.69%(+0.587)#59 | 0.19%(+1.09)#630 |
| 60. | Mcchord Afb | 1.2% | 0.69%(+0.552)#60 | 0.19%(+1.05)#643 |
| 61. | Summit View | 1.2% | 0.69%(+0.534)#61 | 0.19%(+1.03)#646 |
| 62. | Taholah | 1.2% | 0.69%(+0.526)#62 | 0.19%(+1.03)#651 |
| 63. | Vashon | 1.2% | 0.69%(+0.490)#63 | 0.19%(+0.991)#659 |
| 64. | Tacoma | 1.1% | 0.69%(+0.461)#64 | 0.19%(+0.961)#670 |
| 65. | Algona | 1.1% | 0.69%(+0.444)#65 | 0.19%(+0.945)#684 |
| 66. | Boulevard Park | 1.1% | 0.69%(+0.421)#66 | 0.19%(+0.922)#693 |
| 67. | Sumner | 1.1% | 0.69%(+0.406)#67 | 0.19%(+0.907)#696 |
| 68. | Everett | 1.1% | 0.69%(+0.403)#68 | 0.19%(+0.904)#697 |
| 69. | University Place | 1.1% | 0.69%(+0.383)#69 | 0.19%(+0.883)#705 |
| 70. | Puyallup | 1.1% | 0.69%(+0.364)#70 | 0.19%(+0.865)#712 |
| 71. | Enetai | 0.96% | 0.69%(+0.274)#71 | 0.19%(+0.774)#761 |
| 72. | South Hill | 0.95% | 0.69%(+0.263)#72 | 0.19%(+0.764)#769 |
| 73. | Stevenson | 0.94% | 0.69%(+0.253)#73 | 0.19%(+0.754)#776 |
| 74. | Chain Lake | 0.94% | 0.69%(+0.248)#74 | 0.19%(+0.748)#780 |
| 75. | North Lynnwood | 0.94% | 0.69%(+0.247)#75 | 0.19%(+0.748)#781 |
| 76. | Marine View | 0.89% | 0.69%(+0.203)#76 | 0.19%(+0.704)#814 |
| 77. | Spokane | 0.89% | 0.69%(+0.196)#77 | 0.19%(+0.697)#820 |
| 78. | Colville | 0.87% | 0.69%(+0.183)#78 | 0.19%(+0.684)#830 |
| 79. | Port Ludlow | 0.87% | 0.69%(+0.183)#79 | 0.19%(+0.683)#833 |
| 80. | Renton | 0.85% | 0.69%(+0.164)#80 | 0.19%(+0.665)#845 |
| 81. | Five Corners | 0.84% | 0.69%(+0.152)#81 | 0.19%(+0.653)#850 |
| 82. | Yakima | 0.84% | 0.69%(+0.150)#82 | 0.19%(+0.650)#851 |
| 83. | Davenport | 0.81% | 0.69%(+0.121)#83 | 0.19%(+0.622)#881 |
| 84. | Blaine | 0.80% | 0.69%(+0.112)#84 | 0.19%(+0.613)#891 |
| 85. | Martha Lake | 0.79% | 0.69%(+0.102)#85 | 0.19%(+0.602)#898 |
| 86. | Fairwood Cdp King County | 0.79% | 0.69%(+0.100)#86 | 0.19%(+0.601)#901 |
| 87. | Marietta Alderwood | 0.79% | 0.69%(+0.098)#87 | 0.19%(+0.598)#905 |
| 88. | Sedro Woolley | 0.79% | 0.69%(+0.097)#88 | 0.19%(+0.597)#906 |
| 89. | Ellensburg | 0.78% | 0.69%(+0.089)#89 | 0.19%(+0.590)#916 |
| 90. | Friday Harbor | 0.76% | 0.69%(+0.066)#90 | 0.19%(+0.567)#934 |
| 91. | Naches | 0.74% | 0.69%(+0.048)#91 | 0.19%(+0.548)#950 |
| 92. | Artondale | 0.73% | 0.69%(+0.039)#92 | 0.19%(+0.540)#962 |
| 93. | Mill Creek | 0.73% | 0.69%(+0.037)#93 | 0.19%(+0.537)#965 |
| 94. | Birch Bay | 0.72% | 0.69%(+0.029)#94 | 0.19%(+0.529)#975 |
| 95. | Edmonds | 0.71% | 0.69%(+0.020)#95 | 0.19%(+0.521)#985 |
| 96. | Yarrow Point | 0.70% | 0.69%(+0.014)#96 | 0.19%(+0.514)#995 |
| 97. | Gig Harbor | 0.68% | 0.69%(-0.010)#97 | 0.19%(+0.491)#1,027 |
| 98. | Aberdeen | 0.67% | 0.69%(-0.018)#98 | 0.19%(+0.483)#1,038 |
| 99. | Lake Forest Park | 0.67% | 0.69%(-0.021)#99 | 0.19%(+0.480)#1,042 |
| 100. | West Richland | 0.66% | 0.69%(-0.031)#100 | 0.19%(+0.470)#1,054 |
Common Questions
What are the Top 10 Cities with the Highest Percentage of Hawaiian / Pacific Population in Washington?
Top 10 Cities with the Highest Percentage of Hawaiian / Pacific Population in Washington are:
#1
15.0%
#2
7.6%
#3
7.4%
#4
7.0%
#5
6.1%
#6
5.5%
#7
5.4%
#8
5.3%
#9
4.6%
#10
4.5%
What city has the Highest Percentage of Hawaiian / Pacific Population in Washington?
Ocean City has the Highest Percentage of Hawaiian / Pacific Population in Washington with 15.0%.
What is the Percentage of Hawaiian / Pacific Population in the State of Washington?
Percentage of Hawaiian / Pacific Population in Washington is 0.69%.
What is the Percentage of Hawaiian / Pacific Population in the United States?
Percentage of Hawaiian / Pacific Population in the United States is 0.19%.