Cities with the Lowest Unemployment Rate Amomg Youth Under the Age of 25 in Washington
RELATED REPORTS & OPTIONS
Lowest Unemployment | Youth < 25
Washington
Compare Cities
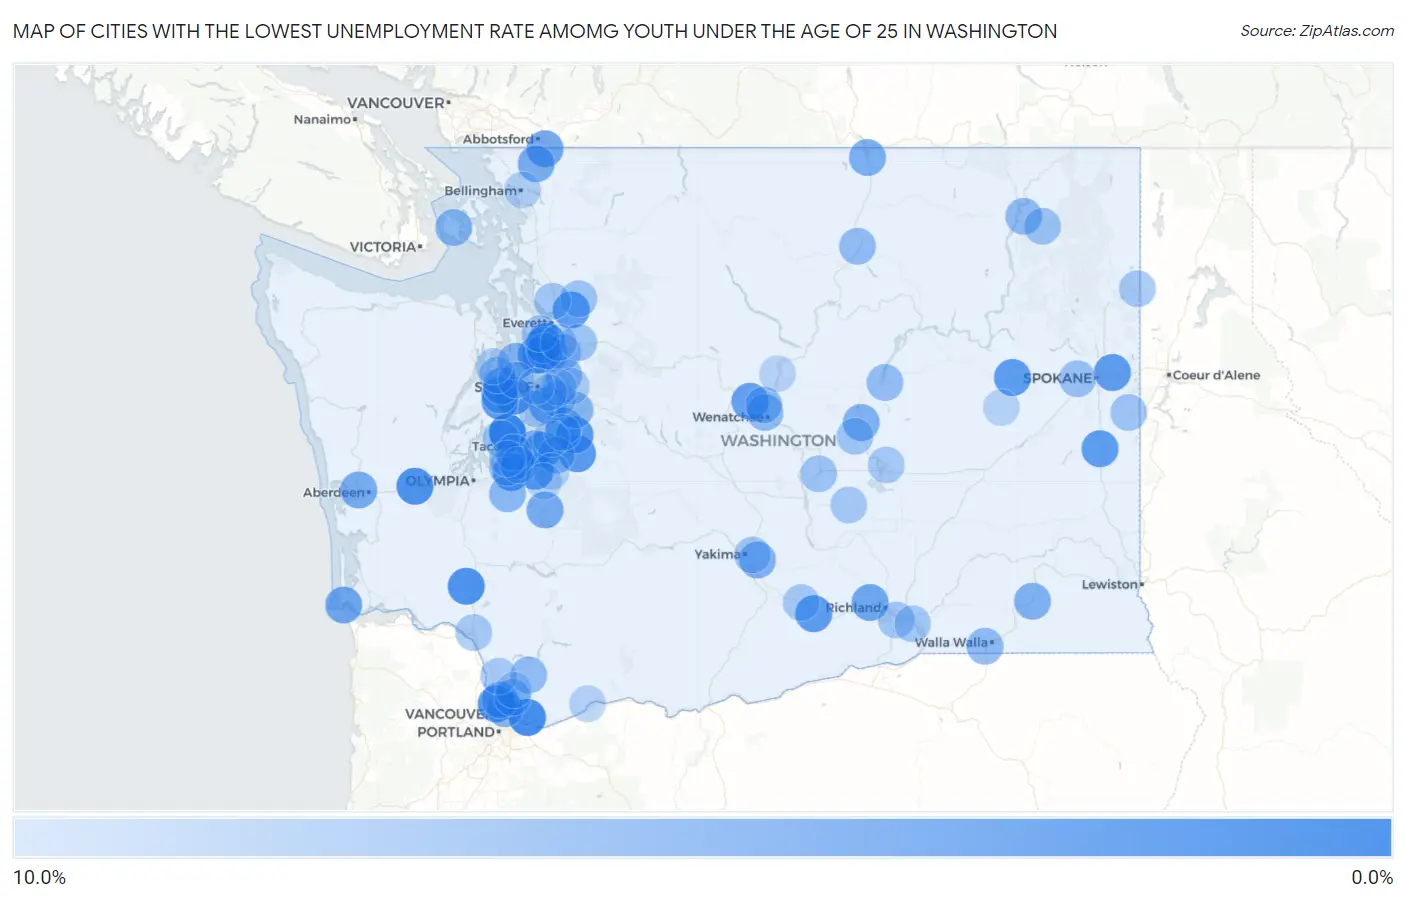
Map of Cities with the Lowest Unemployment Rate Amomg Youth Under the Age of 25 in Washington
10.0%
0.0%
Cities with the Lowest Unemployment Rate Amomg Youth Under the Age of 25 in Washington
| City | Youth Unemployment | vs State | vs National | |
| 1. | Gig Harbor | 0.20% | 10.9%(-10.7)#1 | 10.9%(-10.7)#4 |
| 2. | Camas | 1.0% | 10.9%(-9.90)#2 | 10.9%(-9.90)#118 |
| 3. | Vader | 1.6% | 10.9%(-9.30)#3 | 10.9%(-9.30)#296 |
| 4. | Lake Stickney | 1.7% | 10.9%(-9.20)#4 | 10.9%(-9.20)#311 |
| 5. | Elma | 1.7% | 10.9%(-9.20)#5 | 10.9%(-9.20)#330 |
| 6. | Lake Shore | 1.8% | 10.9%(-9.10)#6 | 10.9%(-9.10)#368 |
| 7. | Manchester | 2.3% | 10.9%(-8.60)#7 | 10.9%(-8.60)#606 |
| 8. | Enumclaw | 2.5% | 10.9%(-8.40)#8 | 10.9%(-8.40)#704 |
| 9. | Black Diamond | 2.5% | 10.9%(-8.40)#9 | 10.9%(-8.40)#717 |
| 10. | Fort Lewis | 2.7% | 10.9%(-8.20)#10 | 10.9%(-8.20)#829 |
| 11. | Grandview | 2.7% | 10.9%(-8.20)#11 | 10.9%(-8.20)#833 |
| 12. | Davenport | 2.7% | 10.9%(-8.20)#12 | 10.9%(-8.20)#862 |
| 13. | Rosalia | 2.7% | 10.9%(-8.20)#13 | 10.9%(-8.20)#886 |
| 14. | Port Orchard | 2.8% | 10.9%(-8.10)#14 | 10.9%(-8.10)#900 |
| 15. | Millwood | 2.8% | 10.9%(-8.10)#15 | 10.9%(-8.10)#934 |
| 16. | Frederickson | 3.0% | 10.9%(-7.90)#16 | 10.9%(-7.90)#1,014 |
| 17. | Lochsloy | 3.0% | 10.9%(-7.90)#17 | 10.9%(-7.90)#1,039 |
| 18. | Cashmere | 3.3% | 10.9%(-7.60)#18 | 10.9%(-7.60)#1,255 |
| 19. | Esperance | 3.5% | 10.9%(-7.40)#19 | 10.9%(-7.40)#1,378 |
| 20. | Edgewood | 3.7% | 10.9%(-7.20)#20 | 10.9%(-7.20)#1,480 |
| 21. | Bryn Mawr Skyway | 3.8% | 10.9%(-7.10)#21 | 10.9%(-7.10)#1,550 |
| 22. | Ilwaco | 3.9% | 10.9%(-7.00)#22 | 10.9%(-7.00)#1,652 |
| 23. | Bothell West | 4.0% | 10.9%(-6.90)#23 | 10.9%(-6.90)#1,676 |
| 24. | West Richland | 4.0% | 10.9%(-6.90)#24 | 10.9%(-6.90)#1,678 |
| 25. | Navy Yard City | 4.0% | 10.9%(-6.90)#25 | 10.9%(-6.90)#1,714 |
| 26. | Sumas | 4.0% | 10.9%(-6.90)#26 | 10.9%(-6.90)#1,725 |
| 27. | Hoquiam | 4.5% | 10.9%(-6.40)#27 | 10.9%(-6.40)#2,044 |
| 28. | Eatonville | 4.5% | 10.9%(-6.40)#28 | 10.9%(-6.40)#2,066 |
| 29. | Mountlake Terrace | 4.6% | 10.9%(-6.30)#29 | 10.9%(-6.30)#2,115 |
| 30. | Tracyton | 4.7% | 10.9%(-6.20)#30 | 10.9%(-6.20)#2,213 |
| 31. | Everson | 4.7% | 10.9%(-6.20)#31 | 10.9%(-6.20)#2,224 |
| 32. | Oroville | 4.8% | 10.9%(-6.10)#32 | 10.9%(-6.10)#2,309 |
| 33. | Covington | 5.0% | 10.9%(-5.90)#33 | 10.9%(-5.90)#2,411 |
| 34. | Indianola | 5.1% | 10.9%(-5.80)#34 | 10.9%(-5.80)#2,500 |
| 35. | Minnehaha | 5.2% | 10.9%(-5.70)#35 | 10.9%(-5.70)#2,548 |
| 36. | Moxee | 5.2% | 10.9%(-5.70)#36 | 10.9%(-5.70)#2,565 |
| 37. | Dayton | 5.2% | 10.9%(-5.70)#37 | 10.9%(-5.70)#2,575 |
| 38. | Soap Lake | 5.2% | 10.9%(-5.70)#38 | 10.9%(-5.70)#2,590 |
| 39. | Fife | 5.4% | 10.9%(-5.50)#39 | 10.9%(-5.50)#2,712 |
| 40. | North Lynnwood | 5.8% | 10.9%(-5.10)#40 | 10.9%(-5.10)#3,011 |
| 41. | Mirrormont | 5.8% | 10.9%(-5.10)#41 | 10.9%(-5.10)#3,038 |
| 42. | Friday Harbor | 5.8% | 10.9%(-5.10)#42 | 10.9%(-5.10)#3,047 |
| 43. | Bonney Lake | 5.9% | 10.9%(-5.00)#43 | 10.9%(-5.00)#3,097 |
| 44. | North Yelm | 5.9% | 10.9%(-5.00)#44 | 10.9%(-5.00)#3,131 |
| 45. | Salmon Creek | 6.0% | 10.9%(-4.90)#45 | 10.9%(-4.90)#3,177 |
| 46. | College Place | 6.0% | 10.9%(-4.90)#46 | 10.9%(-4.90)#3,189 |
| 47. | Wenatchee | 6.2% | 10.9%(-4.70)#47 | 10.9%(-4.70)#3,334 |
| 48. | Redmond | 6.3% | 10.9%(-4.60)#48 | 10.9%(-4.60)#3,420 |
| 49. | Omak | 6.3% | 10.9%(-4.60)#49 | 10.9%(-4.60)#3,454 |
| 50. | Kettle Falls | 6.3% | 10.9%(-4.60)#50 | 10.9%(-4.60)#3,472 |
| 51. | Yacolt | 6.3% | 10.9%(-4.60)#51 | 10.9%(-4.60)#3,473 |
| 52. | Sunnyslope | 6.5% | 10.9%(-4.40)#52 | 10.9%(-4.40)#3,620 |
| 53. | Banks Lake South | 6.6% | 10.9%(-4.30)#53 | 10.9%(-4.30)#3,728 |
| 54. | Maltby | 6.8% | 10.9%(-4.10)#54 | 10.9%(-4.10)#3,823 |
| 55. | Airway Heights | 6.8% | 10.9%(-4.10)#55 | 10.9%(-4.10)#3,825 |
| 56. | Alderwood Manor | 6.8% | 10.9%(-4.10)#56 | 10.9%(-4.10)#3,826 |
| 57. | Brush Prairie | 6.8% | 10.9%(-4.10)#57 | 10.9%(-4.10)#3,852 |
| 58. | Lakewood | 7.0% | 10.9%(-3.90)#58 | 10.9%(-3.90)#3,956 |
| 59. | North Fort Lewis | 7.0% | 10.9%(-3.90)#59 | 10.9%(-3.90)#3,986 |
| 60. | Colville | 7.0% | 10.9%(-3.90)#60 | 10.9%(-3.90)#3,990 |
| 61. | Artondale | 7.1% | 10.9%(-3.80)#61 | 10.9%(-3.80)#4,036 |
| 62. | George | 7.1% | 10.9%(-3.80)#62 | 10.9%(-3.80)#4,069 |
| 63. | Rockford | 7.1% | 10.9%(-3.80)#63 | 10.9%(-3.80)#4,086 |
| 64. | Ephrata | 7.2% | 10.9%(-3.70)#64 | 10.9%(-3.70)#4,138 |
| 65. | Canyon Creek | 7.2% | 10.9%(-3.70)#65 | 10.9%(-3.70)#4,152 |
| 66. | Silverdale | 7.3% | 10.9%(-3.60)#66 | 10.9%(-3.60)#4,195 |
| 67. | Monroe | 7.3% | 10.9%(-3.60)#67 | 10.9%(-3.60)#4,198 |
| 68. | Kennewick | 7.4% | 10.9%(-3.50)#68 | 10.9%(-3.50)#4,255 |
| 69. | Newcastle | 7.4% | 10.9%(-3.50)#69 | 10.9%(-3.50)#4,279 |
| 70. | Terrace Heights | 7.4% | 10.9%(-3.50)#70 | 10.9%(-3.50)#4,287 |
| 71. | Marysville | 7.5% | 10.9%(-3.40)#71 | 10.9%(-3.40)#4,338 |
| 72. | Newport | 7.5% | 10.9%(-3.40)#72 | 10.9%(-3.40)#4,378 |
| 73. | University Place | 7.6% | 10.9%(-3.30)#73 | 10.9%(-3.30)#4,415 |
| 74. | Auburn | 7.7% | 10.9%(-3.20)#74 | 10.9%(-3.20)#4,514 |
| 75. | Burien | 7.8% | 10.9%(-3.10)#75 | 10.9%(-3.10)#4,589 |
| 76. | Moses Lake | 7.8% | 10.9%(-3.10)#76 | 10.9%(-3.10)#4,595 |
| 77. | Mukilteo | 7.8% | 10.9%(-3.10)#77 | 10.9%(-3.10)#4,599 |
| 78. | Sunnyside | 7.8% | 10.9%(-3.10)#78 | 10.9%(-3.10)#4,604 |
| 79. | Kelso | 7.8% | 10.9%(-3.10)#79 | 10.9%(-3.10)#4,608 |
| 80. | Finley | 7.8% | 10.9%(-3.10)#80 | 10.9%(-3.10)#4,622 |
| 81. | Royal City | 7.8% | 10.9%(-3.10)#81 | 10.9%(-3.10)#4,639 |
| 82. | Kitsap Lake | 7.8% | 10.9%(-3.10)#82 | 10.9%(-3.10)#4,640 |
| 83. | Mcchord Afb | 7.9% | 10.9%(-3.00)#83 | 10.9%(-3.00)#4,709 |
| 84. | Bainbridge Island | 8.0% | 10.9%(-2.90)#84 | 10.9%(-2.90)#4,755 |
| 85. | Sammamish | 8.1% | 10.9%(-2.80)#85 | 10.9%(-2.80)#4,807 |
| 86. | La Center | 8.1% | 10.9%(-2.80)#86 | 10.9%(-2.80)#4,851 |
| 87. | Bellevue | 8.4% | 10.9%(-2.50)#87 | 10.9%(-2.50)#5,034 |
| 88. | Bellingham | 8.4% | 10.9%(-2.50)#88 | 10.9%(-2.50)#5,036 |
| 89. | Mercer Island | 8.4% | 10.9%(-2.50)#89 | 10.9%(-2.50)#5,045 |
| 90. | Orting | 8.4% | 10.9%(-2.50)#90 | 10.9%(-2.50)#5,065 |
| 91. | Steilacoom | 8.4% | 10.9%(-2.50)#91 | 10.9%(-2.50)#5,074 |
| 92. | Silver Firs | 8.5% | 10.9%(-2.40)#92 | 10.9%(-2.40)#5,135 |
| 93. | Bangor Base | 8.6% | 10.9%(-2.30)#93 | 10.9%(-2.30)#5,244 |
| 94. | Stevenson | 8.6% | 10.9%(-2.30)#94 | 10.9%(-2.30)#5,261 |
| 95. | Lake Morton Berrydale | 8.7% | 10.9%(-2.20)#95 | 10.9%(-2.20)#5,329 |
| 96. | Harrington | 8.7% | 10.9%(-2.20)#96 | 10.9%(-2.20)#5,372 |
| 97. | Graham | 8.8% | 10.9%(-2.10)#97 | 10.9%(-2.10)#5,384 |
| 98. | Seattle | 8.9% | 10.9%(-2.00)#98 | 10.9%(-2.00)#5,467 |
| 99. | Battle Ground | 8.9% | 10.9%(-2.00)#99 | 10.9%(-2.00)#5,487 |
| 100. | Entiat | 8.9% | 10.9%(-2.00)#100 | 10.9%(-2.00)#5,530 |
Common Questions
What are the Top 10 Cities with the Lowest Unemployment Rate Amomg Youth Under the Age of 25 in Washington?
Top 10 Cities with the Lowest Unemployment Rate Amomg Youth Under the Age of 25 in Washington are:
#1
0.20%
#2
1.0%
#3
1.6%
#4
1.7%
#5
1.7%
#6
1.8%
#7
2.3%
#8
2.5%
#9
2.5%
#10
2.7%
What city has the Lowest Unemployment Rate Amomg Youth Under the Age of 25 in Washington?
Gig Harbor has the Lowest Unemployment Rate Amomg Youth Under the Age of 25 in Washington with 0.20%.
What is the Unemployment Rate Amomg Youth Under the Age of 25 in the State of Washington?
Unemployment Rate Amomg Youth Under the Age of 25 in Washington is 10.9%.
What is the Unemployment Rate Amomg Youth Under the Age of 25 in the United States?
Unemployment Rate Amomg Youth Under the Age of 25 in the United States is 10.9%.