Cities with the Highest Percentage of Jamaican Population in Washington
RELATED REPORTS & OPTIONS
Jamaican
Washington
Compare Cities
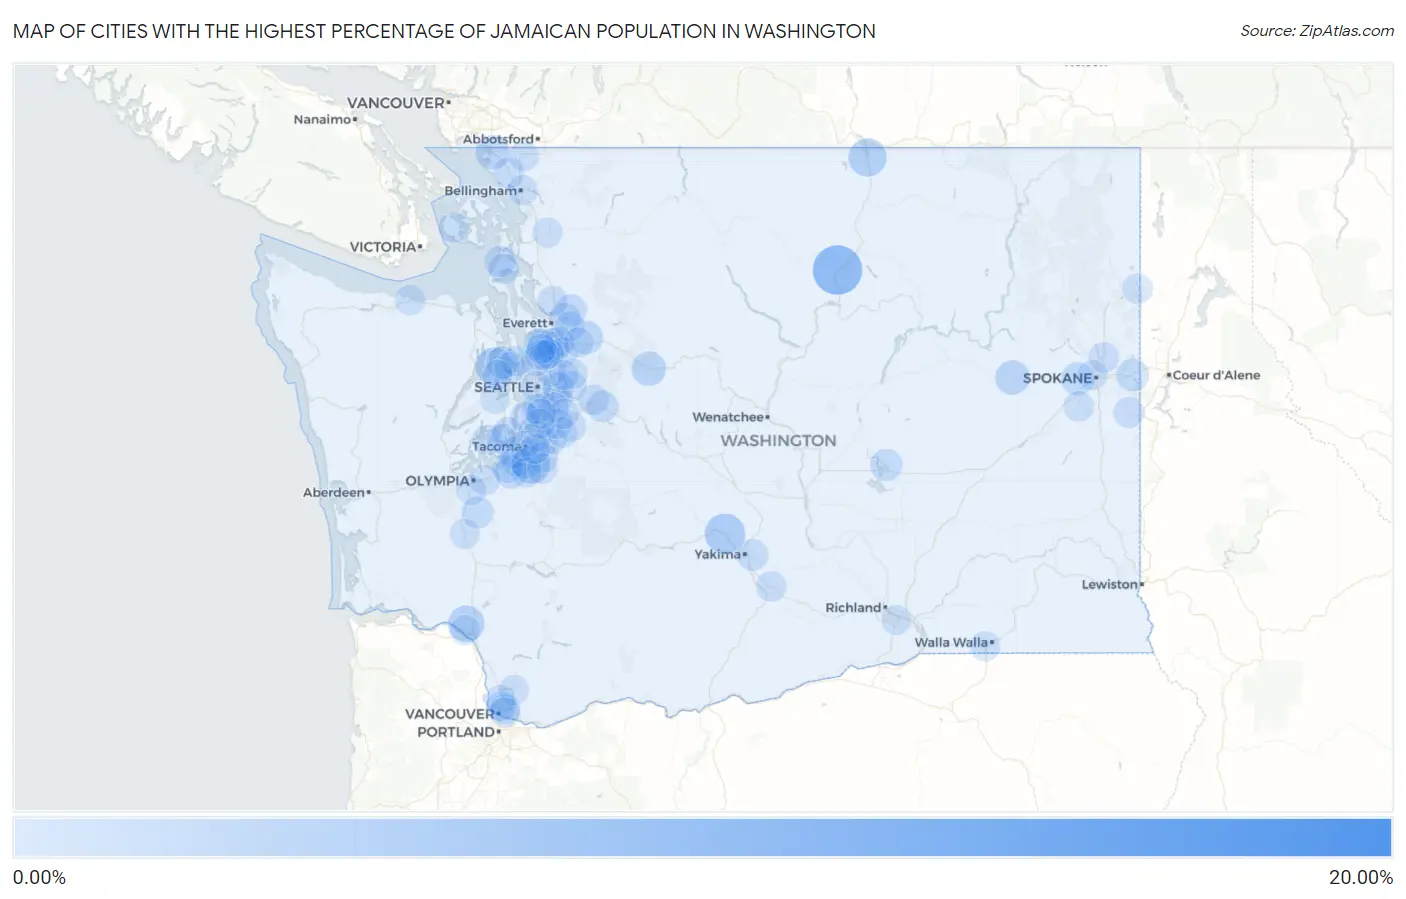
Map of Cities with the Highest Percentage of Jamaican Population in Washington
0.00%
20.00%
Cities with the Highest Percentage of Jamaican Population in Washington
| City | Jamaican | vs State | vs National | |
| 1. | Clear Lake Cdp Pierce County | 17.11% | 0.10%(+17.0)#1 | 0.36%(+16.7)#14 |
| 2. | Sunland Estates | 10.00% | 0.10%(+9.90)#2 | 0.36%(+9.64)#34 |
| 3. | Malott | 7.77% | 0.10%(+7.67)#3 | 0.36%(+7.40)#53 |
| 4. | Beacon Hill | 6.60% | 0.10%(+6.50)#4 | 0.36%(+6.23)#76 |
| 5. | Naches | 4.05% | 0.10%(+3.95)#5 | 0.36%(+3.69)#150 |
| 6. | Oroville | 3.14% | 0.10%(+3.04)#6 | 0.36%(+2.77)#218 |
| 7. | Clover Creek | 2.86% | 0.10%(+2.76)#7 | 0.36%(+2.49)#249 |
| 8. | Bangor Base | 2.81% | 0.10%(+2.71)#8 | 0.36%(+2.45)#254 |
| 9. | Longview Heights | 2.45% | 0.10%(+2.35)#9 | 0.36%(+2.09)#306 |
| 10. | Davenport | 1.73% | 0.10%(+1.63)#10 | 0.36%(+1.37)#468 |
| 11. | Skykomish | 1.72% | 0.10%(+1.62)#11 | 0.36%(+1.36)#475 |
| 12. | Blaine | 1.59% | 0.10%(+1.49)#12 | 0.36%(+1.22)#520 |
| 13. | Woods Creek | 1.33% | 0.10%(+1.23)#13 | 0.36%(+0.970)#622 |
| 14. | Airway Heights | 1.13% | 0.10%(+1.03)#14 | 0.36%(+0.762)#763 |
| 15. | Poulsbo | 0.97% | 0.10%(+0.872)#15 | 0.36%(+0.609)#881 |
| 16. | Tukwila | 0.91% | 0.10%(+0.813)#16 | 0.36%(+0.550)#928 |
| 17. | Fort Lewis | 0.87% | 0.10%(+0.770)#17 | 0.36%(+0.507)#973 |
| 18. | Liberty Lake | 0.86% | 0.10%(+0.765)#18 | 0.36%(+0.501)#978 |
| 19. | Moses Lake | 0.80% | 0.10%(+0.699)#19 | 0.36%(+0.435)#1,055 |
| 20. | Tenino | 0.73% | 0.10%(+0.633)#20 | 0.36%(+0.370)#1,137 |
| 21. | North Lynnwood | 0.73% | 0.10%(+0.626)#21 | 0.36%(+0.363)#1,147 |
| 22. | North Bend | 0.62% | 0.10%(+0.522)#22 | 0.36%(+0.259)#1,307 |
| 23. | Lake Stevens | 0.58% | 0.10%(+0.479)#23 | 0.36%(+0.216)#1,374 |
| 24. | Terrace Heights | 0.57% | 0.10%(+0.472)#24 | 0.36%(+0.209)#1,392 |
| 25. | Whidbey Island Station | 0.56% | 0.10%(+0.464)#25 | 0.36%(+0.200)#1,408 |
| 26. | Lochsloy | 0.52% | 0.10%(+0.422)#26 | 0.36%(+0.159)#1,483 |
| 27. | Mill Creek | 0.51% | 0.10%(+0.414)#27 | 0.36%(+0.151)#1,497 |
| 28. | University Place | 0.41% | 0.10%(+0.306)#28 | 0.36%(+0.043)#1,734 |
| 29. | Mill Creek East | 0.40% | 0.10%(+0.295)#29 | 0.36%(+0.032)#1,762 |
| 30. | Ferndale | 0.32% | 0.10%(+0.224)#30 | 0.36%(-0.040)#1,995 |
| 31. | Suquamish | 0.30% | 0.10%(+0.200)#31 | 0.36%(-0.063)#2,070 |
| 32. | Silver Firs | 0.27% | 0.10%(+0.170)#32 | 0.36%(-0.094)#2,208 |
| 33. | Lakewood | 0.27% | 0.10%(+0.169)#33 | 0.36%(-0.094)#2,211 |
| 34. | Meadowdale | 0.27% | 0.10%(+0.167)#34 | 0.36%(-0.096)#2,221 |
| 35. | North Fort Lewis | 0.27% | 0.10%(+0.165)#35 | 0.36%(-0.098)#2,229 |
| 36. | Auburn | 0.27% | 0.10%(+0.165)#36 | 0.36%(-0.098)#2,234 |
| 37. | Snoqualmie | 0.24% | 0.10%(+0.140)#37 | 0.36%(-0.124)#2,330 |
| 38. | Gig Harbor | 0.23% | 0.10%(+0.135)#38 | 0.36%(-0.129)#2,367 |
| 39. | Marysville | 0.23% | 0.10%(+0.134)#39 | 0.36%(-0.129)#2,373 |
| 40. | Rockford | 0.23% | 0.10%(+0.132)#40 | 0.36%(-0.131)#2,382 |
| 41. | Sammamish | 0.21% | 0.10%(+0.113)#41 | 0.36%(-0.150)#2,482 |
| 42. | Bellevue | 0.21% | 0.10%(+0.113)#42 | 0.36%(-0.150)#2,483 |
| 43. | Mead | 0.20% | 0.10%(+0.095)#43 | 0.36%(-0.168)#2,555 |
| 44. | Newcastle | 0.19% | 0.10%(+0.085)#44 | 0.36%(-0.178)#2,617 |
| 45. | Oak Harbor | 0.18% | 0.10%(+0.080)#45 | 0.36%(-0.184)#2,655 |
| 46. | Union Hill Novelty Hill | 0.18% | 0.10%(+0.077)#46 | 0.36%(-0.187)#2,672 |
| 47. | Lakeland South | 0.17% | 0.10%(+0.074)#47 | 0.36%(-0.189)#2,683 |
| 48. | Kirkland | 0.17% | 0.10%(+0.069)#48 | 0.36%(-0.194)#2,717 |
| 49. | Vashon | 0.16% | 0.10%(+0.064)#49 | 0.36%(-0.199)#2,742 |
| 50. | Zillah | 0.16% | 0.10%(+0.058)#50 | 0.36%(-0.205)#2,786 |
| 51. | Puyallup | 0.15% | 0.10%(+0.045)#51 | 0.36%(-0.218)#2,869 |
| 52. | Maple Valley | 0.14% | 0.10%(+0.043)#52 | 0.36%(-0.220)#2,890 |
| 53. | Parkland | 0.14% | 0.10%(+0.042)#53 | 0.36%(-0.221)#2,899 |
| 54. | Indianola | 0.14% | 0.10%(+0.040)#54 | 0.36%(-0.223)#2,908 |
| 55. | Newport | 0.14% | 0.10%(+0.040)#55 | 0.36%(-0.223)#2,911 |
| 56. | Federal Way | 0.14% | 0.10%(+0.036)#56 | 0.36%(-0.227)#2,936 |
| 57. | Port Angeles | 0.13% | 0.10%(+0.030)#57 | 0.36%(-0.234)#2,981 |
| 58. | Lacey | 0.13% | 0.10%(+0.028)#58 | 0.36%(-0.236)#2,997 |
| 59. | Tacoma | 0.13% | 0.10%(+0.026)#59 | 0.36%(-0.237)#3,013 |
| 60. | Bellingham | 0.12% | 0.10%(+0.017)#60 | 0.36%(-0.246)#3,078 |
| 61. | Cheney | 0.11% | 0.10%(+0.009)#61 | 0.36%(-0.255)#3,160 |
| 62. | Lake Morton Berrydale | 0.11% | 0.10%(+0.005)#62 | 0.36%(-0.258)#3,187 |
| 63. | Seattle | 0.10% | 0.10%(+0.003)#63 | 0.36%(-0.261)#3,206 |
| 64. | Spokane | 0.10% | 0.10%(+0.001)#64 | 0.36%(-0.263)#3,225 |
| 65. | Shoreline | 0.090% | 0.10%(-0.010)#65 | 0.36%(-0.273)#3,317 |
| 66. | Salmon Creek | 0.089% | 0.10%(-0.012)#66 | 0.36%(-0.275)#3,328 |
| 67. | Renton | 0.084% | 0.10%(-0.016)#67 | 0.36%(-0.279)#3,361 |
| 68. | Bremerton | 0.082% | 0.10%(-0.018)#68 | 0.36%(-0.282)#3,382 |
| 69. | Kent | 0.081% | 0.10%(-0.019)#69 | 0.36%(-0.282)#3,385 |
| 70. | Maltby | 0.079% | 0.10%(-0.021)#70 | 0.36%(-0.284)#3,399 |
| 71. | Tumwater | 0.078% | 0.10%(-0.022)#71 | 0.36%(-0.286)#3,411 |
| 72. | Spanaway | 0.076% | 0.10%(-0.024)#72 | 0.36%(-0.287)#3,430 |
| 73. | Friday Harbor | 0.076% | 0.10%(-0.025)#73 | 0.36%(-0.288)#3,442 |
| 74. | Minnehaha | 0.069% | 0.10%(-0.031)#74 | 0.36%(-0.295)#3,507 |
| 75. | Everett | 0.066% | 0.10%(-0.034)#75 | 0.36%(-0.298)#3,528 |
| 76. | Sedro Woolley | 0.064% | 0.10%(-0.036)#76 | 0.36%(-0.299)#3,549 |
| 77. | South Hill | 0.060% | 0.10%(-0.040)#77 | 0.36%(-0.303)#3,590 |
| 78. | Home | 0.059% | 0.10%(-0.041)#78 | 0.36%(-0.304)#3,606 |
| 79. | Maple Heights Lake Desire | 0.058% | 0.10%(-0.042)#79 | 0.36%(-0.305)#3,617 |
| 80. | Centralia | 0.049% | 0.10%(-0.051)#80 | 0.36%(-0.314)#3,714 |
| 81. | Mountlake Terrace | 0.047% | 0.10%(-0.053)#81 | 0.36%(-0.317)#3,737 |
| 82. | Fairwood Cdp King County | 0.043% | 0.10%(-0.057)#82 | 0.36%(-0.321)#3,778 |
| 83. | Redmond | 0.042% | 0.10%(-0.058)#83 | 0.36%(-0.322)#3,790 |
| 84. | College Place | 0.041% | 0.10%(-0.059)#84 | 0.36%(-0.323)#3,804 |
| 85. | Bothell West | 0.039% | 0.10%(-0.061)#85 | 0.36%(-0.325)#3,819 |
| 86. | Fife | 0.037% | 0.10%(-0.063)#86 | 0.36%(-0.327)#3,849 |
| 87. | Artondale | 0.036% | 0.10%(-0.064)#87 | 0.36%(-0.328)#3,854 |
| 88. | Des Moines | 0.031% | 0.10%(-0.070)#88 | 0.36%(-0.333)#3,912 |
| 89. | Silverdale | 0.023% | 0.10%(-0.077)#89 | 0.36%(-0.341)#3,973 |
| 90. | Longview | 0.021% | 0.10%(-0.079)#90 | 0.36%(-0.342)#3,995 |
| 91. | Monroe | 0.020% | 0.10%(-0.080)#91 | 0.36%(-0.343)#4,002 |
| 92. | Lynden | 0.019% | 0.10%(-0.081)#92 | 0.36%(-0.345)#4,023 |
| 93. | Brier | 0.015% | 0.10%(-0.085)#93 | 0.36%(-0.348)#4,066 |
| 94. | Hazel Dell | 0.013% | 0.10%(-0.087)#94 | 0.36%(-0.350)#4,089 |
| 95. | Lynnwood | 0.013% | 0.10%(-0.088)#95 | 0.36%(-0.351)#4,098 |
| 96. | Battle Ground | 0.0096% | 0.10%(-0.091)#96 | 0.36%(-0.354)#4,115 |
| 97. | Burien | 0.0039% | 0.10%(-0.096)#97 | 0.36%(-0.360)#4,141 |
| 98. | Vancouver | 0.0037% | 0.10%(-0.097)#98 | 0.36%(-0.360)#4,142 |
| 99. | Seatac | 0.0032% | 0.10%(-0.097)#99 | 0.36%(-0.360)#4,145 |
| 100. | Kennewick | 0.0024% | 0.10%(-0.098)#100 | 0.36%(-0.361)#4,147 |
Common Questions
What are the Top 10 Cities with the Highest Percentage of Jamaican Population in Washington?
Top 10 Cities with the Highest Percentage of Jamaican Population in Washington are:
#1
7.77%
#2
4.05%
#3
3.14%
#4
2.86%
#5
2.81%
#6
2.45%
#7
1.73%
#8
1.72%
#9
1.59%
#10
1.33%
What city has the Highest Percentage of Jamaican Population in Washington?
Malott has the Highest Percentage of Jamaican Population in Washington with 7.77%.
What is the Percentage of Jamaican Population in the State of Washington?
Percentage of Jamaican Population in Washington is 0.10%.
What is the Percentage of Jamaican Population in the United States?
Percentage of Jamaican Population in the United States is 0.36%.