Cities with the Most Immigrants from Laos in Washington
RELATED REPORTS & OPTIONS
Laos
Washington
Compare Cities
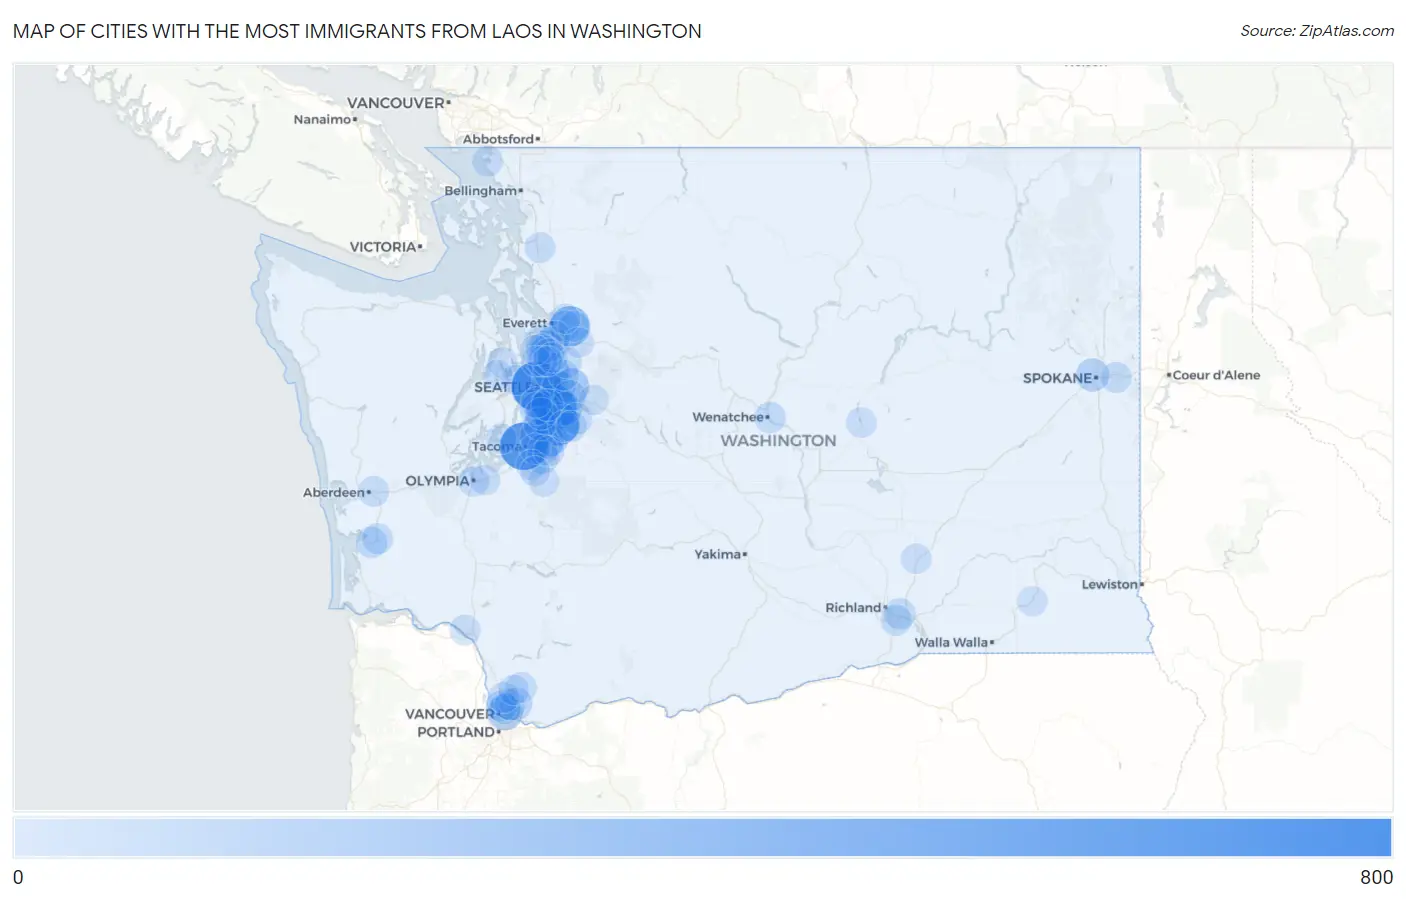
Map of Cities with the Most Immigrants from Laos in Washington
0
800
Cities with the Most Immigrants from Laos in Washington
| City | Laos | vs State | vs National | |
| 1. | Seattle | 619 | 5,926(10.45%)#1 | 174,982(0.35%)#43 |
| 2. | Tacoma | 555 | 5,926(9.37%)#2 | 174,982(0.32%)#49 |
| 3. | Renton | 483 | 5,926(8.15%)#3 | 174,982(0.28%)#57 |
| 4. | Kent | 438 | 5,926(7.39%)#4 | 174,982(0.25%)#64 |
| 5. | Everett | 318 | 5,926(5.37%)#5 | 174,982(0.18%)#89 |
| 6. | Kirkland | 189 | 5,926(3.19%)#6 | 174,982(0.11%)#142 |
| 7. | Sammamish | 177 | 5,926(2.99%)#7 | 174,982(0.10%)#153 |
| 8. | Vancouver | 166 | 5,926(2.80%)#8 | 174,982(0.09%)#159 |
| 9. | Auburn | 127 | 5,926(2.14%)#9 | 174,982(0.07%)#221 |
| 10. | Tukwila | 120 | 5,926(2.02%)#10 | 174,982(0.07%)#234 |
| 11. | Bellevue | 117 | 5,926(1.97%)#11 | 174,982(0.07%)#243 |
| 12. | Mill Creek | 112 | 5,926(1.89%)#12 | 174,982(0.06%)#251 |
| 13. | East Renton Highlands | 108 | 5,926(1.82%)#13 | 174,982(0.06%)#256 |
| 14. | Algona | 107 | 5,926(1.81%)#14 | 174,982(0.06%)#261 |
| 15. | Spokane | 97 | 5,926(1.64%)#15 | 174,982(0.06%)#283 |
| 16. | Federal Way | 96 | 5,926(1.62%)#16 | 174,982(0.05%)#286 |
| 17. | Burien | 88 | 5,926(1.48%)#17 | 174,982(0.05%)#309 |
| 18. | Des Moines | 87 | 5,926(1.47%)#18 | 174,982(0.05%)#313 |
| 19. | Orchards | 64 | 5,926(1.08%)#19 | 174,982(0.04%)#410 |
| 20. | Larch Way | 64 | 5,926(1.08%)#20 | 174,982(0.04%)#411 |
| 21. | Puyallup | 63 | 5,926(1.06%)#21 | 174,982(0.04%)#415 |
| 22. | Issaquah | 62 | 5,926(1.05%)#22 | 174,982(0.04%)#419 |
| 23. | Seatac | 58 | 5,926(0.98%)#23 | 174,982(0.03%)#443 |
| 24. | Bryn Mawr Skyway | 54 | 5,926(0.91%)#24 | 174,982(0.03%)#464 |
| 25. | Hobart | 48 | 5,926(0.81%)#25 | 174,982(0.03%)#511 |
| 26. | Bunk Foss | 46 | 5,926(0.78%)#26 | 174,982(0.03%)#529 |
| 27. | East Wenatchee | 41 | 5,926(0.69%)#27 | 174,982(0.02%)#574 |
| 28. | South Bend | 41 | 5,926(0.69%)#28 | 174,982(0.02%)#576 |
| 29. | Pasco | 39 | 5,926(0.66%)#29 | 174,982(0.02%)#594 |
| 30. | Covington | 36 | 5,926(0.61%)#30 | 174,982(0.02%)#631 |
| 31. | Fairwood Cdp King County | 34 | 5,926(0.57%)#31 | 174,982(0.02%)#650 |
| 32. | Kennewick | 32 | 5,926(0.54%)#32 | 174,982(0.02%)#669 |
| 33. | Minnehaha | 31 | 5,926(0.52%)#33 | 174,982(0.02%)#685 |
| 34. | Alderwood Manor | 30 | 5,926(0.51%)#34 | 174,982(0.02%)#696 |
| 35. | Cottage Lake | 28 | 5,926(0.47%)#35 | 174,982(0.02%)#724 |
| 36. | Spokane Valley | 27 | 5,926(0.46%)#36 | 174,982(0.02%)#739 |
| 37. | Hazel Dell | 27 | 5,926(0.46%)#37 | 174,982(0.02%)#751 |
| 38. | Five Corners | 27 | 5,926(0.46%)#38 | 174,982(0.02%)#752 |
| 39. | Venersborg | 26 | 5,926(0.44%)#39 | 174,982(0.01%)#782 |
| 40. | Raymond | 26 | 5,926(0.44%)#40 | 174,982(0.01%)#783 |
| 41. | Longview | 25 | 5,926(0.42%)#41 | 174,982(0.01%)#791 |
| 42. | Birch Bay | 25 | 5,926(0.42%)#42 | 174,982(0.01%)#798 |
| 43. | Mount Vista | 25 | 5,926(0.42%)#43 | 174,982(0.01%)#800 |
| 44. | Picnic Point | 25 | 5,926(0.42%)#44 | 174,982(0.01%)#802 |
| 45. | Maple Valley | 24 | 5,926(0.40%)#45 | 174,982(0.01%)#821 |
| 46. | Edgewood | 24 | 5,926(0.40%)#46 | 174,982(0.01%)#823 |
| 47. | Mount Vernon | 23 | 5,926(0.39%)#47 | 174,982(0.01%)#835 |
| 48. | Eastmont | 23 | 5,926(0.39%)#48 | 174,982(0.01%)#838 |
| 49. | Olympia | 22 | 5,926(0.37%)#49 | 174,982(0.01%)#852 |
| 50. | Snohomish | 22 | 5,926(0.37%)#50 | 174,982(0.01%)#859 |
| 51. | Aberdeen | 19 | 5,926(0.32%)#51 | 174,982(0.01%)#912 |
| 52. | Redmond | 18 | 5,926(0.30%)#52 | 174,982(0.01%)#925 |
| 53. | Graham | 17 | 5,926(0.29%)#53 | 174,982(0.01%)#969 |
| 54. | Lynnwood | 15 | 5,926(0.25%)#54 | 174,982(0.01%)#1,024 |
| 55. | Poulsbo | 15 | 5,926(0.25%)#55 | 174,982(0.01%)#1,034 |
| 56. | Fife | 14 | 5,926(0.24%)#56 | 174,982(0.01%)#1,062 |
| 57. | Clover Creek | 14 | 5,926(0.24%)#57 | 174,982(0.01%)#1,064 |
| 58. | Bothell West | 13 | 5,926(0.22%)#58 | 174,982(0.01%)#1,081 |
| 59. | Artondale | 13 | 5,926(0.22%)#59 | 174,982(0.01%)#1,084 |
| 60. | Bainbridge Island | 12 | 5,926(0.20%)#60 | 174,982(0.01%)#1,121 |
| 61. | White Center | 12 | 5,926(0.20%)#61 | 174,982(0.01%)#1,125 |
| 62. | Lake Forest Park | 11 | 5,926(0.19%)#62 | 174,982(0.01%)#1,165 |
| 63. | Sumner | 11 | 5,926(0.19%)#63 | 174,982(0.01%)#1,166 |
| 64. | Shoreline | 10 | 5,926(0.17%)#64 | 174,982(0.01%)#1,195 |
| 65. | Battle Ground | 10 | 5,926(0.17%)#65 | 174,982(0.01%)#1,209 |
| 66. | Monroe | 10 | 5,926(0.17%)#66 | 174,982(0.01%)#1,210 |
| 67. | Mesa | 10 | 5,926(0.17%)#67 | 174,982(0.01%)#1,235 |
| 68. | Lacey | 9 | 5,926(0.15%)#68 | 174,982(0.01%)#1,241 |
| 69. | Silverdale | 8 | 5,926(0.13%)#69 | 174,982(0.00%)#1,294 |
| 70. | Soap Lake | 8 | 5,926(0.13%)#70 | 174,982(0.00%)#1,315 |
| 71. | Snoqualmie | 7 | 5,926(0.12%)#71 | 174,982(0.00%)#1,332 |
| 72. | Bothell | 6 | 5,926(0.10%)#72 | 174,982(0.00%)#1,366 |
| 73. | Edmonds | 5 | 5,926(0.08%)#73 | 174,982(0.00%)#1,403 |
| 74. | Lake Stevens | 5 | 5,926(0.08%)#74 | 174,982(0.00%)#1,405 |
| 75. | Frederickson | 4 | 5,926(0.07%)#75 | 174,982(0.00%)#1,451 |
| 76. | Kenmore | 2 | 5,926(0.03%)#76 | 174,982(0.00%)#1,524 |
| 77. | Dayton | 2 | 5,926(0.03%)#77 | 174,982(0.00%)#1,535 |
Common Questions
What are the Top 10 Cities with the Most Immigrants from Laos in Washington?
Top 10 Cities with the Most Immigrants from Laos in Washington are:
What city has the Most Immigrants from Laos in Washington?
Seattle has the Most Immigrants from Laos in Washington with 619.
What is the Total Immigrants from Laos in the State of Washington?
Total Immigrants from Laos in Washington is 5,926.
What is the Total Immigrants from Laos in the United States?
Total Immigrants from Laos in the United States is 174,982.