Clarkston, WA Map & Demographics
Clarkston Map
Clarkston Overview
$28,722
PER CAPITA INCOME
$66,083
AVG FAMILY INCOME
$48,587
AVG HOUSEHOLD INCOME
12.9%
WAGE / INCOME GAP [ % ]
87.1¢/ $1
WAGE / INCOME GAP [ $ ]
0.45
INEQUALITY / GINI INDEX
7,222
TOTAL POPULATION
3,629
MALE POPULATION
3,593
FEMALE POPULATION
101.00
MALES / 100 FEMALES
99.01
FEMALES / 100 MALES
36.2
MEDIAN AGE
3.3
AVG FAMILY SIZE
2.5
AVG HOUSEHOLD SIZE
3,641
LABOR FORCE [ PEOPLE ]
62.9%
PERCENT IN LABOR FORCE
9.9%
UNEMPLOYMENT RATE
Clarkston Zip Codes
Clarkston Area Codes
Income in Clarkston
Income Overview in Clarkston
Per Capita Income in Clarkston is $28,722, while median incomes of families and households are $66,083 and $48,587 respectively.
| Characteristic | Number | Measure |
| Per Capita Income | 7,222 | $28,722 |
| Median Family Income | 1,461 | $66,083 |
| Mean Family Income | 1,461 | $80,031 |
| Median Household Income | 2,846 | $48,587 |
| Mean Household Income | 2,846 | $70,059 |
| Income Deficit | 1,461 | $0 |
| Wage / Income Gap (%) | 7,222 | 12.88% |
| Wage / Income Gap ($) | 7,222 | 87.12¢ per $1 |
| Gini / Inequality Index | 7,222 | 0.45 |
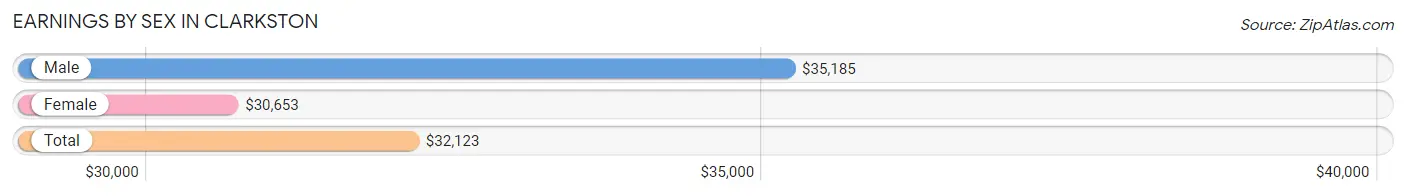
Earnings by Sex in Clarkston
Average Earnings in Clarkston are $32,123, $35,185 for men and $30,653 for women, a difference of 12.9%.
| Sex | Number | Average Earnings |
| Male | 1,832 (51.1%) | $35,185 |
| Female | 1,755 (48.9%) | $30,653 |
| Total | 3,587 (100.0%) | $32,123 |
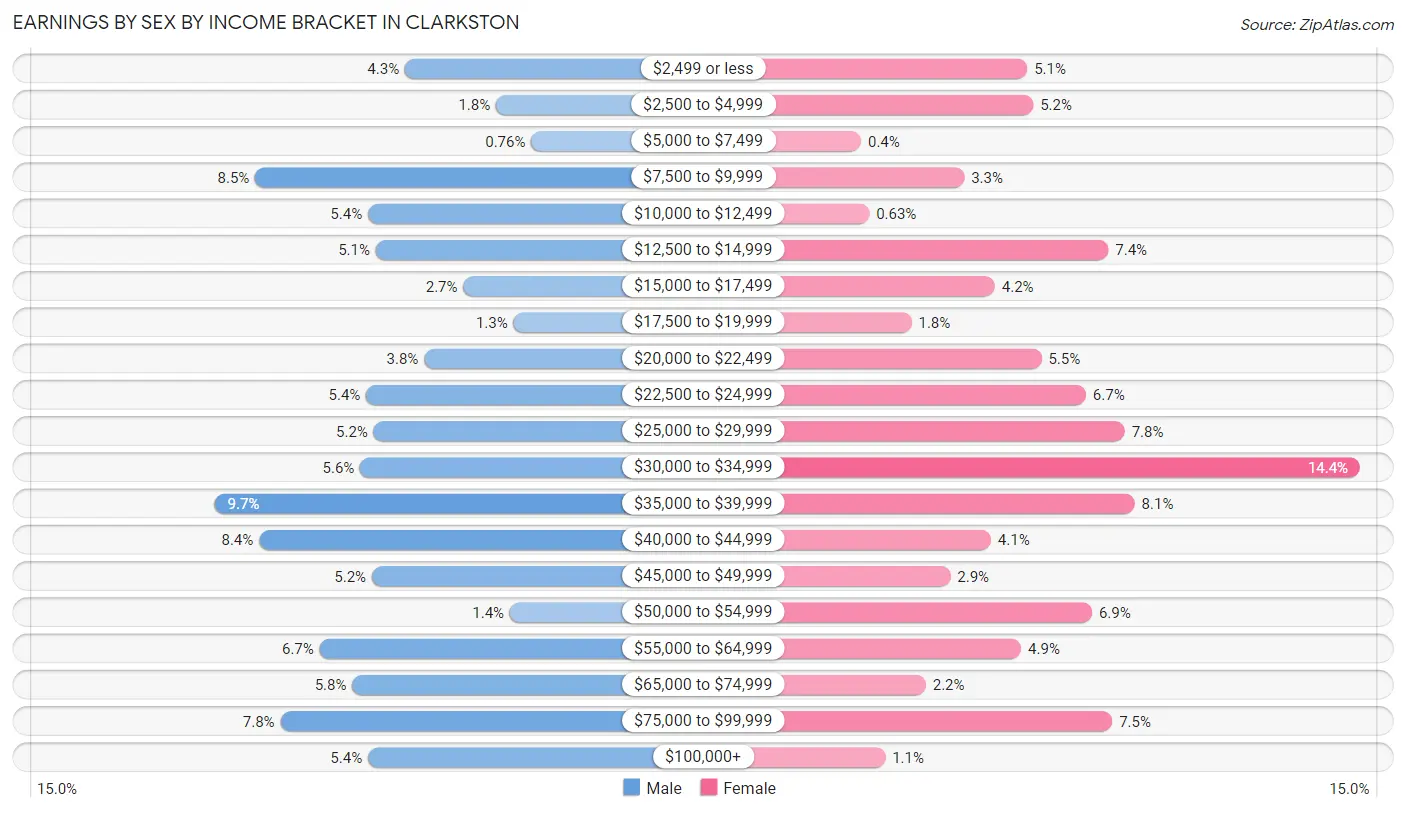
Earnings by Sex by Income Bracket in Clarkston
The most common earnings brackets in Clarkston are $35,000 to $39,999 for men (177 | 9.7%) and $30,000 to $34,999 for women (253 | 14.4%).
| Income | Male | Female |
| $2,499 or less | 79 (4.3%) | 89 (5.1%) |
| $2,500 to $4,999 | 32 (1.8%) | 92 (5.2%) |
| $5,000 to $7,499 | 14 (0.8%) | 7 (0.4%) |
| $7,500 to $9,999 | 156 (8.5%) | 58 (3.3%) |
| $10,000 to $12,499 | 98 (5.3%) | 11 (0.6%) |
| $12,500 to $14,999 | 94 (5.1%) | 129 (7.3%) |
| $15,000 to $17,499 | 49 (2.7%) | 73 (4.2%) |
| $17,500 to $19,999 | 23 (1.3%) | 32 (1.8%) |
| $20,000 to $22,499 | 69 (3.8%) | 96 (5.5%) |
| $22,500 to $24,999 | 99 (5.4%) | 118 (6.7%) |
| $25,000 to $29,999 | 95 (5.2%) | 137 (7.8%) |
| $30,000 to $34,999 | 102 (5.6%) | 253 (14.4%) |
| $35,000 to $39,999 | 177 (9.7%) | 142 (8.1%) |
| $40,000 to $44,999 | 154 (8.4%) | 71 (4.1%) |
| $45,000 to $49,999 | 96 (5.2%) | 51 (2.9%) |
| $50,000 to $54,999 | 25 (1.4%) | 121 (6.9%) |
| $55,000 to $64,999 | 123 (6.7%) | 86 (4.9%) |
| $65,000 to $74,999 | 106 (5.8%) | 39 (2.2%) |
| $75,000 to $99,999 | 143 (7.8%) | 131 (7.5%) |
| $100,000+ | 98 (5.3%) | 19 (1.1%) |
| Total | 1,832 (100.0%) | 1,755 (100.0%) |
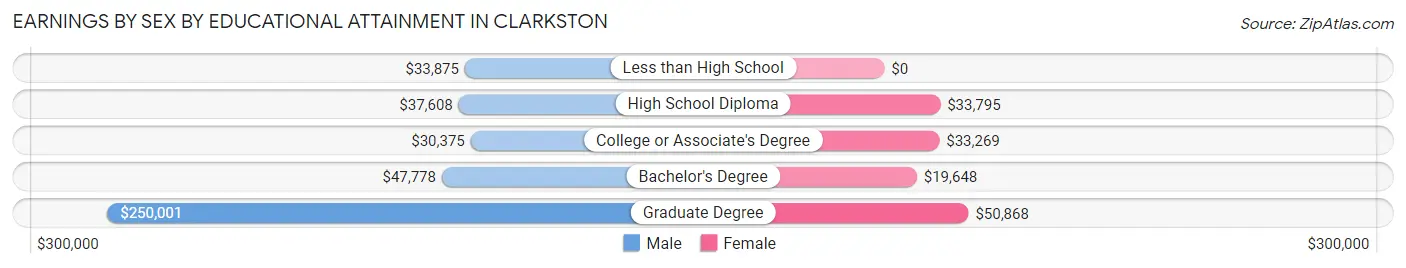
Earnings by Sex by Educational Attainment in Clarkston
Average earnings in Clarkston are $37,945 for men and $33,088 for women, a difference of 12.8%. Men with an educational attainment of graduate degree enjoy the highest average annual earnings of $250,001, while those with college or associate's degree education earn the least with $30,375. Women with an educational attainment of graduate degree earn the most with the average annual earnings of $50,868, while those with bachelor's degree education have the smallest earnings of $19,648.
| Educational Attainment | Male Income | Female Income |
| Less than High School | $33,875 | $0 |
| High School Diploma | $37,608 | $33,795 |
| College or Associate's Degree | $30,375 | $33,269 |
| Bachelor's Degree | $47,778 | $19,648 |
| Graduate Degree | $250,001 | $50,868 |
| Total | $37,945 | $33,088 |
Family Income in Clarkston
Family Income Brackets in Clarkston
According to the Clarkston family income data, there are 392 families falling into the $100,000 to $149,999 income range, which is the most common income bracket and makes up 26.8% of all families. Conversely, the $10,000 to $14,999 income bracket is the least frequent group with only 15 families (1.0%) belonging to this category.
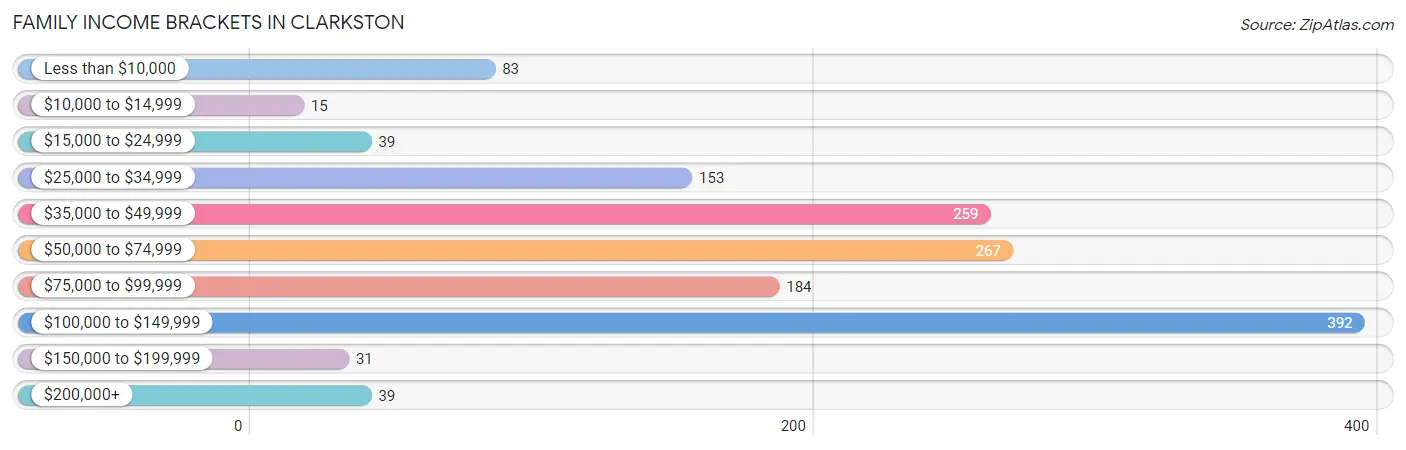
| Income Bracket | # Families | % Families |
| Less than $10,000 | 83 | 5.7% |
| $10,000 to $14,999 | 15 | 1.0% |
| $15,000 to $24,999 | 39 | 2.7% |
| $25,000 to $34,999 | 153 | 10.5% |
| $35,000 to $49,999 | 259 | 17.7% |
| $50,000 to $74,999 | 267 | 18.3% |
| $75,000 to $99,999 | 184 | 12.6% |
| $100,000 to $149,999 | 392 | 26.8% |
| $150,000 to $199,999 | 31 | 2.1% |
| $200,000+ | 39 | 2.7% |
Family Income by Famaliy Size in Clarkston
3-person families (441 | 30.2%) account for the highest median family income in Clarkston with $101,507 per family, while 3-person families (441 | 30.2%) have the highest median income of $33,836 per family member.
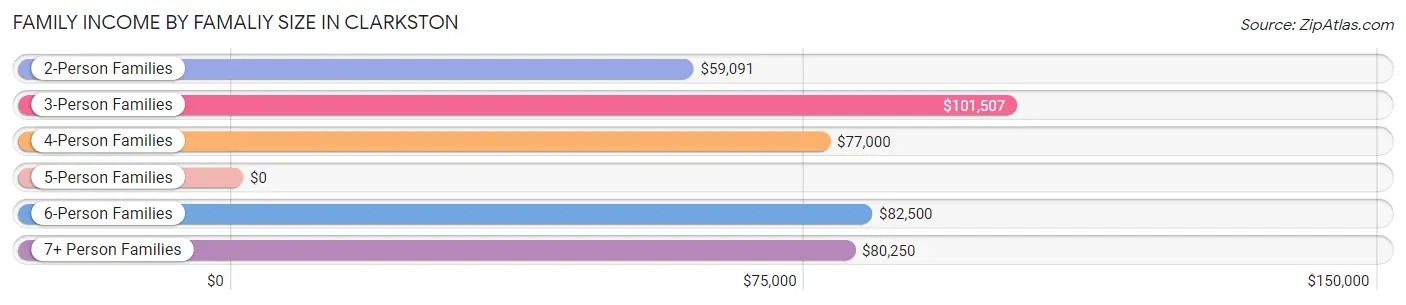
| Income Bracket | # Families | Median Income |
| 2-Person Families | 500 (34.2%) | $59,091 |
| 3-Person Families | 441 (30.2%) | $101,507 |
| 4-Person Families | 330 (22.6%) | $77,000 |
| 5-Person Families | 105 (7.2%) | $0 |
| 6-Person Families | 40 (2.7%) | $82,500 |
| 7+ Person Families | 45 (3.1%) | $80,250 |
| Total | 1,461 (100.0%) | $66,083 |
Family Income by Number of Earners in Clarkston
The median family income in Clarkston is $66,083, with families comprising 2 earners (582) having the highest median family income of $103,925, while families with no earners (254) have the lowest median family income of $32,365, accounting for 39.8% and 17.4% of families, respectively.
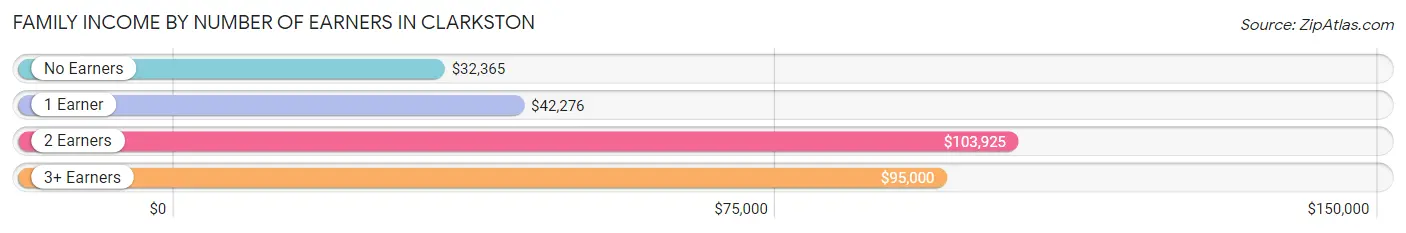
| Number of Earners | # Families | Median Income |
| No Earners | 254 (17.4%) | $32,365 |
| 1 Earner | 499 (34.2%) | $42,276 |
| 2 Earners | 582 (39.8%) | $103,925 |
| 3+ Earners | 126 (8.6%) | $95,000 |
| Total | 1,461 (100.0%) | $66,083 |
Household Income in Clarkston
Household Income Brackets in Clarkston
With 552 households falling in the category, the $35,000 to $49,999 income range is the most frequent in Clarkston, accounting for 19.4% of all households. In contrast, only 60 households (2.1%) fall into the $200,000+ income bracket, making it the least populous group.
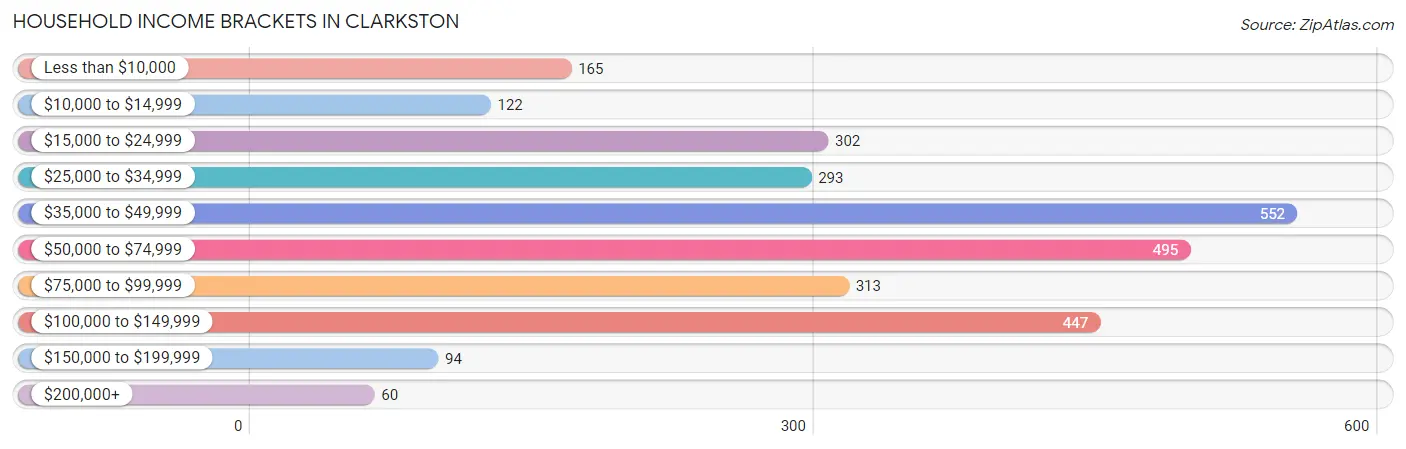
| Income Bracket | # Households | % Households |
| Less than $10,000 | 165 | 5.8% |
| $10,000 to $14,999 | 122 | 4.3% |
| $15,000 to $24,999 | 302 | 10.6% |
| $25,000 to $34,999 | 293 | 10.3% |
| $35,000 to $49,999 | 552 | 19.4% |
| $50,000 to $74,999 | 495 | 17.4% |
| $75,000 to $99,999 | 313 | 11.0% |
| $100,000 to $149,999 | 447 | 15.7% |
| $150,000 to $199,999 | 94 | 3.3% |
| $200,000+ | 60 | 2.1% |
Household Income by Householder Age in Clarkston
The median household income in Clarkston is $48,587, with the highest median household income of $64,167 found in the 25 to 44 years age bracket for the primary householder. A total of 892 households (31.3%) fall into this category. Meanwhile, the 15 to 24 years age bracket for the primary householder has the lowest median household income of $37,215, with 243 households (8.5%) in this group.
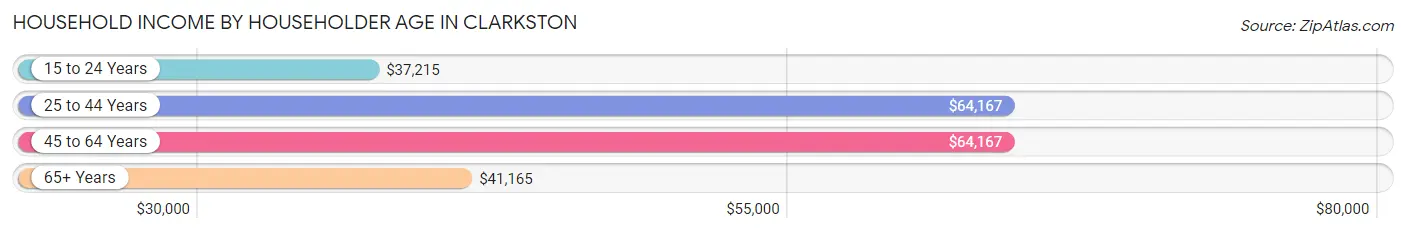
| Income Bracket | # Households | Median Income |
| 15 to 24 Years | 243 (8.5%) | $37,215 |
| 25 to 44 Years | 892 (31.3%) | $64,167 |
| 45 to 64 Years | 944 (33.2%) | $64,167 |
| 65+ Years | 767 (27.0%) | $41,165 |
| Total | 2,846 (100.0%) | $48,587 |
Poverty in Clarkston
Income Below Poverty by Sex and Age in Clarkston
With 14.7% poverty level for males and 22.6% for females among the residents of Clarkston, 15 year old males and 6 to 11 year old females are the most vulnerable to poverty, with 31 males (75.6%) and 65 females (52.0%) in their respective age groups living below the poverty level.
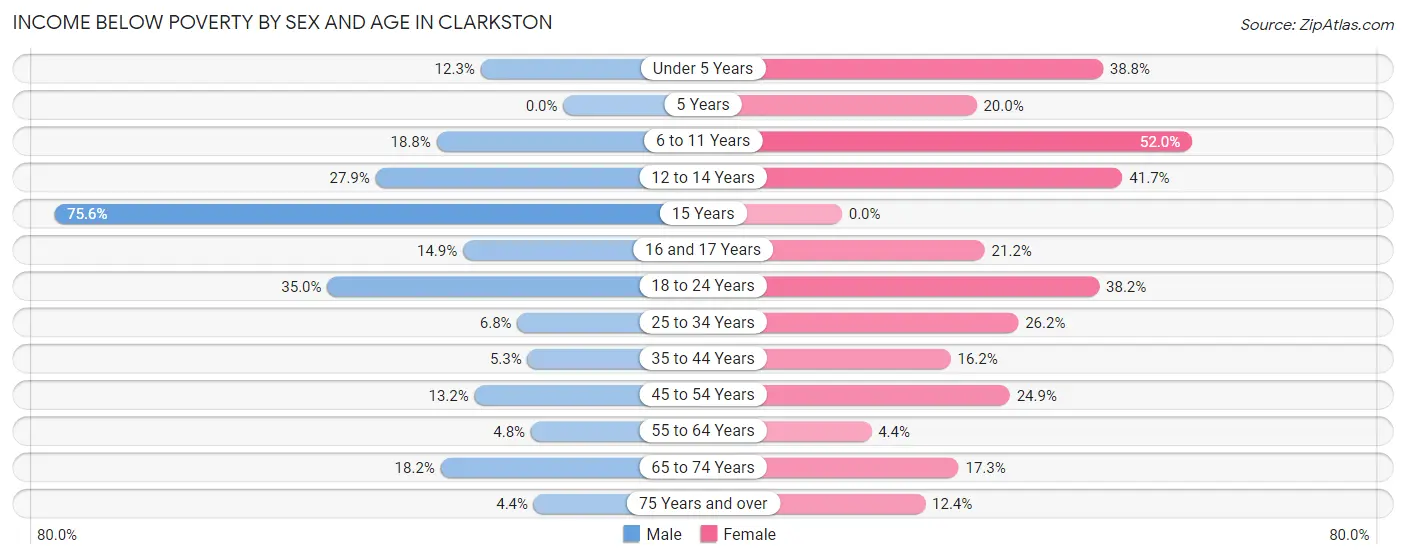
| Age Bracket | Male | Female |
| Under 5 Years | 41 (12.3%) | 107 (38.8%) |
| 5 Years | 0 (0.0%) | 15 (20.0%) |
| 6 to 11 Years | 48 (18.8%) | 65 (52.0%) |
| 12 to 14 Years | 29 (27.9%) | 30 (41.7%) |
| 15 Years | 31 (75.6%) | 0 (0.0%) |
| 16 and 17 Years | 7 (14.9%) | 28 (21.2%) |
| 18 to 24 Years | 192 (35.0%) | 128 (38.2%) |
| 25 to 34 Years | 36 (6.8%) | 109 (26.2%) |
| 35 to 44 Years | 25 (5.3%) | 105 (16.2%) |
| 45 to 54 Years | 38 (13.2%) | 98 (24.9%) |
| 55 to 64 Years | 21 (4.8%) | 18 (4.4%) |
| 65 to 74 Years | 43 (18.2%) | 73 (17.3%) |
| 75 Years and over | 7 (4.4%) | 23 (12.4%) |
| Total | 518 (14.7%) | 799 (22.6%) |
Income Above Poverty by Sex and Age in Clarkston
According to the poverty statistics in Clarkston, males aged 5 years and females aged 15 years are the age groups that are most secure financially, with 100.0% of males and 100.0% of females in these age groups living above the poverty line.
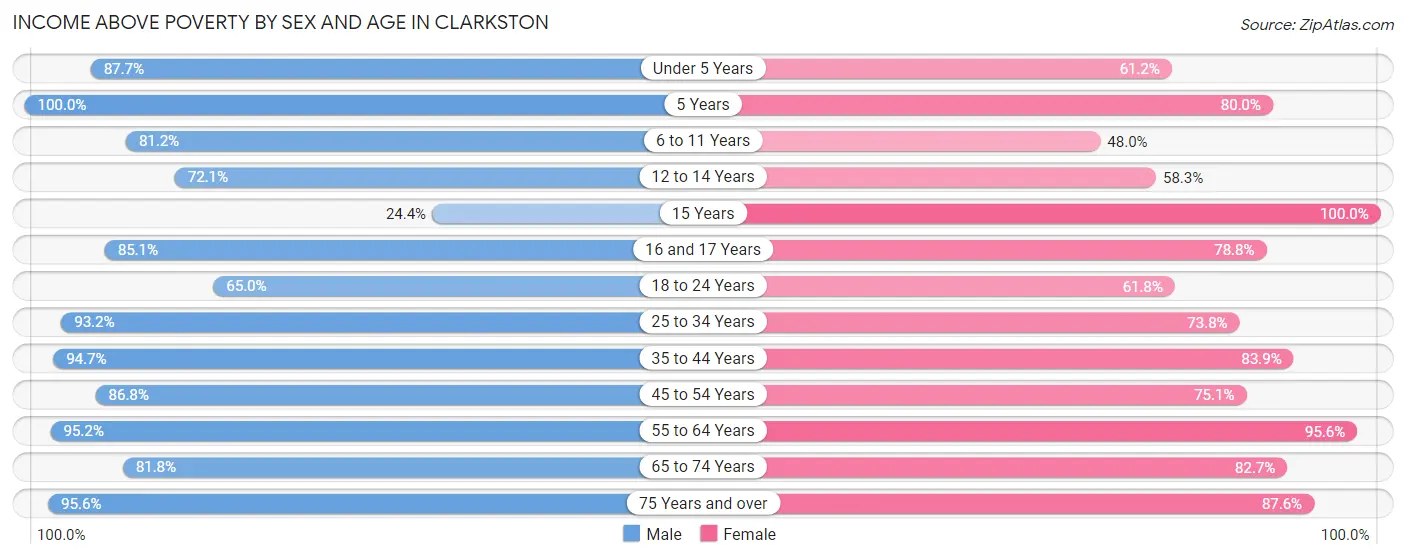
| Age Bracket | Male | Female |
| Under 5 Years | 293 (87.7%) | 169 (61.2%) |
| 5 Years | 72 (100.0%) | 60 (80.0%) |
| 6 to 11 Years | 207 (81.2%) | 60 (48.0%) |
| 12 to 14 Years | 75 (72.1%) | 42 (58.3%) |
| 15 Years | 10 (24.4%) | 48 (100.0%) |
| 16 and 17 Years | 40 (85.1%) | 104 (78.8%) |
| 18 to 24 Years | 356 (65.0%) | 207 (61.8%) |
| 25 to 34 Years | 492 (93.2%) | 307 (73.8%) |
| 35 to 44 Years | 445 (94.7%) | 545 (83.9%) |
| 45 to 54 Years | 250 (86.8%) | 295 (75.1%) |
| 55 to 64 Years | 416 (95.2%) | 394 (95.6%) |
| 65 to 74 Years | 193 (81.8%) | 348 (82.7%) |
| 75 Years and over | 153 (95.6%) | 163 (87.6%) |
| Total | 3,002 (85.3%) | 2,742 (77.4%) |
Income Below Poverty Among Married-Couple Families in Clarkston
The poverty statistics for married-couple families in Clarkston show that 2.1% or 20 of the total 947 families live below the poverty line. Families with 5 or more children have the highest poverty rate of 100.0%, comprising of 14 families. On the other hand, families with no children have the lowest poverty rate of 0.0%, which includes 0 families.
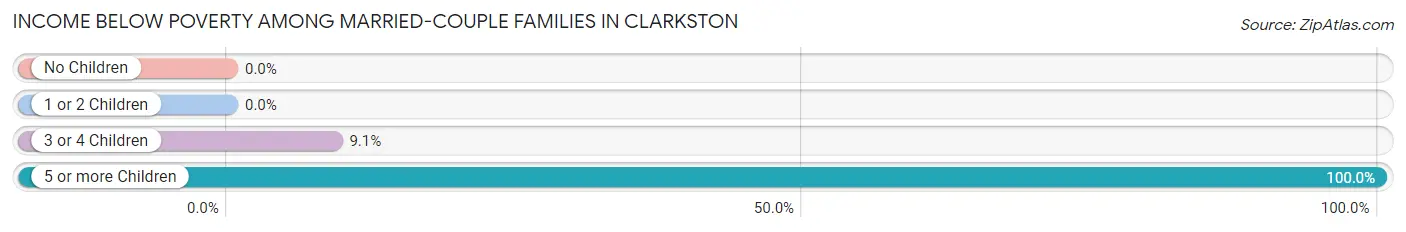
| Children | Above Poverty | Below Poverty |
| No Children | 481 (100.0%) | 0 (0.0%) |
| 1 or 2 Children | 386 (100.0%) | 0 (0.0%) |
| 3 or 4 Children | 60 (90.9%) | 6 (9.1%) |
| 5 or more Children | 0 (0.0%) | 14 (100.0%) |
| Total | 927 (97.9%) | 20 (2.1%) |
Income Below Poverty Among Single-Parent Households in Clarkston
According to the poverty data in Clarkston, 5.0% or 7 single-father households and 28.8% or 108 single-mother households are living below the poverty line. Among single-father households, those with 3 or 4 children have the highest poverty rate, with 7 households (41.2%) experiencing poverty. Likewise, among single-mother households, those with 3 or 4 children have the highest poverty rate, with 35 households (63.6%) falling below the poverty line.
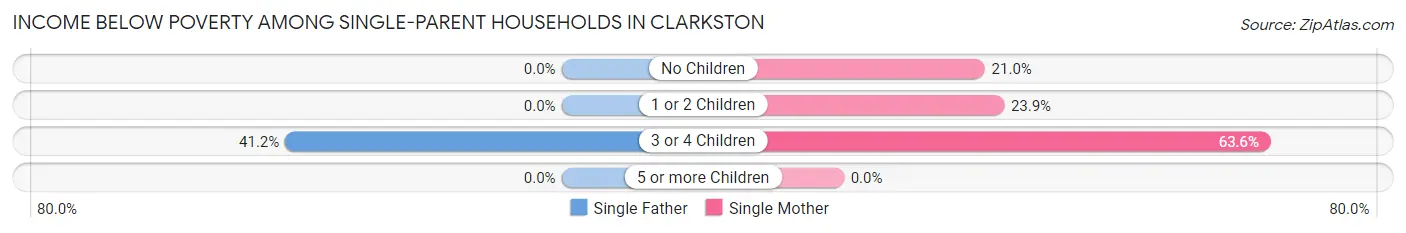
| Children | Single Father | Single Mother |
| No Children | 0 (0.0%) | 25 (21.0%) |
| 1 or 2 Children | 0 (0.0%) | 48 (23.9%) |
| 3 or 4 Children | 7 (41.2%) | 35 (63.6%) |
| 5 or more Children | 0 (0.0%) | 0 (0.0%) |
| Total | 7 (5.0%) | 108 (28.8%) |
Income Below Poverty Among Married-Couple vs Single-Parent Households in Clarkston
The poverty data for Clarkston shows that 20 of the married-couple family households (2.1%) and 115 of the single-parent households (22.4%) are living below the poverty level. Within the married-couple family households, those with 5 or more children have the highest poverty rate, with 14 households (100.0%) falling below the poverty line. Among the single-parent households, those with 3 or 4 children have the highest poverty rate, with 42 household (58.3%) living below poverty.
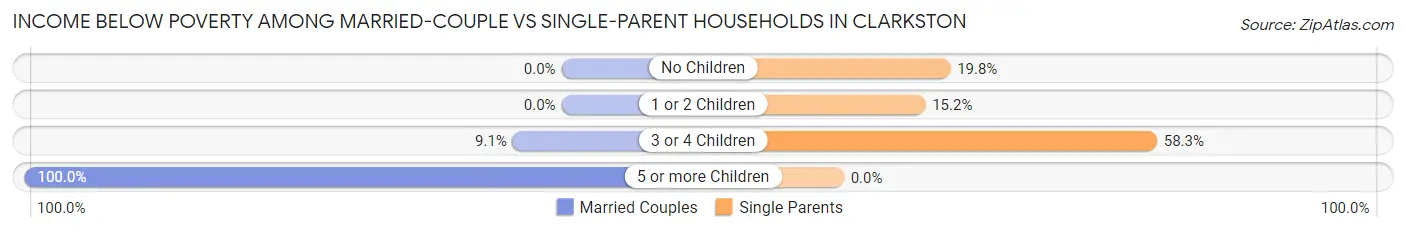
| Children | Married-Couple Families | Single-Parent Households |
| No Children | 0 (0.0%) | 25 (19.8%) |
| 1 or 2 Children | 0 (0.0%) | 48 (15.2%) |
| 3 or 4 Children | 6 (9.1%) | 42 (58.3%) |
| 5 or more Children | 14 (100.0%) | 0 (0.0%) |
| Total | 20 (2.1%) | 115 (22.4%) |
Race in Clarkston
The most populous races in Clarkston are White / Caucasian (6,207 | 86.0%), Two or more Races (537 | 7.4%), and Hispanic or Latino (448 | 6.2%).
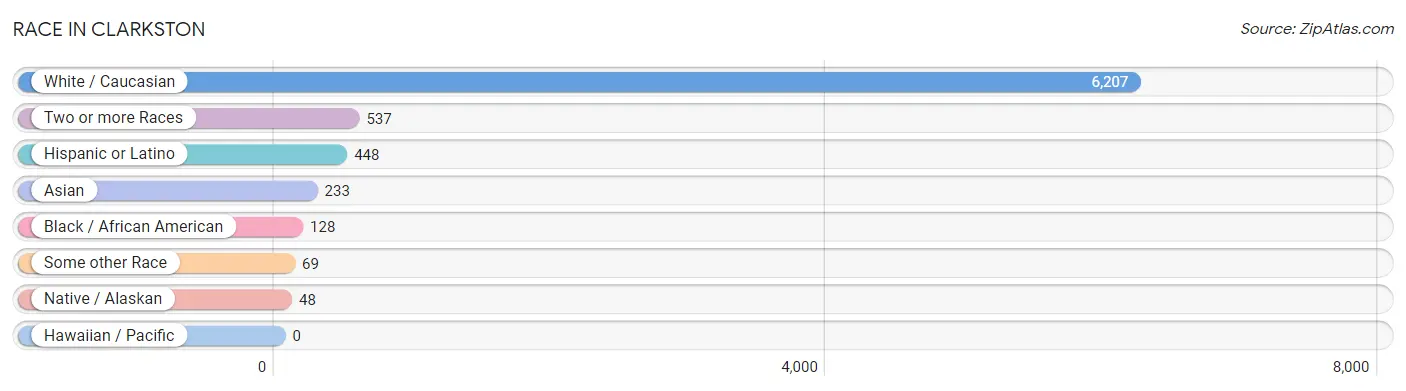
| Race | # Population | % Population |
| Asian | 233 | 3.2% |
| Black / African American | 128 | 1.8% |
| Hawaiian / Pacific | 0 | 0.0% |
| Hispanic or Latino | 448 | 6.2% |
| Native / Alaskan | 48 | 0.7% |
| White / Caucasian | 6,207 | 86.0% |
| Two or more Races | 537 | 7.4% |
| Some other Race | 69 | 1.0% |
| Total | 7,222 | 100.0% |
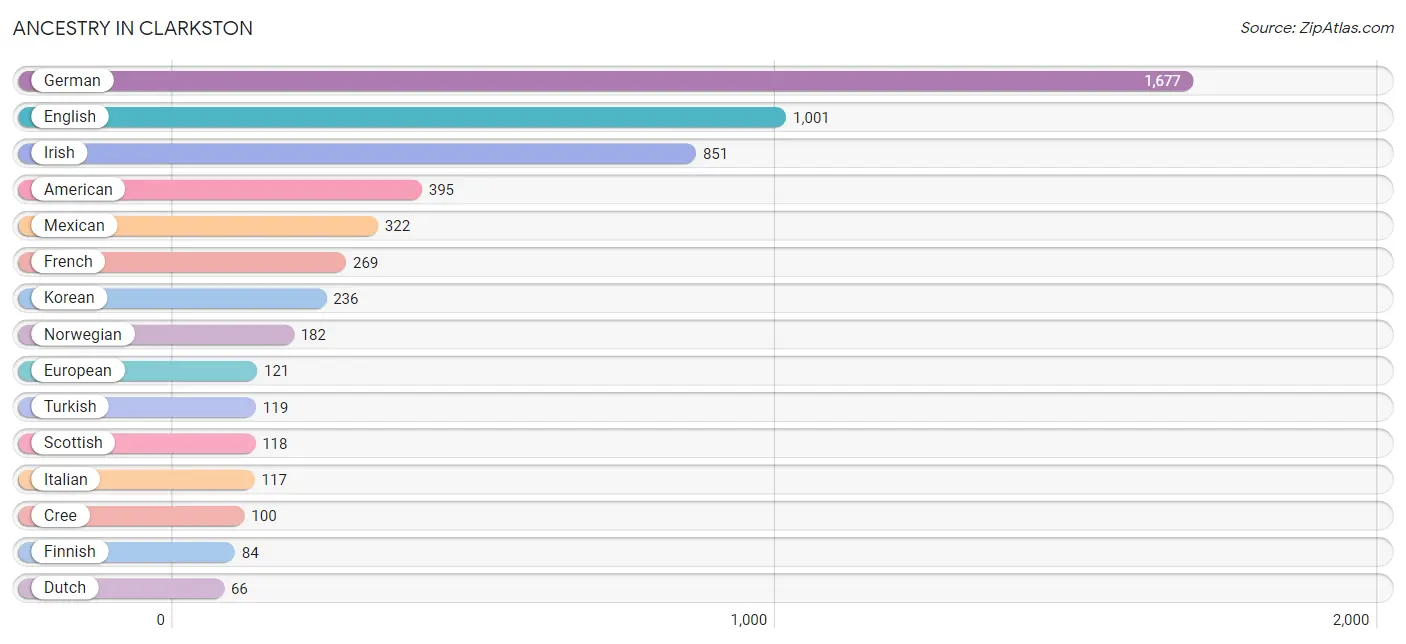
Ancestry in Clarkston
The most populous ancestries reported in Clarkston are German (1,677 | 23.2%), English (1,001 | 13.9%), Irish (851 | 11.8%), American (395 | 5.5%), and Mexican (322 | 4.5%), together accounting for 58.8% of all Clarkston residents.
| Ancestry | # Population | % Population |
| American | 395 | 5.5% |
| Austrian | 6 | 0.1% |
| Belgian | 14 | 0.2% |
| British | 21 | 0.3% |
| Canadian | 30 | 0.4% |
| Cherokee | 22 | 0.3% |
| Chippewa | 30 | 0.4% |
| Cree | 100 | 1.4% |
| Czech | 11 | 0.2% |
| Danish | 35 | 0.5% |
| Dutch | 66 | 0.9% |
| English | 1,001 | 13.9% |
| European | 121 | 1.7% |
| Finnish | 84 | 1.2% |
| French | 269 | 3.7% |
| French Canadian | 42 | 0.6% |
| German | 1,677 | 23.2% |
| Hungarian | 22 | 0.3% |
| Indian (Asian) | 10 | 0.1% |
| Irish | 851 | 11.8% |
| Italian | 117 | 1.6% |
| Kenyan | 22 | 0.3% |
| Korean | 236 | 3.3% |
| Mexican | 322 | 4.5% |
| Native Hawaiian | 38 | 0.5% |
| Norwegian | 182 | 2.5% |
| Pakistani | 15 | 0.2% |
| Polish | 24 | 0.3% |
| Puget Sound Salish | 2 | 0.0% |
| Scotch-Irish | 18 | 0.3% |
| Scottish | 118 | 1.6% |
| Sioux | 16 | 0.2% |
| Spaniard | 11 | 0.2% |
| Subsaharan African | 22 | 0.3% |
| Swedish | 56 | 0.8% |
| Swiss | 40 | 0.5% |
| Turkish | 119 | 1.7% |
| Welsh | 13 | 0.2% | View All 38 Rows |
Immigrants in Clarkston
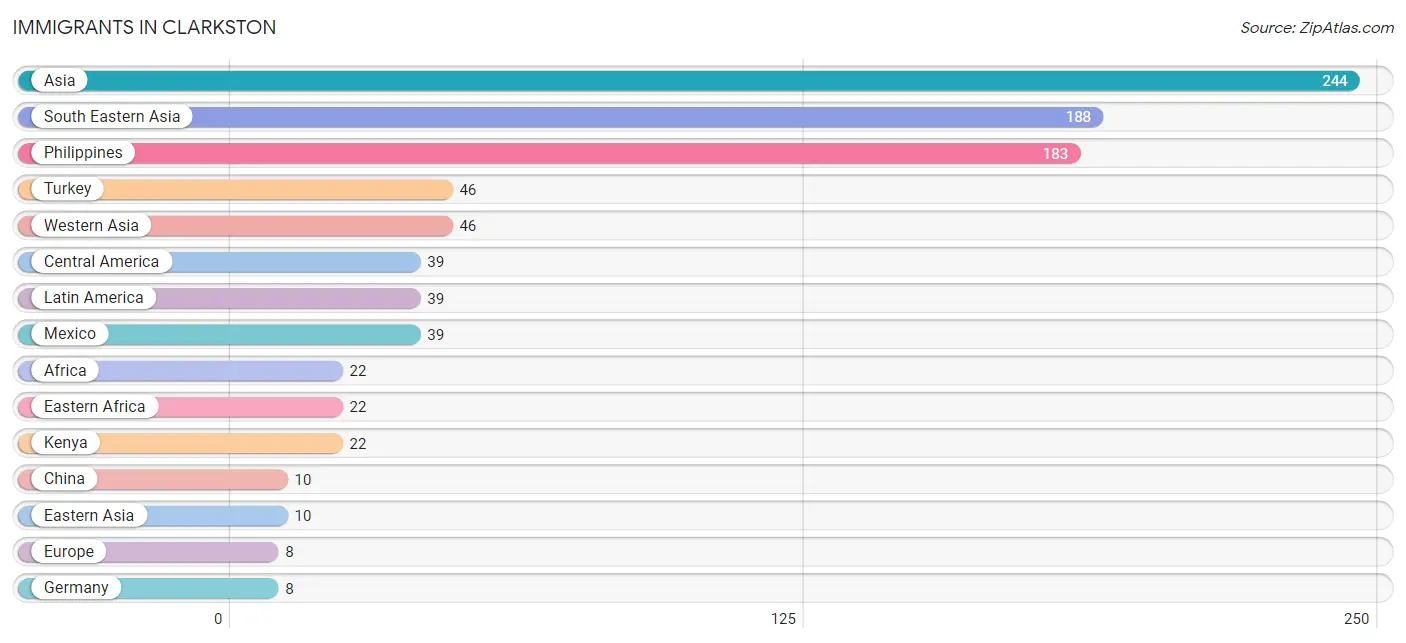
The most numerous immigrant groups reported in Clarkston came from Asia (244 | 3.4%), South Eastern Asia (188 | 2.6%), Philippines (183 | 2.5%), Turkey (46 | 0.6%), and Western Asia (46 | 0.6%), together accounting for 9.8% of all Clarkston residents.
| Immigration Origin | # Population | % Population |
| Africa | 22 | 0.3% |
| Asia | 244 | 3.4% |
| Central America | 39 | 0.5% |
| China | 10 | 0.1% |
| Eastern Africa | 22 | 0.3% |
| Eastern Asia | 10 | 0.1% |
| Europe | 8 | 0.1% |
| Germany | 8 | 0.1% |
| Kenya | 22 | 0.3% |
| Latin America | 39 | 0.5% |
| Mexico | 39 | 0.5% |
| Philippines | 183 | 2.5% |
| South Eastern Asia | 188 | 2.6% |
| Thailand | 5 | 0.1% |
| Turkey | 46 | 0.6% |
| Western Asia | 46 | 0.6% |
| Western Europe | 8 | 0.1% | View All 17 Rows |
Sex and Age in Clarkston
Sex and Age in Clarkston
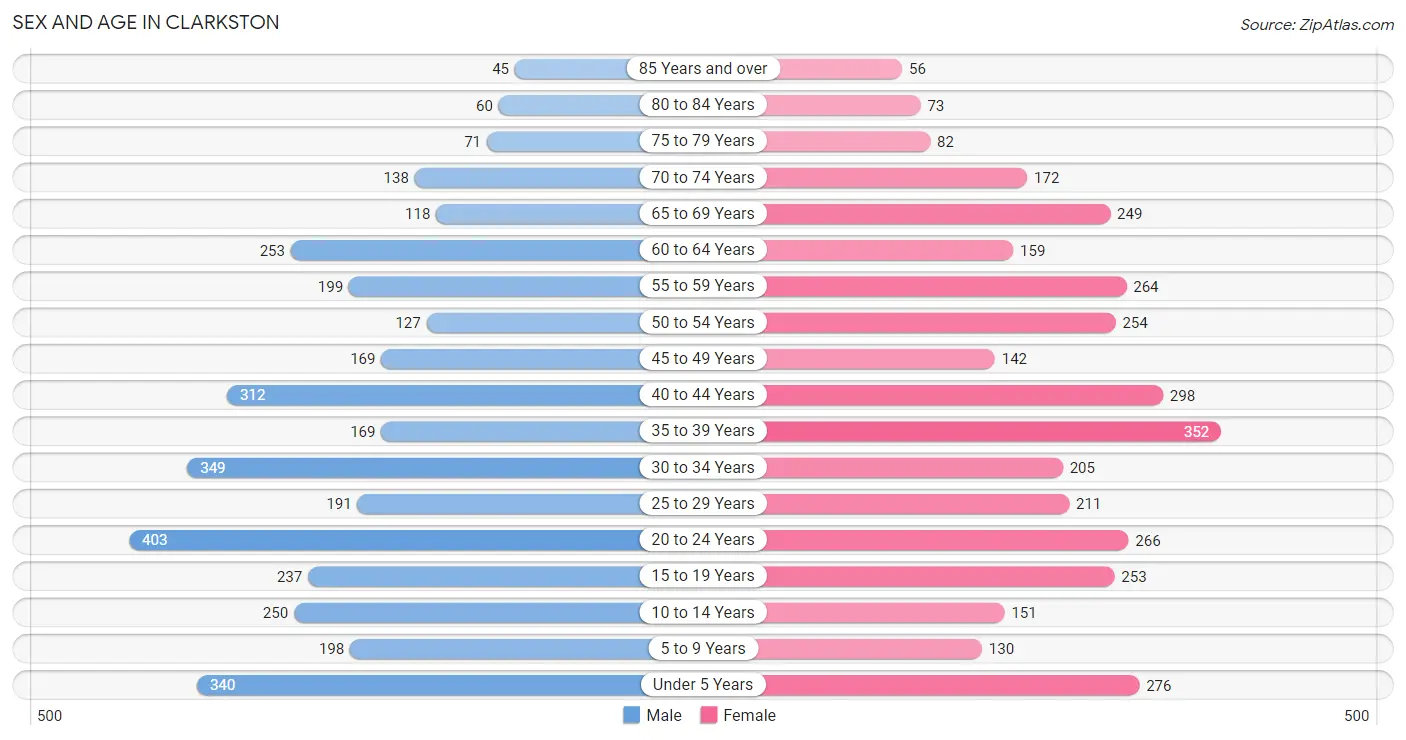
The most populous age groups in Clarkston are 20 to 24 Years (403 | 11.1%) for men and 35 to 39 Years (352 | 9.8%) for women.
| Age Bracket | Male | Female |
| Under 5 Years | 340 (9.4%) | 276 (7.7%) |
| 5 to 9 Years | 198 (5.5%) | 130 (3.6%) |
| 10 to 14 Years | 250 (6.9%) | 151 (4.2%) |
| 15 to 19 Years | 237 (6.5%) | 253 (7.0%) |
| 20 to 24 Years | 403 (11.1%) | 266 (7.4%) |
| 25 to 29 Years | 191 (5.3%) | 211 (5.9%) |
| 30 to 34 Years | 349 (9.6%) | 205 (5.7%) |
| 35 to 39 Years | 169 (4.7%) | 352 (9.8%) |
| 40 to 44 Years | 312 (8.6%) | 298 (8.3%) |
| 45 to 49 Years | 169 (4.7%) | 142 (4.0%) |
| 50 to 54 Years | 127 (3.5%) | 254 (7.1%) |
| 55 to 59 Years | 199 (5.5%) | 264 (7.3%) |
| 60 to 64 Years | 253 (7.0%) | 159 (4.4%) |
| 65 to 69 Years | 118 (3.3%) | 249 (6.9%) |
| 70 to 74 Years | 138 (3.8%) | 172 (4.8%) |
| 75 to 79 Years | 71 (2.0%) | 82 (2.3%) |
| 80 to 84 Years | 60 (1.7%) | 73 (2.0%) |
| 85 Years and over | 45 (1.2%) | 56 (1.6%) |
| Total | 3,629 (100.0%) | 3,593 (100.0%) |
Families and Households in Clarkston
Median Family Size in Clarkston
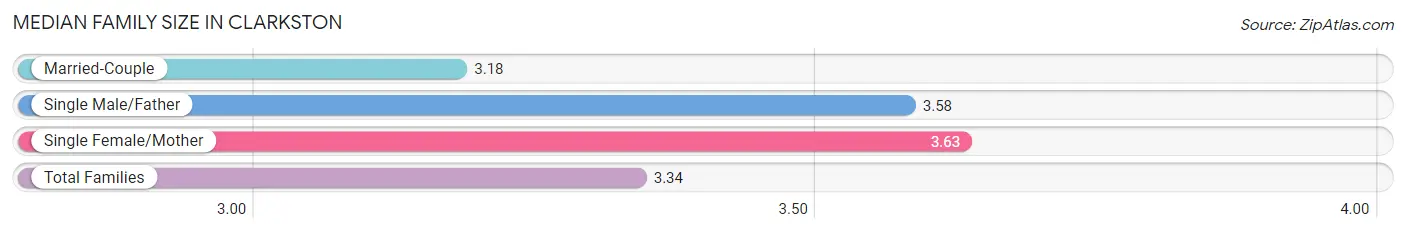
The median family size in Clarkston is 3.34 persons per family, with single female/mother families (375 | 25.7%) accounting for the largest median family size of 3.63 persons per family. On the other hand, married-couple families (947 | 64.8%) represent the smallest median family size with 3.18 persons per family.
| Family Type | # Families | Family Size |
| Married-Couple | 947 (64.8%) | 3.18 |
| Single Male/Father | 139 (9.5%) | 3.58 |
| Single Female/Mother | 375 (25.7%) | 3.63 |
| Total Families | 1,461 (100.0%) | 3.34 |
Median Household Size in Clarkston
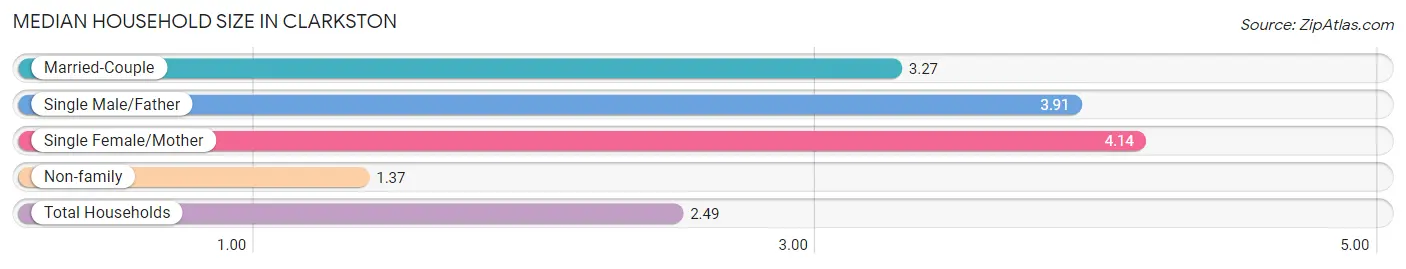
The median household size in Clarkston is 2.49 persons per household, with single female/mother households (375 | 13.2%) accounting for the largest median household size of 4.14 persons per household. non-family households (1,385 | 48.7%) represent the smallest median household size with 1.37 persons per household.
| Household Type | # Households | Household Size |
| Married-Couple | 947 (33.3%) | 3.27 |
| Single Male/Father | 139 (4.9%) | 3.91 |
| Single Female/Mother | 375 (13.2%) | 4.14 |
| Non-family | 1,385 (48.7%) | 1.37 |
| Total Households | 2,846 (100.0%) | 2.49 |
Household Size by Marriage Status in Clarkston
Out of a total of 2,846 households in Clarkston, 1,461 (51.3%) are family households, while 1,385 (48.7%) are nonfamily households. The most numerous type of family households are 4-person households, comprising 482, and the most common type of nonfamily households are 1-person households, comprising 1,059.
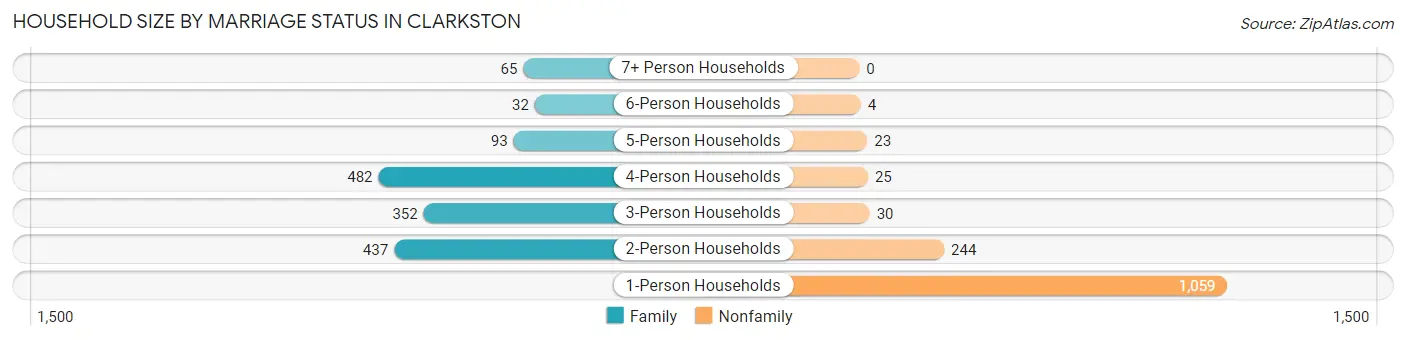
| Household Size | Family Households | Nonfamily Households |
| 1-Person Households | - | 1,059 (37.2%) |
| 2-Person Households | 437 (15.3%) | 244 (8.6%) |
| 3-Person Households | 352 (12.4%) | 30 (1.1%) |
| 4-Person Households | 482 (16.9%) | 25 (0.9%) |
| 5-Person Households | 93 (3.3%) | 23 (0.8%) |
| 6-Person Households | 32 (1.1%) | 4 (0.1%) |
| 7+ Person Households | 65 (2.3%) | 0 (0.0%) |
| Total | 1,461 (51.3%) | 1,385 (48.7%) |
Female Fertility in Clarkston
Fertility by Age in Clarkston
Average fertility rate in Clarkston is 119.0 births per 1,000 women. Women in the age bracket of 15 to 19 years have the highest fertility rate with 126.0 births per 1,000 women. Women in the age bracket of 35 to 50 years acount for 47.6% of all women with births.
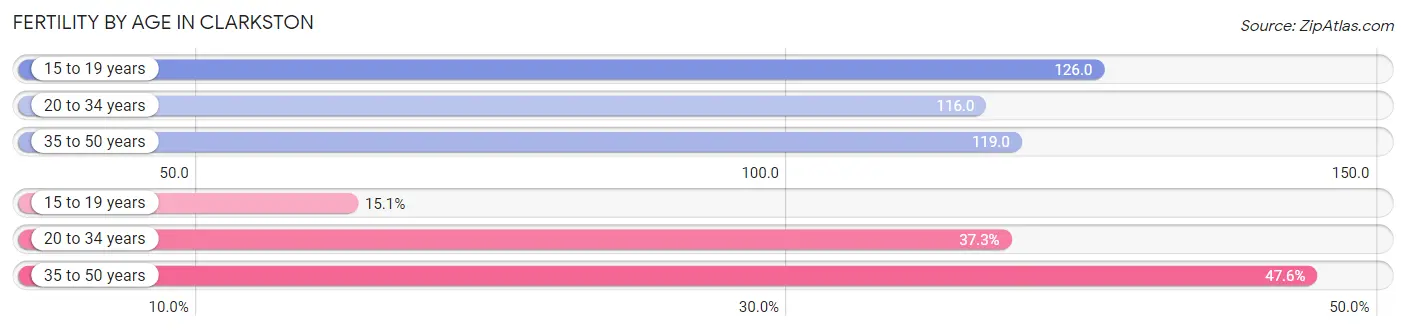
| Age Bracket | Women with Births | Births / 1,000 Women |
| 15 to 19 years | 32 (15.1%) | 126.0 |
| 20 to 34 years | 79 (37.3%) | 116.0 |
| 35 to 50 years | 101 (47.6%) | 119.0 |
| Total | 212 (100.0%) | 119.0 |
Fertility by Age by Marriage Status in Clarkston
54.2% of women with births (212) in Clarkston are married. The highest percentage of unmarried women with births falls into 15 to 19 years age bracket with 100.0% of them unmarried at the time of birth, while the lowest percentage of unmarried women with births belong to 35 to 50 years age bracket with 34.7% of them unmarried.
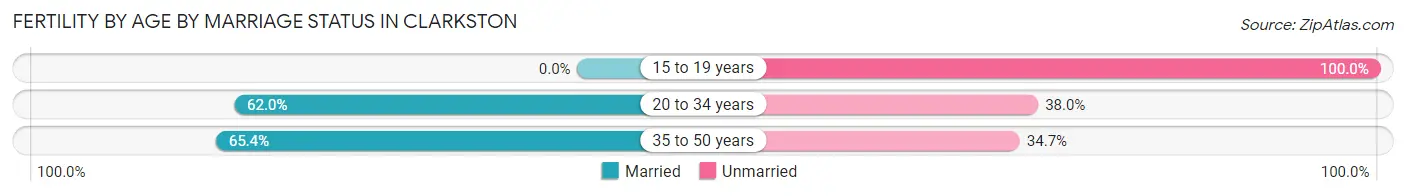
| Age Bracket | Married | Unmarried |
| 15 to 19 years | 0 (0.0%) | 32 (100.0%) |
| 20 to 34 years | 49 (62.0%) | 30 (38.0%) |
| 35 to 50 years | 66 (65.3%) | 35 (34.6%) |
| Total | 115 (54.2%) | 97 (45.8%) |
Fertility by Education in Clarkston
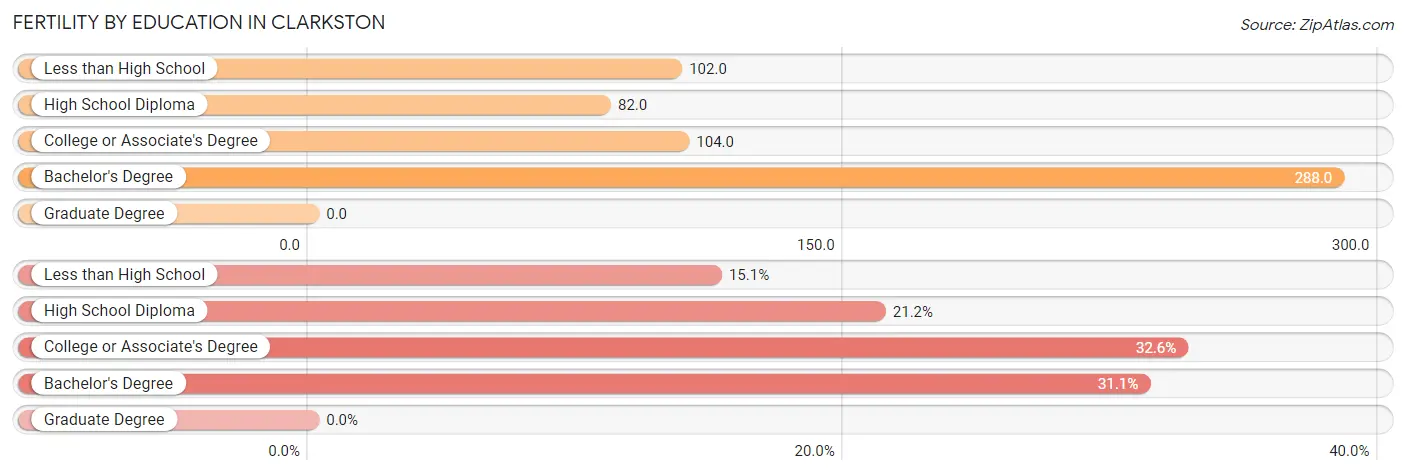
| Educational Attainment | Women with Births | Births / 1,000 Women |
| Less than High School | 32 (15.1%) | 102.0 |
| High School Diploma | 45 (21.2%) | 82.0 |
| College or Associate's Degree | 69 (32.6%) | 104.0 |
| Bachelor's Degree | 66 (31.1%) | 288.0 |
| Graduate Degree | 0 (0.0%) | 0.0 |
| Total | 212 (100.0%) | 119.0 |
Fertility by Education by Marriage Status in Clarkston
45.8% of women with births in Clarkston are unmarried. Women with the educational attainment of bachelor's degree are most likely to be married with 100.0% of them married at childbirth, while women with the educational attainment of less than high school are least likely to be married with 100.0% of them unmarried at childbirth.
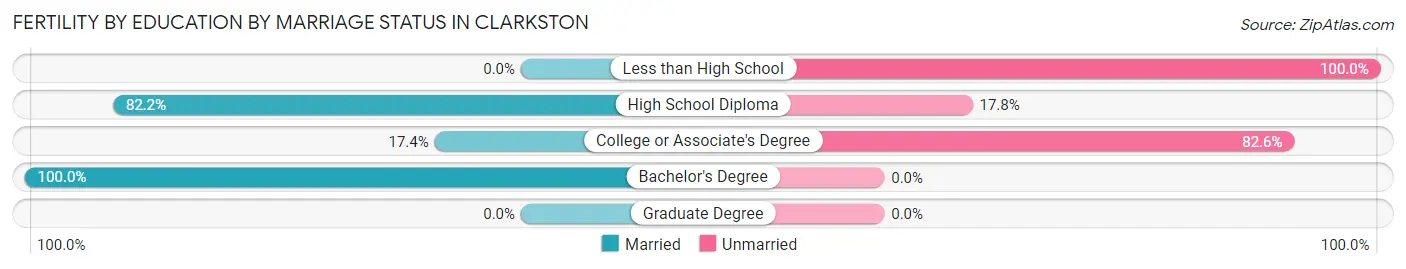
| Educational Attainment | Married | Unmarried |
| Less than High School | 0 (0.0%) | 32 (100.0%) |
| High School Diploma | 37 (82.2%) | 8 (17.8%) |
| College or Associate's Degree | 12 (17.4%) | 57 (82.6%) |
| Bachelor's Degree | 66 (100.0%) | 0 (0.0%) |
| Graduate Degree | 0 (0.0%) | 0 (0.0%) |
| Total | 115 (54.2%) | 97 (45.8%) |
Employment Characteristics in Clarkston
Employment by Class of Employer in Clarkston
Among the 3,100 employed individuals in Clarkston, private company employees (2,385 | 76.9%), not-for-profit organizations (216 | 7.0%), and local government employees (178 | 5.7%) make up the most common classes of employment.
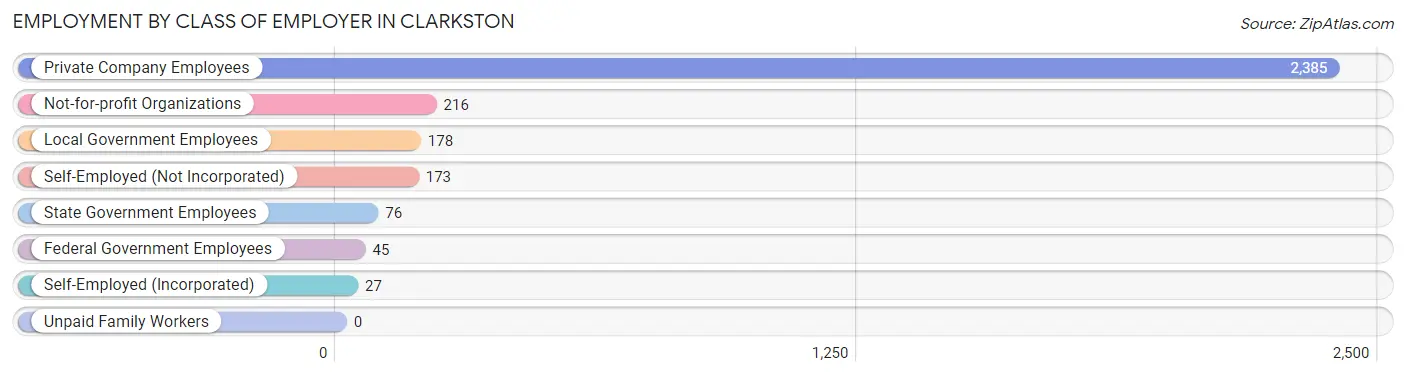
| Employer Class | # Employees | % Employees |
| Private Company Employees | 2,385 | 76.9% |
| Self-Employed (Incorporated) | 27 | 0.9% |
| Self-Employed (Not Incorporated) | 173 | 5.6% |
| Not-for-profit Organizations | 216 | 7.0% |
| Local Government Employees | 178 | 5.7% |
| State Government Employees | 76 | 2.5% |
| Federal Government Employees | 45 | 1.5% |
| Unpaid Family Workers | 0 | 0.0% |
| Total | 3,100 | 100.0% |
Employment Status by Age in Clarkston
According to the labor force statistics for Clarkston, out of the total population over 16 years of age (5,788), 62.9% or 3,641 individuals are in the labor force, with 9.9% or 360 of them unemployed. The age group with the highest labor force participation rate is 20 to 24 years, with 93.9% or 628 individuals in the labor force. Within the labor force, the 16 to 19 years age range has the highest percentage of unemployed individuals, with 32.0% or 71 of them being unemployed.
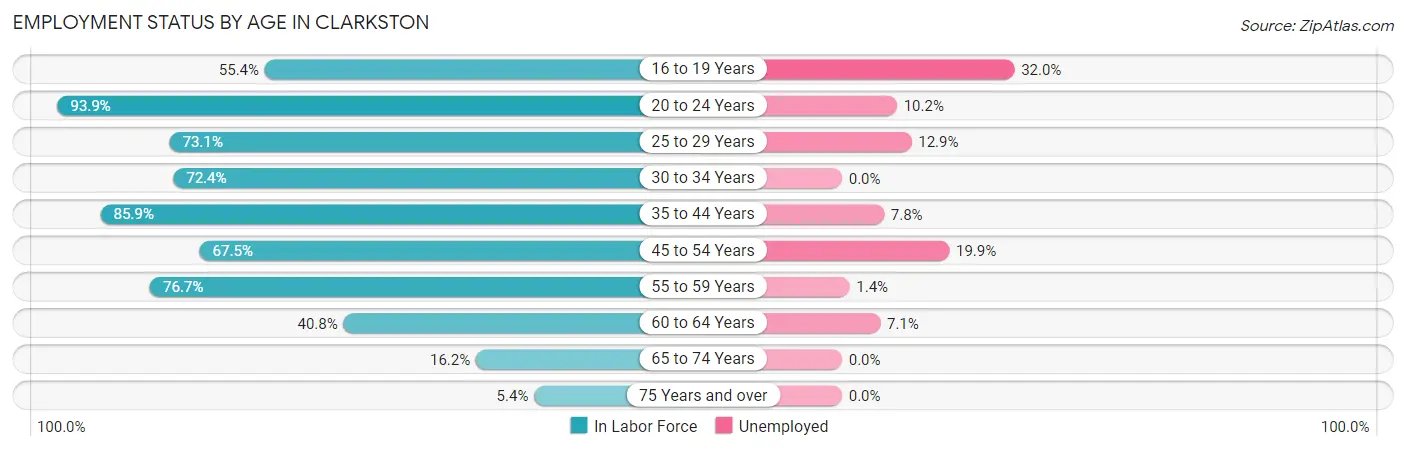
| Age Bracket | In Labor Force | Unemployed |
| 16 to 19 Years | 222 (55.4%) | 71 (32.0%) |
| 20 to 24 Years | 628 (93.9%) | 64 (10.2%) |
| 25 to 29 Years | 294 (73.1%) | 38 (12.9%) |
| 30 to 34 Years | 401 (72.4%) | 0 (0.0%) |
| 35 to 44 Years | 972 (85.9%) | 76 (7.8%) |
| 45 to 54 Years | 467 (67.5%) | 93 (19.9%) |
| 55 to 59 Years | 355 (76.7%) | 5 (1.4%) |
| 60 to 64 Years | 168 (40.8%) | 12 (7.1%) |
| 65 to 74 Years | 110 (16.2%) | 0 (0.0%) |
| 75 Years and over | 21 (5.4%) | 0 (0.0%) |
| Total | 3,641 (62.9%) | 360 (9.9%) |
Employment Status by Educational Attainment in Clarkston
According to labor force statistics for Clarkston, 72.7% of individuals (2,656) out of the total population between 25 and 64 years of age (3,654) are in the labor force, with 8.4% or 223 of them being unemployed. The group with the highest labor force participation rate are those with the educational attainment of bachelor's degree or higher, with 83.3% or 473 individuals in the labor force. Within the labor force, individuals with college / associate degree education have the highest percentage of unemployment, with 13.4% or 168 of them being unemployed.
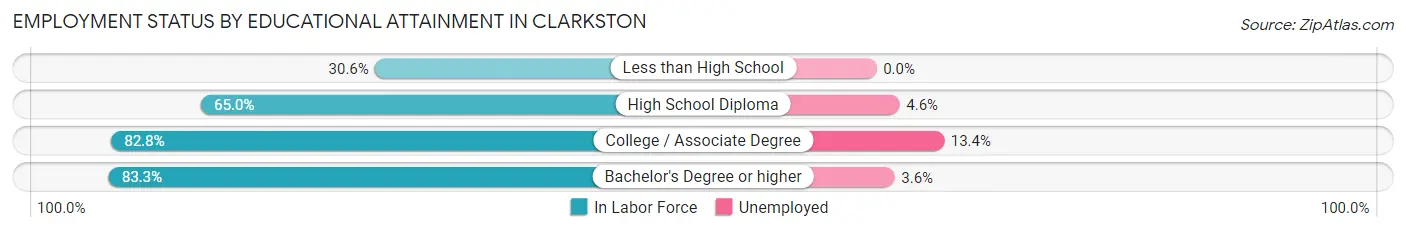
| Educational Attainment | In Labor Force | Unemployed |
| Less than High School | 81 (30.6%) | 0 (0.0%) |
| High School Diploma | 852 (65.0%) | 60 (4.6%) |
| College / Associate Degree | 1,251 (82.8%) | 202 (13.4%) |
| Bachelor's Degree or higher | 473 (83.3%) | 20 (3.6%) |
| Total | 2,656 (72.7%) | 307 (8.4%) |
Employment Occupations by Sex in Clarkston
Management, Business, Science and Arts Occupations
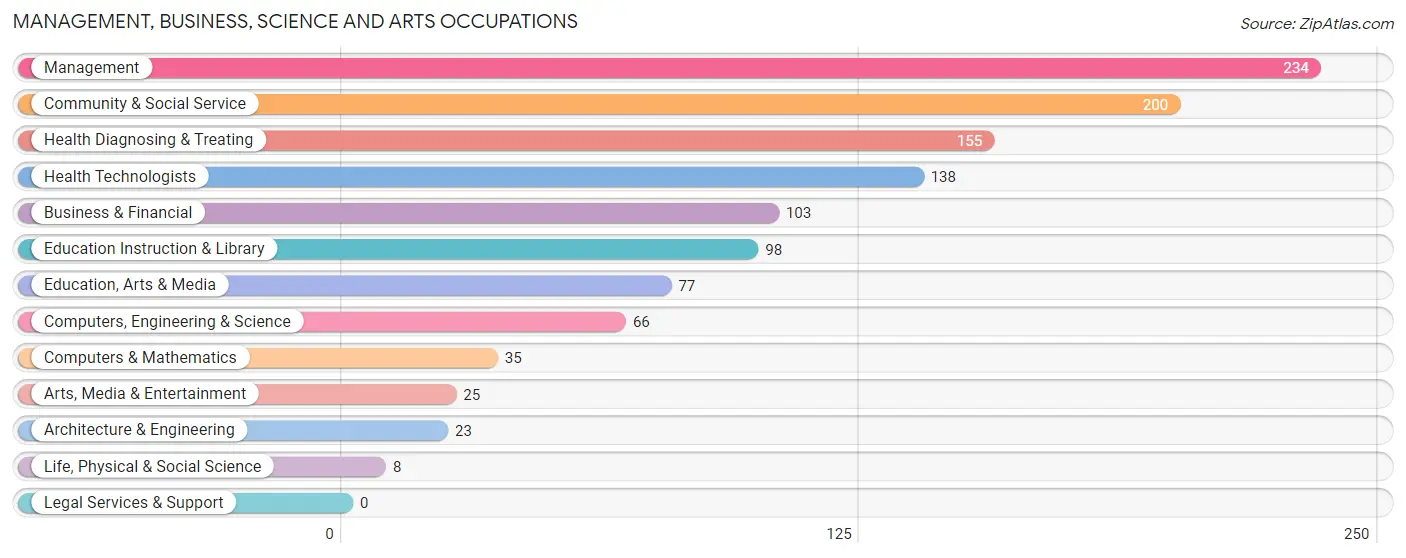
The most common Management, Business, Science and Arts occupations in Clarkston are Management (234 | 7.1%), Community & Social Service (200 | 6.1%), Health Diagnosing & Treating (155 | 4.7%), Health Technologists (138 | 4.2%), and Business & Financial (103 | 3.1%).
Management, Business, Science and Arts Occupations by Sex
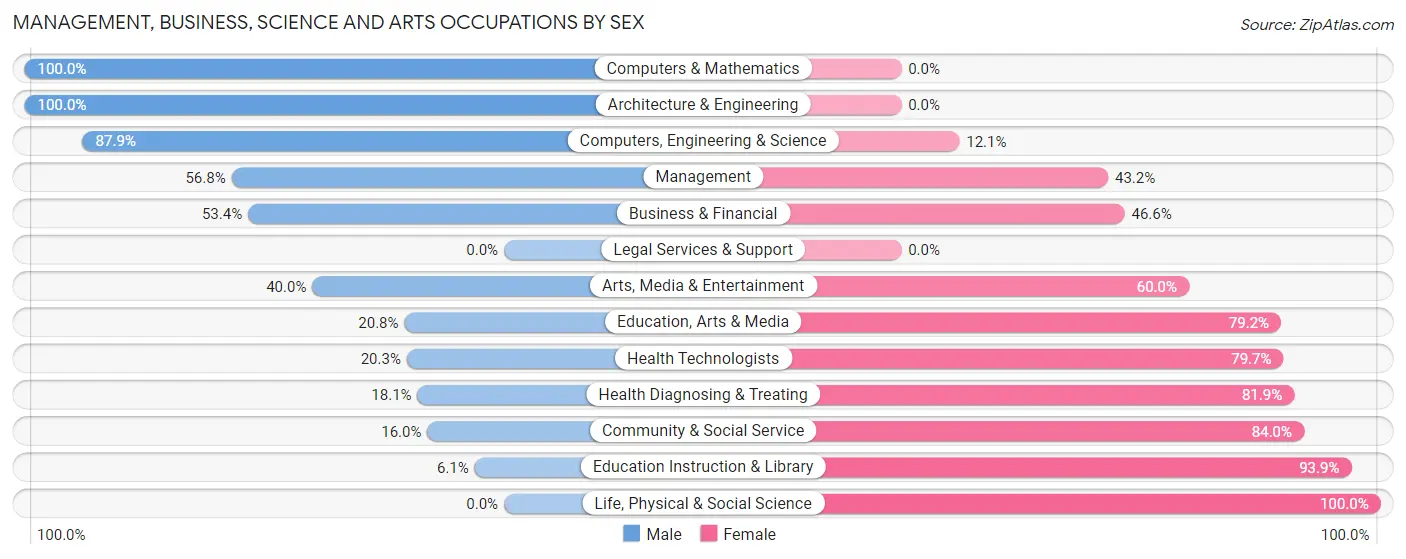
Within the Management, Business, Science and Arts occupations in Clarkston, the most male-oriented occupations are Computers & Mathematics (100.0%), Architecture & Engineering (100.0%), and Computers, Engineering & Science (87.9%), while the most female-oriented occupations are Life, Physical & Social Science (100.0%), Education Instruction & Library (93.9%), and Community & Social Service (84.0%).
| Occupation | Male | Female |
| Management | 133 (56.8%) | 101 (43.2%) |
| Business & Financial | 55 (53.4%) | 48 (46.6%) |
| Computers, Engineering & Science | 58 (87.9%) | 8 (12.1%) |
| Computers & Mathematics | 35 (100.0%) | 0 (0.0%) |
| Architecture & Engineering | 23 (100.0%) | 0 (0.0%) |
| Life, Physical & Social Science | 0 (0.0%) | 8 (100.0%) |
| Community & Social Service | 32 (16.0%) | 168 (84.0%) |
| Education, Arts & Media | 16 (20.8%) | 61 (79.2%) |
| Legal Services & Support | 0 (0.0%) | 0 (0.0%) |
| Education Instruction & Library | 6 (6.1%) | 92 (93.9%) |
| Arts, Media & Entertainment | 10 (40.0%) | 15 (60.0%) |
| Health Diagnosing & Treating | 28 (18.1%) | 127 (81.9%) |
| Health Technologists | 28 (20.3%) | 110 (79.7%) |
| Total (Category) | 306 (40.4%) | 452 (59.6%) |
| Total (Overall) | 1,728 (52.7%) | 1,551 (47.3%) |
Services Occupations
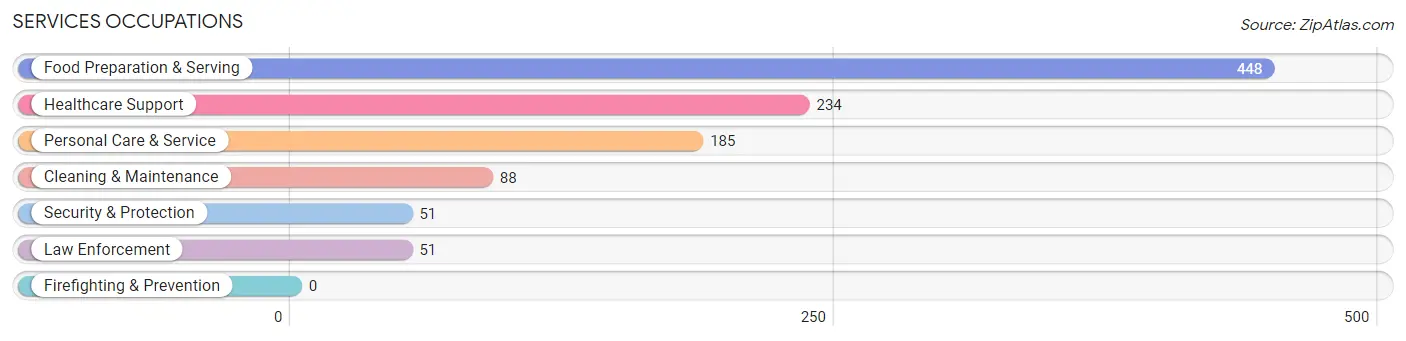
The most common Services occupations in Clarkston are Food Preparation & Serving (448 | 13.7%), Healthcare Support (234 | 7.1%), Personal Care & Service (185 | 5.6%), Cleaning & Maintenance (88 | 2.7%), and Security & Protection (51 | 1.6%).
Services Occupations by Sex
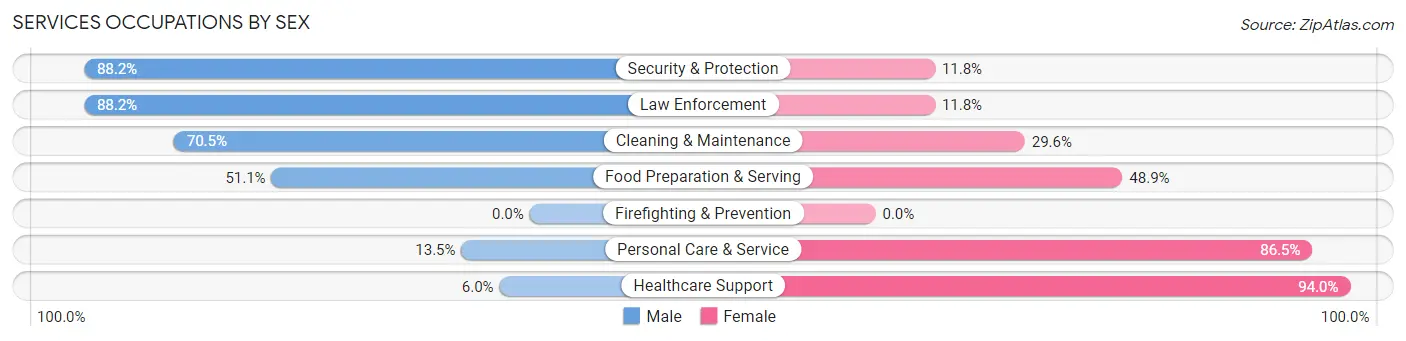
Within the Services occupations in Clarkston, the most male-oriented occupations are Security & Protection (88.2%), Law Enforcement (88.2%), and Cleaning & Maintenance (70.5%), while the most female-oriented occupations are Healthcare Support (94.0%), Personal Care & Service (86.5%), and Food Preparation & Serving (48.9%).
| Occupation | Male | Female |
| Healthcare Support | 14 (6.0%) | 220 (94.0%) |
| Security & Protection | 45 (88.2%) | 6 (11.8%) |
| Firefighting & Prevention | 0 (0.0%) | 0 (0.0%) |
| Law Enforcement | 45 (88.2%) | 6 (11.8%) |
| Food Preparation & Serving | 229 (51.1%) | 219 (48.9%) |
| Cleaning & Maintenance | 62 (70.5%) | 26 (29.5%) |
| Personal Care & Service | 25 (13.5%) | 160 (86.5%) |
| Total (Category) | 375 (37.3%) | 631 (62.7%) |
| Total (Overall) | 1,728 (52.7%) | 1,551 (47.3%) |
Sales and Office Occupations
The most common Sales and Office occupations in Clarkston are Sales & Related (461 | 14.1%), and Office & Administration (195 | 5.9%).
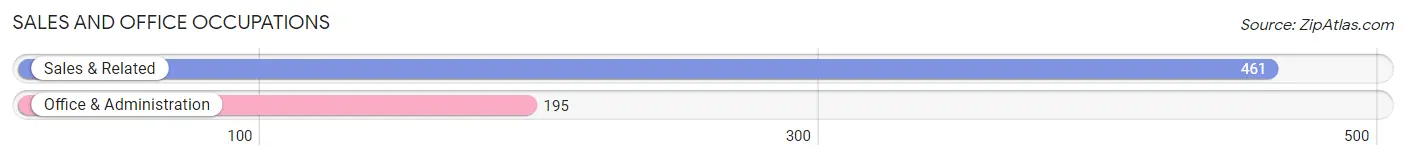
Sales and Office Occupations by Sex
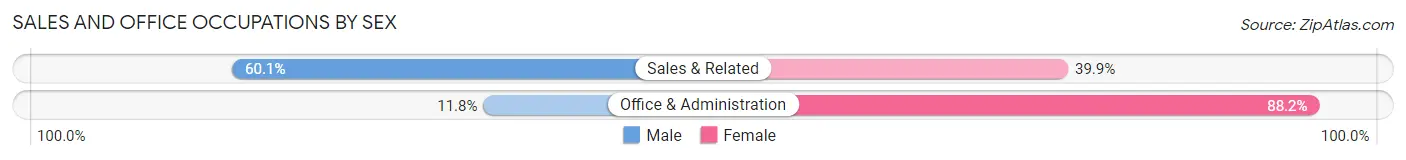
| Occupation | Male | Female |
| Sales & Related | 277 (60.1%) | 184 (39.9%) |
| Office & Administration | 23 (11.8%) | 172 (88.2%) |
| Total (Category) | 300 (45.7%) | 356 (54.3%) |
| Total (Overall) | 1,728 (52.7%) | 1,551 (47.3%) |
Natural Resources, Construction and Maintenance Occupations
The most common Natural Resources, Construction and Maintenance occupations in Clarkston are Construction & Extraction (283 | 8.6%), Installation, Maintenance & Repair (111 | 3.4%), and Farming, Fishing & Forestry (10 | 0.3%).
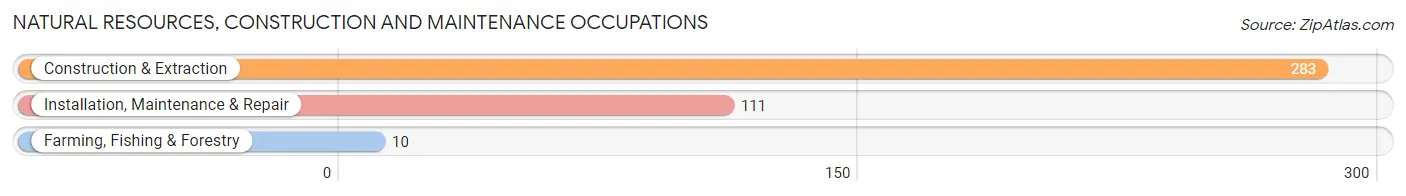
Natural Resources, Construction and Maintenance Occupations by Sex
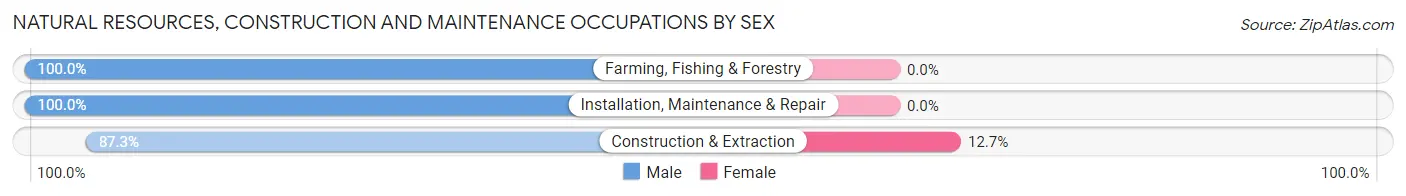
| Occupation | Male | Female |
| Farming, Fishing & Forestry | 10 (100.0%) | 0 (0.0%) |
| Construction & Extraction | 247 (87.3%) | 36 (12.7%) |
| Installation, Maintenance & Repair | 111 (100.0%) | 0 (0.0%) |
| Total (Category) | 368 (91.1%) | 36 (8.9%) |
| Total (Overall) | 1,728 (52.7%) | 1,551 (47.3%) |
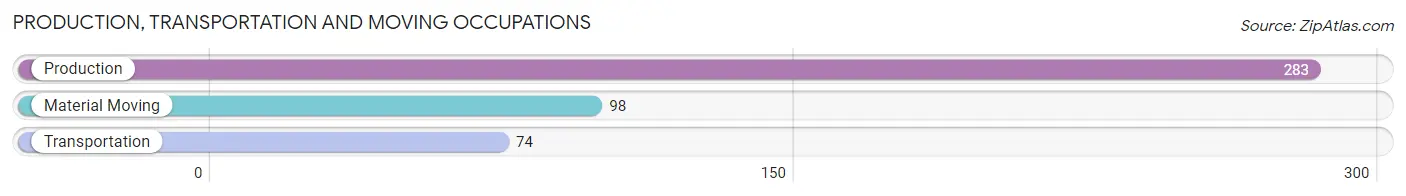
Production, Transportation and Moving Occupations
The most common Production, Transportation and Moving occupations in Clarkston are Production (283 | 8.6%), Material Moving (98 | 3.0%), and Transportation (74 | 2.3%).
Production, Transportation and Moving Occupations by Sex
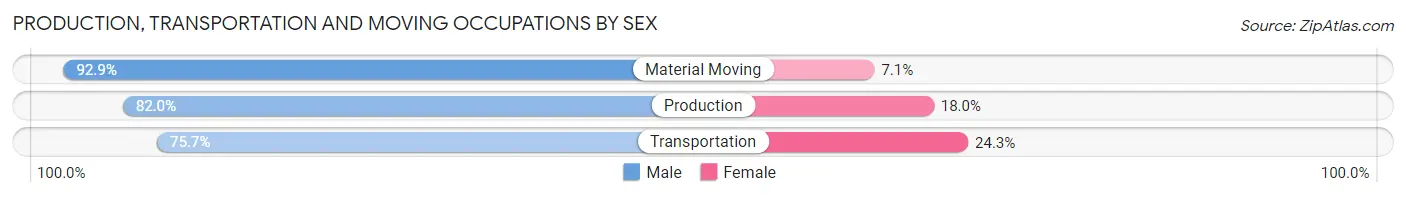
| Occupation | Male | Female |
| Production | 232 (82.0%) | 51 (18.0%) |
| Transportation | 56 (75.7%) | 18 (24.3%) |
| Material Moving | 91 (92.9%) | 7 (7.1%) |
| Total (Category) | 379 (83.3%) | 76 (16.7%) |
| Total (Overall) | 1,728 (52.7%) | 1,551 (47.3%) |
Employment Industries by Sex in Clarkston
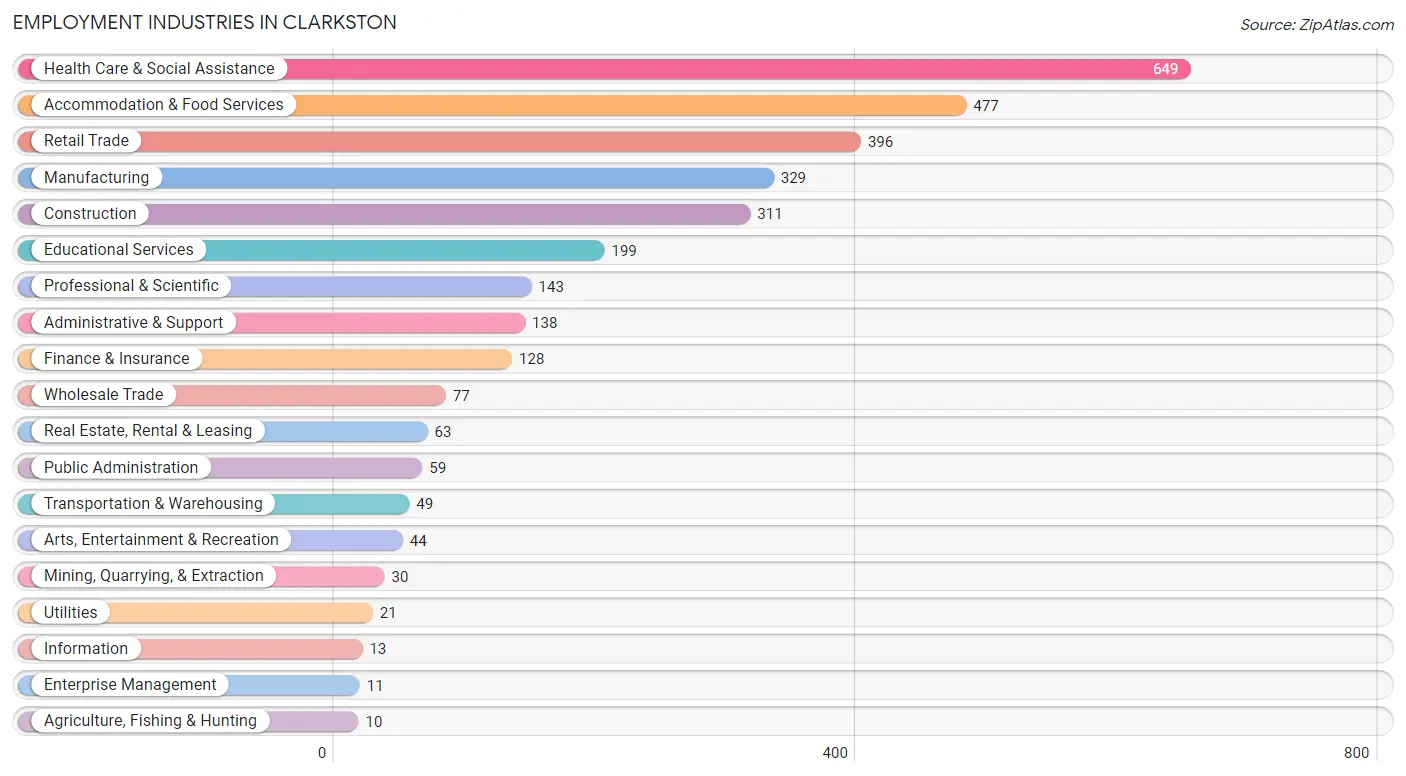
Employment Industries in Clarkston
The major employment industries in Clarkston include Health Care & Social Assistance (649 | 19.8%), Accommodation & Food Services (477 | 14.5%), Retail Trade (396 | 12.1%), Manufacturing (329 | 10.0%), and Construction (311 | 9.5%).
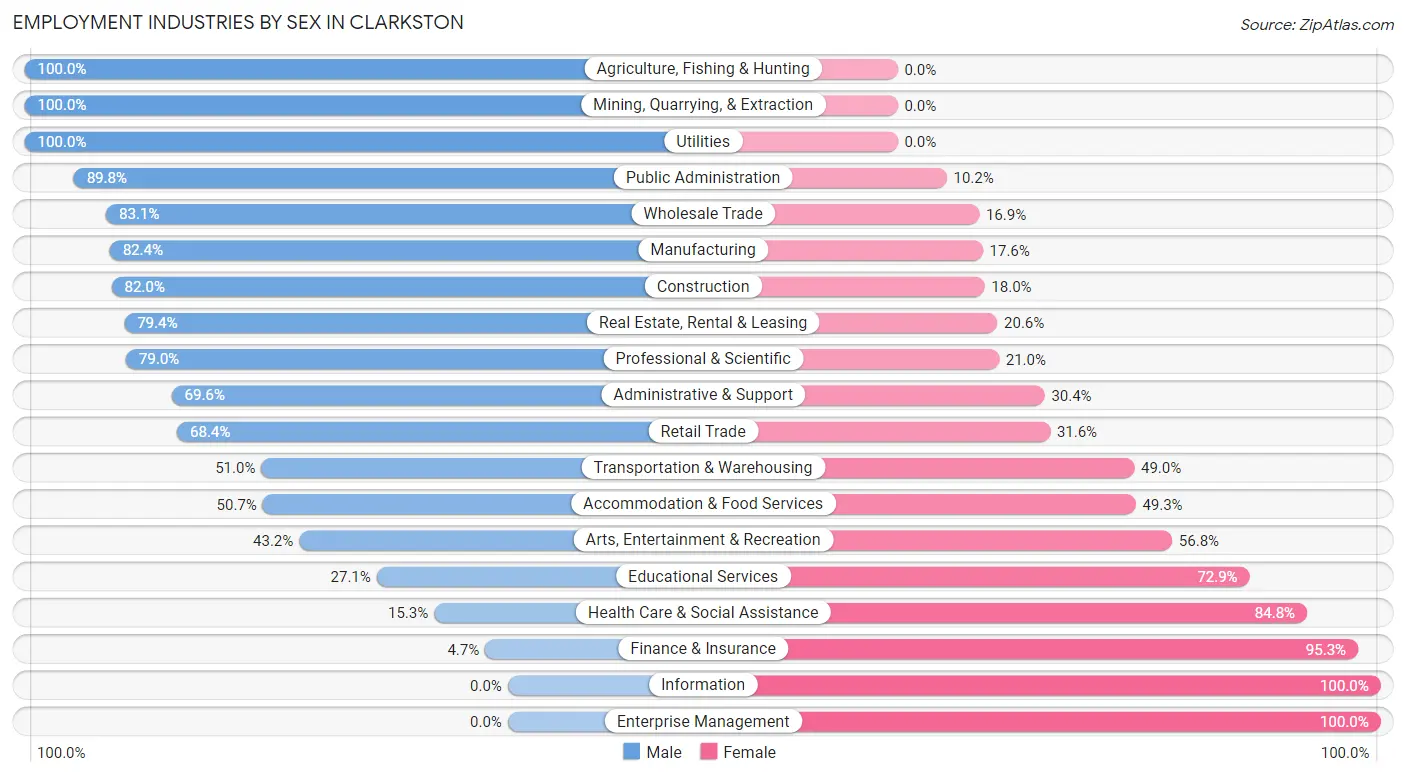
Employment Industries by Sex in Clarkston
The Clarkston industries that see more men than women are Agriculture, Fishing & Hunting (100.0%), Mining, Quarrying, & Extraction (100.0%), and Utilities (100.0%), whereas the industries that tend to have a higher number of women are Information (100.0%), Enterprise Management (100.0%), and Finance & Insurance (95.3%).
| Industry | Male | Female |
| Agriculture, Fishing & Hunting | 10 (100.0%) | 0 (0.0%) |
| Mining, Quarrying, & Extraction | 30 (100.0%) | 0 (0.0%) |
| Construction | 255 (82.0%) | 56 (18.0%) |
| Manufacturing | 271 (82.4%) | 58 (17.6%) |
| Wholesale Trade | 64 (83.1%) | 13 (16.9%) |
| Retail Trade | 271 (68.4%) | 125 (31.6%) |
| Transportation & Warehousing | 25 (51.0%) | 24 (49.0%) |
| Utilities | 21 (100.0%) | 0 (0.0%) |
| Information | 0 (0.0%) | 13 (100.0%) |
| Finance & Insurance | 6 (4.7%) | 122 (95.3%) |
| Real Estate, Rental & Leasing | 50 (79.4%) | 13 (20.6%) |
| Professional & Scientific | 113 (79.0%) | 30 (21.0%) |
| Enterprise Management | 0 (0.0%) | 11 (100.0%) |
| Administrative & Support | 96 (69.6%) | 42 (30.4%) |
| Educational Services | 54 (27.1%) | 145 (72.9%) |
| Health Care & Social Assistance | 99 (15.2%) | 550 (84.8%) |
| Arts, Entertainment & Recreation | 19 (43.2%) | 25 (56.8%) |
| Accommodation & Food Services | 242 (50.7%) | 235 (49.3%) |
| Public Administration | 53 (89.8%) | 6 (10.2%) |
| Total | 1,728 (52.7%) | 1,551 (47.3%) |
Education in Clarkston
School Enrollment in Clarkston
The most common levels of schooling among the 1,376 students in Clarkston are elementary school (299 | 21.7%), high school (290 | 21.1%), and middle school (257 | 18.7%).
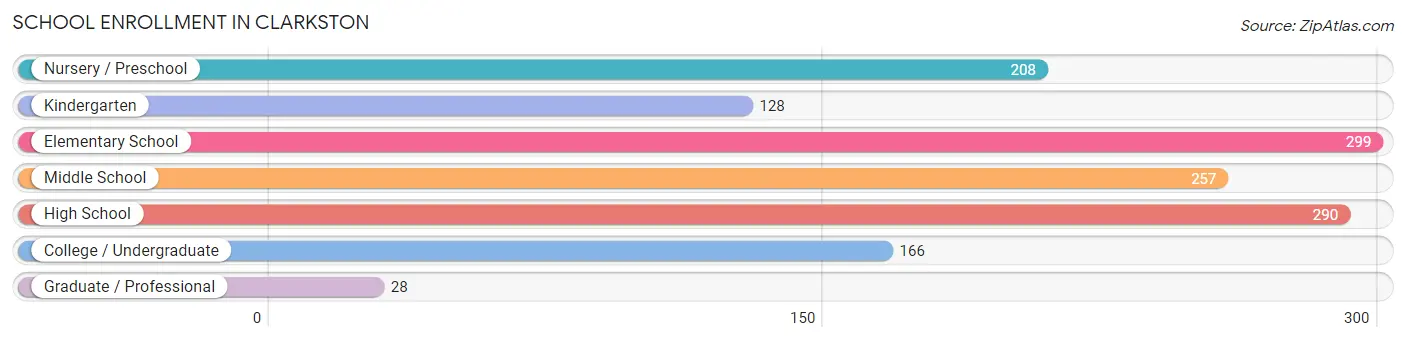
| School Level | # Students | % Students |
| Nursery / Preschool | 208 | 15.1% |
| Kindergarten | 128 | 9.3% |
| Elementary School | 299 | 21.7% |
| Middle School | 257 | 18.7% |
| High School | 290 | 21.1% |
| College / Undergraduate | 166 | 12.1% |
| Graduate / Professional | 28 | 2.0% |
| Total | 1,376 | 100.0% |
School Enrollment by Age by Funding Source in Clarkston
Out of a total of 1,376 students who are enrolled in schools in Clarkston, 283 (20.6%) attend a private institution, while the remaining 1,093 (79.4%) are enrolled in public schools. The age group of 3 to 4 year olds has the highest likelihood of being enrolled in private schools, with 95 (51.9% in the age bracket) enrolled. Conversely, the age group of 18 to 19 year olds has the lowest likelihood of being enrolled in a private school, with 41 (100.0% in the age bracket) attending a public institution.
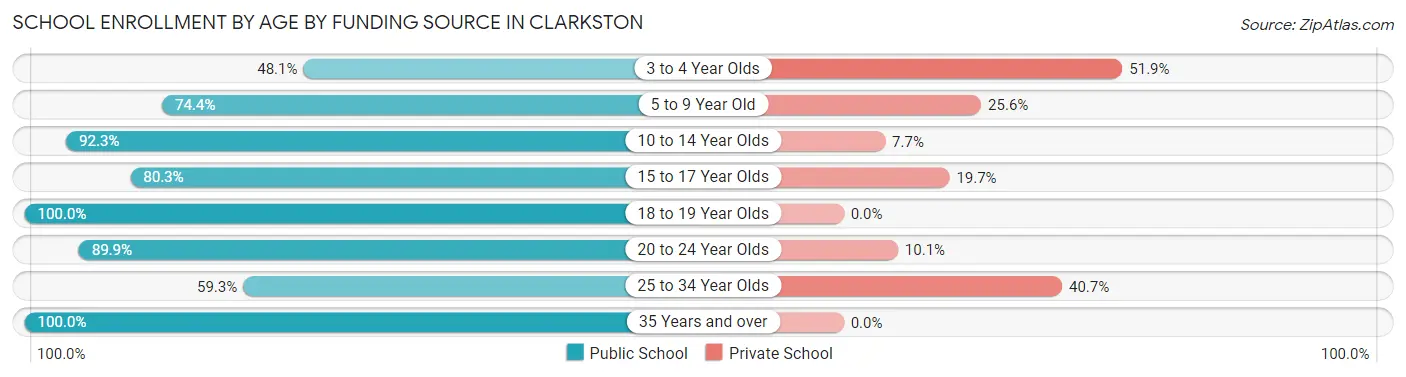
| Age Bracket | Public School | Private School |
| 3 to 4 Year Olds | 88 (48.1%) | 95 (51.9%) |
| 5 to 9 Year Old | 244 (74.4%) | 84 (25.6%) |
| 10 to 14 Year Olds | 370 (92.3%) | 31 (7.7%) |
| 15 to 17 Year Olds | 163 (80.3%) | 40 (19.7%) |
| 18 to 19 Year Olds | 41 (100.0%) | 0 (0.0%) |
| 20 to 24 Year Olds | 89 (89.9%) | 10 (10.1%) |
| 25 to 34 Year Olds | 35 (59.3%) | 24 (40.7%) |
| 35 Years and over | 62 (100.0%) | 0 (0.0%) |
| Total | 1,093 (79.4%) | 283 (20.6%) |
Educational Attainment by Field of Study in Clarkston
Science & technology (143 | 17.1%), education (130 | 15.5%), business (115 | 13.8%), arts & humanities (86 | 10.3%), and communications (63 | 7.5%) are the most common fields of study among 836 individuals in Clarkston who have obtained a bachelor's degree or higher.
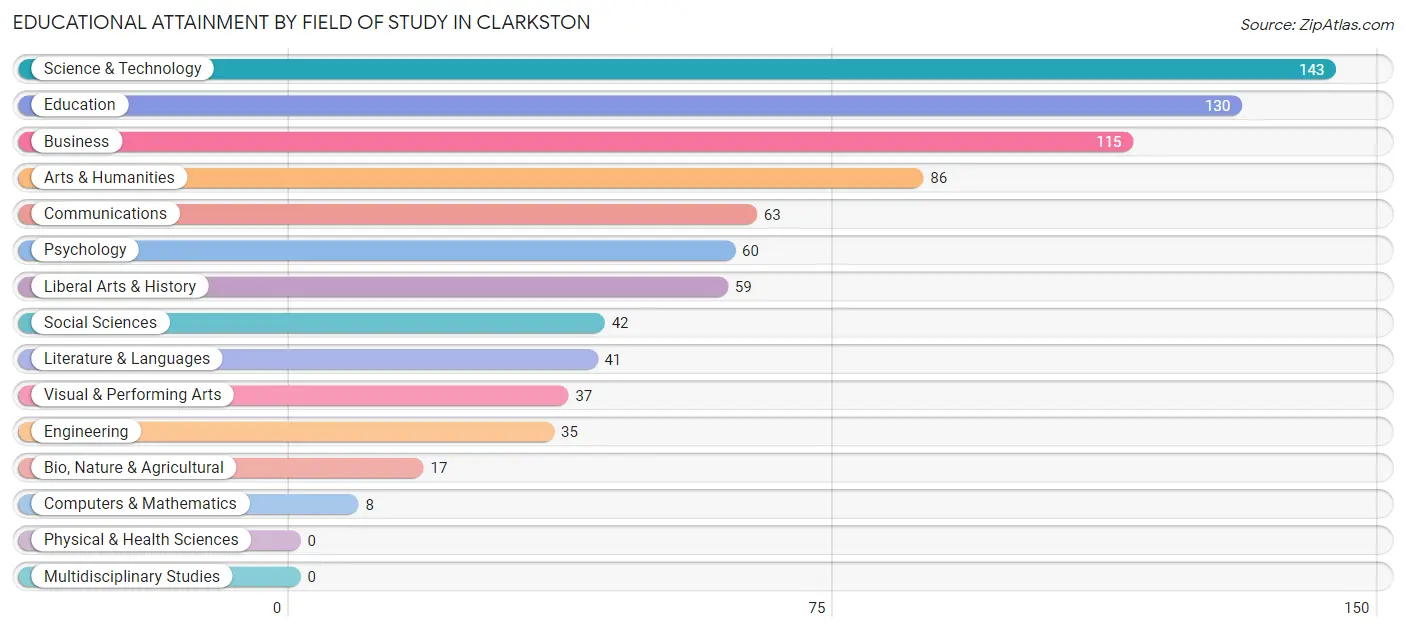
| Field of Study | # Graduates | % Graduates |
| Computers & Mathematics | 8 | 1.0% |
| Bio, Nature & Agricultural | 17 | 2.0% |
| Physical & Health Sciences | 0 | 0.0% |
| Psychology | 60 | 7.2% |
| Social Sciences | 42 | 5.0% |
| Engineering | 35 | 4.2% |
| Multidisciplinary Studies | 0 | 0.0% |
| Science & Technology | 143 | 17.1% |
| Business | 115 | 13.8% |
| Education | 130 | 15.5% |
| Literature & Languages | 41 | 4.9% |
| Liberal Arts & History | 59 | 7.1% |
| Visual & Performing Arts | 37 | 4.4% |
| Communications | 63 | 7.5% |
| Arts & Humanities | 86 | 10.3% |
| Total | 836 | 100.0% |
Transportation & Commute in Clarkston
Vehicle Availability by Sex in Clarkston
The most prevalent vehicle ownership categories in Clarkston are males with 2 vehicles (529, accounting for 31.7%) and females with 2 vehicles (431, making up 36.9%).
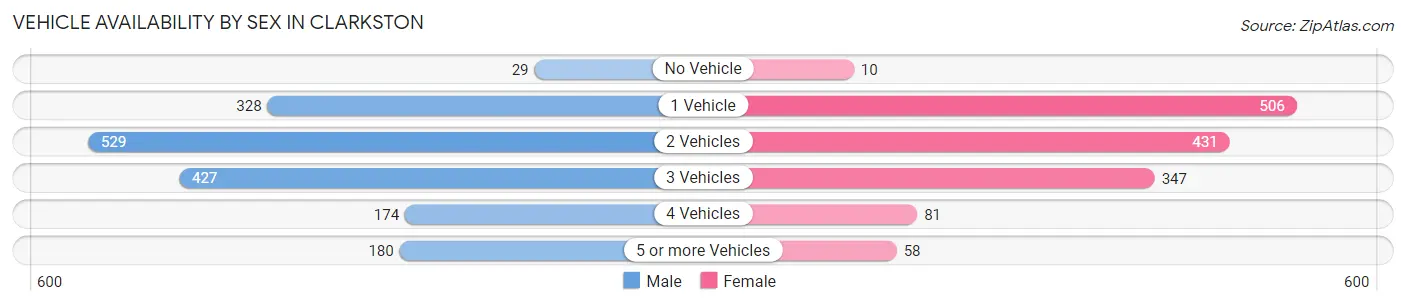
| Vehicles Available | Male | Female |
| No Vehicle | 29 (1.7%) | 10 (0.7%) |
| 1 Vehicle | 328 (19.7%) | 506 (35.3%) |
| 2 Vehicles | 529 (31.7%) | 431 (30.1%) |
| 3 Vehicles | 427 (25.6%) | 347 (24.2%) |
| 4 Vehicles | 174 (10.4%) | 81 (5.7%) |
| 5 or more Vehicles | 180 (10.8%) | 58 (4.1%) |
| Total | 1,667 (100.0%) | 1,433 (100.0%) |
Commute Time in Clarkston
The most frequently occuring commute durations in Clarkston are 5 to 9 minutes (815 commuters, 27.5%), 10 to 14 minutes (701 commuters, 23.7%), and 15 to 19 minutes (659 commuters, 22.3%).
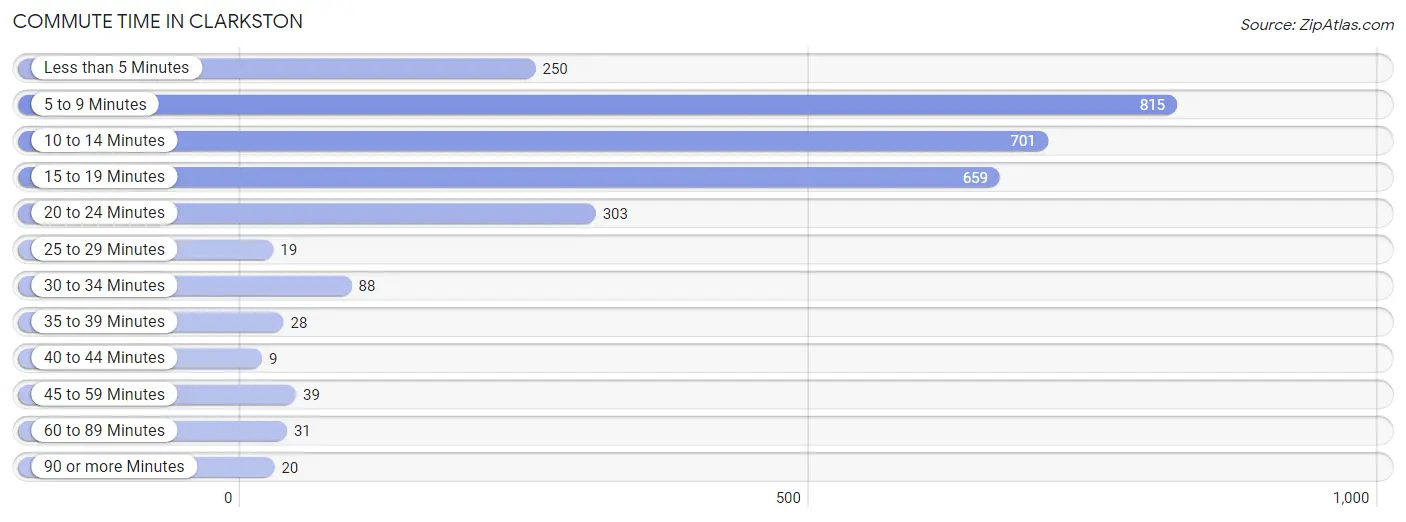
| Commute Time | # Commuters | % Commuters |
| Less than 5 Minutes | 250 | 8.4% |
| 5 to 9 Minutes | 815 | 27.5% |
| 10 to 14 Minutes | 701 | 23.7% |
| 15 to 19 Minutes | 659 | 22.3% |
| 20 to 24 Minutes | 303 | 10.2% |
| 25 to 29 Minutes | 19 | 0.6% |
| 30 to 34 Minutes | 88 | 3.0% |
| 35 to 39 Minutes | 28 | 0.9% |
| 40 to 44 Minutes | 9 | 0.3% |
| 45 to 59 Minutes | 39 | 1.3% |
| 60 to 89 Minutes | 31 | 1.1% |
| 90 or more Minutes | 20 | 0.7% |
Commute Time by Sex in Clarkston
The most common commute times in Clarkston are 15 to 19 minutes (448 commuters, 27.0%) for males and 5 to 9 minutes (441 commuters, 33.9%) for females.
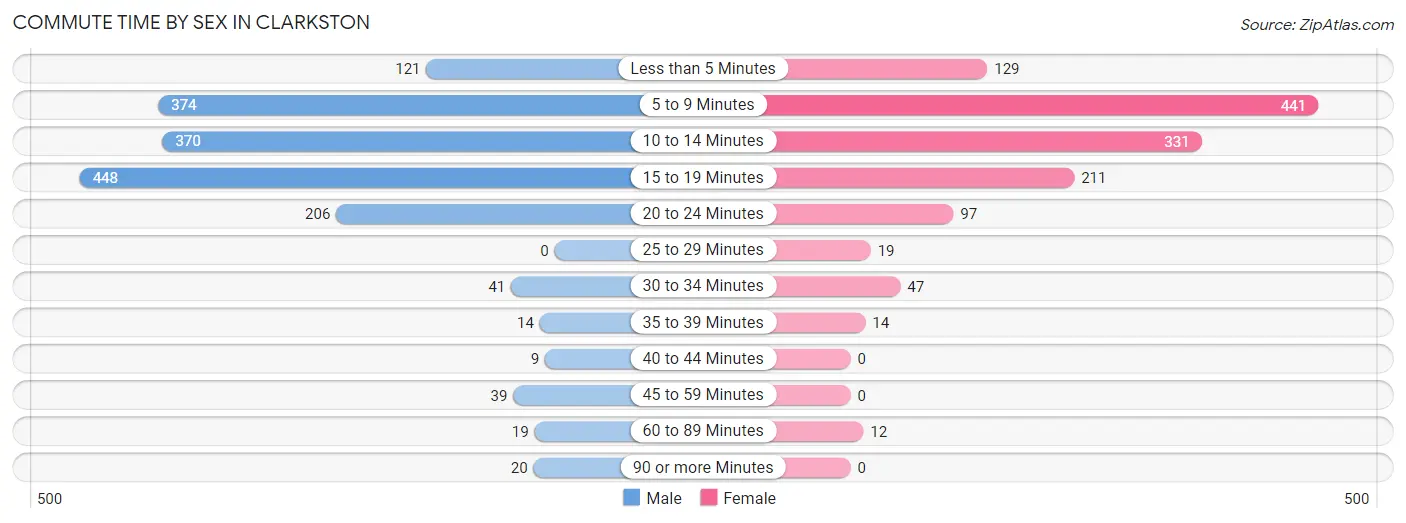
| Commute Time | Male | Female |
| Less than 5 Minutes | 121 (7.3%) | 129 (9.9%) |
| 5 to 9 Minutes | 374 (22.5%) | 441 (33.9%) |
| 10 to 14 Minutes | 370 (22.3%) | 331 (25.4%) |
| 15 to 19 Minutes | 448 (27.0%) | 211 (16.2%) |
| 20 to 24 Minutes | 206 (12.4%) | 97 (7.5%) |
| 25 to 29 Minutes | 0 (0.0%) | 19 (1.5%) |
| 30 to 34 Minutes | 41 (2.5%) | 47 (3.6%) |
| 35 to 39 Minutes | 14 (0.8%) | 14 (1.1%) |
| 40 to 44 Minutes | 9 (0.5%) | 0 (0.0%) |
| 45 to 59 Minutes | 39 (2.4%) | 0 (0.0%) |
| 60 to 89 Minutes | 19 (1.1%) | 12 (0.9%) |
| 90 or more Minutes | 20 (1.2%) | 0 (0.0%) |
Time of Departure to Work by Sex in Clarkston
The most frequent times of departure to work in Clarkston are 12:00 PM to 3:59 PM (249, 15.0%) for males and 9:00 AM to 9:59 AM (223, 17.1%) for females.
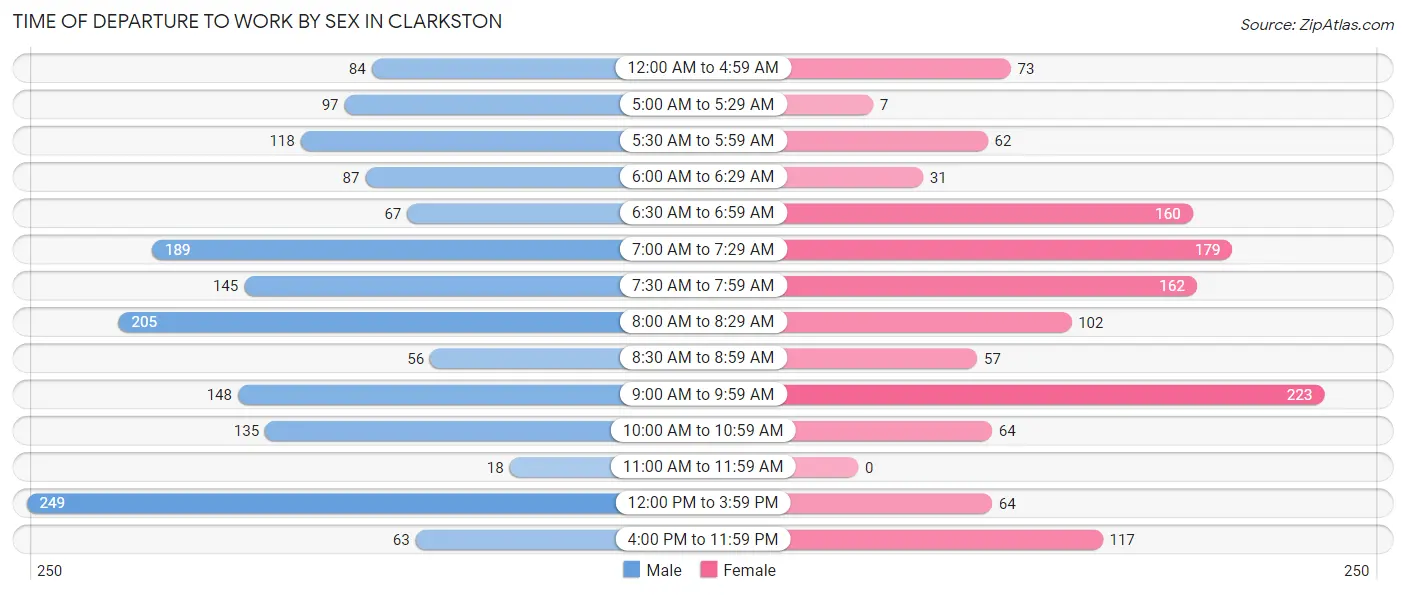
| Time of Departure | Male | Female |
| 12:00 AM to 4:59 AM | 84 (5.1%) | 73 (5.6%) |
| 5:00 AM to 5:29 AM | 97 (5.8%) | 7 (0.5%) |
| 5:30 AM to 5:59 AM | 118 (7.1%) | 62 (4.8%) |
| 6:00 AM to 6:29 AM | 87 (5.2%) | 31 (2.4%) |
| 6:30 AM to 6:59 AM | 67 (4.0%) | 160 (12.3%) |
| 7:00 AM to 7:29 AM | 189 (11.4%) | 179 (13.8%) |
| 7:30 AM to 7:59 AM | 145 (8.7%) | 162 (12.4%) |
| 8:00 AM to 8:29 AM | 205 (12.3%) | 102 (7.8%) |
| 8:30 AM to 8:59 AM | 56 (3.4%) | 57 (4.4%) |
| 9:00 AM to 9:59 AM | 148 (8.9%) | 223 (17.1%) |
| 10:00 AM to 10:59 AM | 135 (8.1%) | 64 (4.9%) |
| 11:00 AM to 11:59 AM | 18 (1.1%) | 0 (0.0%) |
| 12:00 PM to 3:59 PM | 249 (15.0%) | 64 (4.9%) |
| 4:00 PM to 11:59 PM | 63 (3.8%) | 117 (9.0%) |
| Total | 1,661 (100.0%) | 1,301 (100.0%) |
Housing Occupancy in Clarkston
Occupancy by Ownership in Clarkston
Of the total 2,846 dwellings in Clarkston, owner-occupied units account for 1,459 (51.3%), while renter-occupied units make up 1,387 (48.7%).
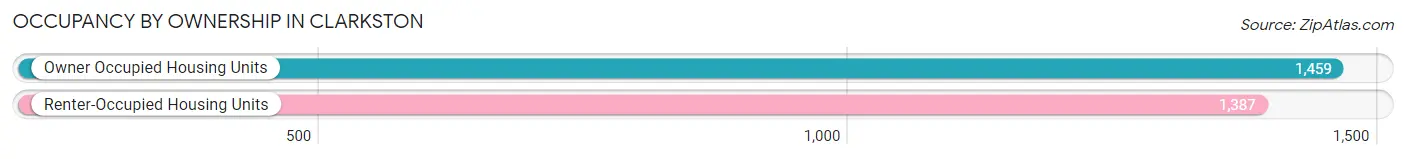
| Occupancy | # Housing Units | % Housing Units |
| Owner Occupied Housing Units | 1,459 | 51.3% |
| Renter-Occupied Housing Units | 1,387 | 48.7% |
| Total Occupied Housing Units | 2,846 | 100.0% |
Occupancy by Household Size in Clarkston
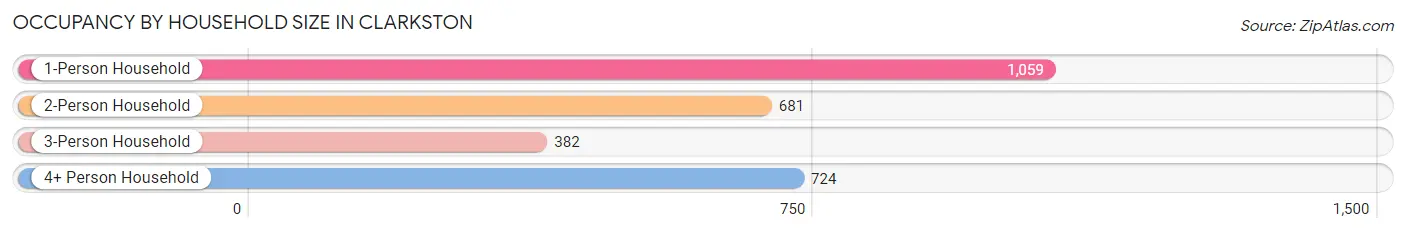
| Household Size | # Housing Units | % Housing Units |
| 1-Person Household | 1,059 | 37.2% |
| 2-Person Household | 681 | 23.9% |
| 3-Person Household | 382 | 13.4% |
| 4+ Person Household | 724 | 25.4% |
| Total Housing Units | 2,846 | 100.0% |
Occupancy by Ownership by Household Size in Clarkston
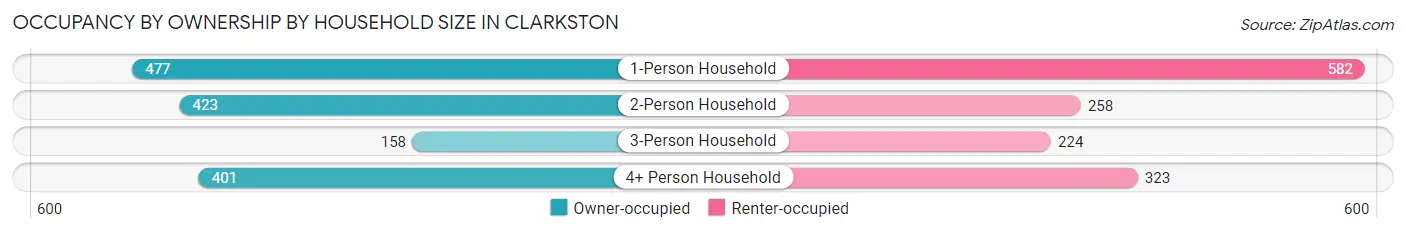
| Household Size | Owner-occupied | Renter-occupied |
| 1-Person Household | 477 (45.0%) | 582 (55.0%) |
| 2-Person Household | 423 (62.1%) | 258 (37.9%) |
| 3-Person Household | 158 (41.4%) | 224 (58.6%) |
| 4+ Person Household | 401 (55.4%) | 323 (44.6%) |
| Total Housing Units | 1,459 (51.3%) | 1,387 (48.7%) |
Occupancy by Educational Attainment in Clarkston
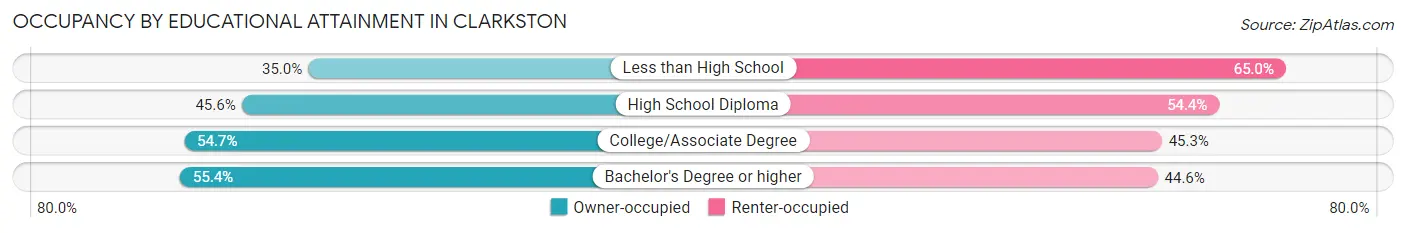
| Household Size | Owner-occupied | Renter-occupied |
| Less than High School | 48 (35.0%) | 89 (65.0%) |
| High School Diploma | 373 (45.6%) | 445 (54.4%) |
| College/Associate Degree | 749 (54.7%) | 620 (45.3%) |
| Bachelor's Degree or higher | 289 (55.4%) | 233 (44.6%) |
Occupancy by Age of Householder in Clarkston
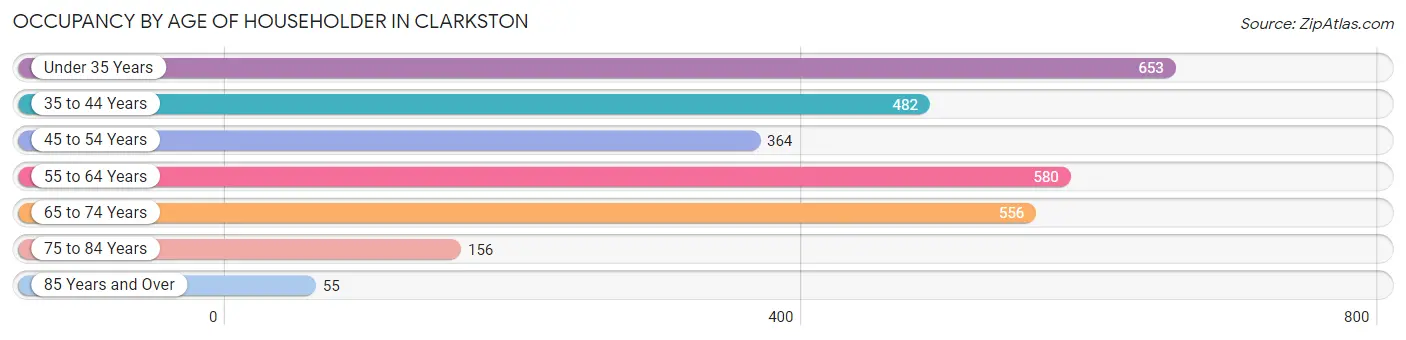
| Age Bracket | # Households | % Households |
| Under 35 Years | 653 | 22.9% |
| 35 to 44 Years | 482 | 16.9% |
| 45 to 54 Years | 364 | 12.8% |
| 55 to 64 Years | 580 | 20.4% |
| 65 to 74 Years | 556 | 19.5% |
| 75 to 84 Years | 156 | 5.5% |
| 85 Years and Over | 55 | 1.9% |
| Total | 2,846 | 100.0% |
Housing Finances in Clarkston
Median Income by Occupancy in Clarkston
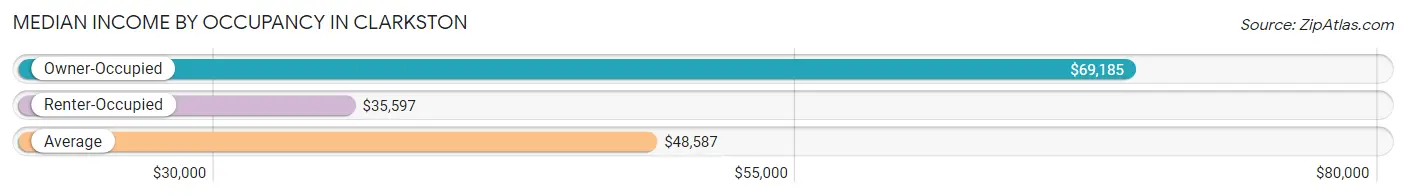
| Occupancy Type | # Households | Median Income |
| Owner-Occupied | 1,459 (51.3%) | $69,185 |
| Renter-Occupied | 1,387 (48.7%) | $35,597 |
| Average | 2,846 (100.0%) | $48,587 |
Occupancy by Householder Income Bracket in Clarkston
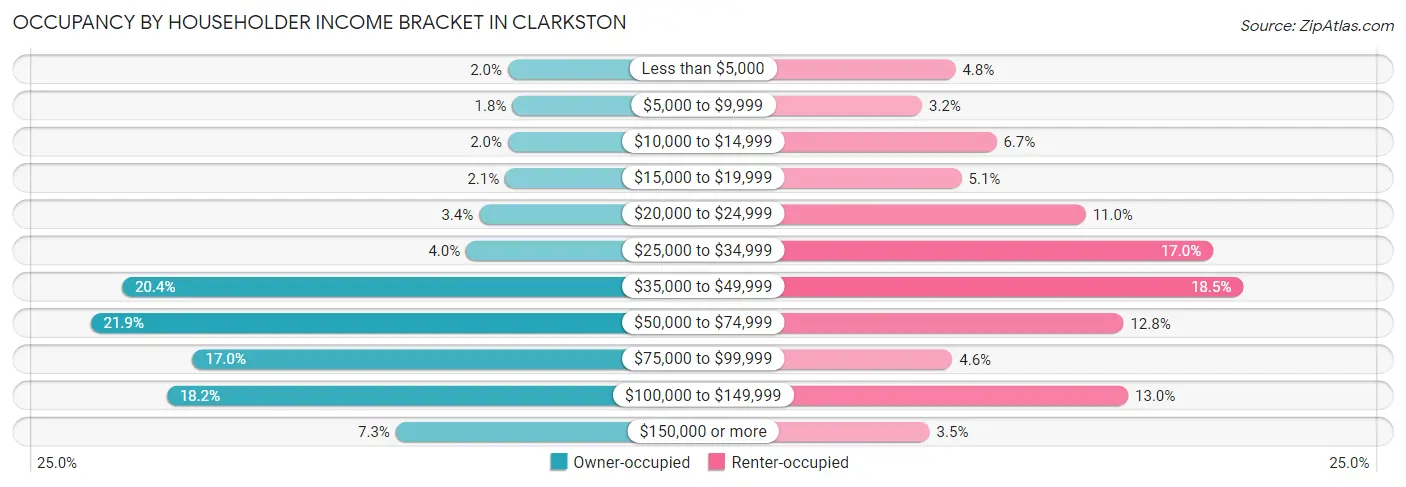
| Income Bracket | Owner-occupied | Renter-occupied |
| Less than $5,000 | 29 (2.0%) | 66 (4.8%) |
| $5,000 to $9,999 | 26 (1.8%) | 44 (3.2%) |
| $10,000 to $14,999 | 29 (2.0%) | 93 (6.7%) |
| $15,000 to $19,999 | 31 (2.1%) | 70 (5.1%) |
| $20,000 to $24,999 | 49 (3.4%) | 152 (11.0%) |
| $25,000 to $34,999 | 58 (4.0%) | 236 (17.0%) |
| $35,000 to $49,999 | 297 (20.4%) | 256 (18.5%) |
| $50,000 to $74,999 | 319 (21.9%) | 177 (12.8%) |
| $75,000 to $99,999 | 248 (17.0%) | 64 (4.6%) |
| $100,000 to $149,999 | 266 (18.2%) | 180 (13.0%) |
| $150,000 or more | 107 (7.3%) | 49 (3.5%) |
| Total | 1,459 (100.0%) | 1,387 (100.0%) |
Monthly Housing Cost Tiers in Clarkston
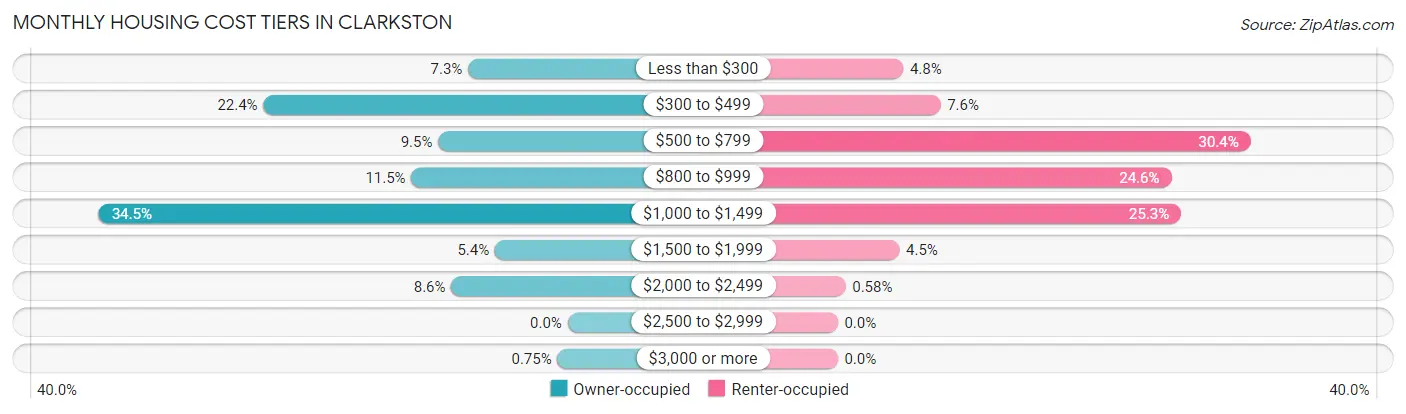
| Monthly Cost | Owner-occupied | Renter-occupied |
| Less than $300 | 107 (7.3%) | 67 (4.8%) |
| $300 to $499 | 327 (22.4%) | 105 (7.6%) |
| $500 to $799 | 139 (9.5%) | 422 (30.4%) |
| $800 to $999 | 168 (11.5%) | 341 (24.6%) |
| $1,000 to $1,499 | 504 (34.5%) | 351 (25.3%) |
| $1,500 to $1,999 | 78 (5.3%) | 63 (4.5%) |
| $2,000 to $2,499 | 125 (8.6%) | 8 (0.6%) |
| $2,500 to $2,999 | 0 (0.0%) | 0 (0.0%) |
| $3,000 or more | 11 (0.7%) | 0 (0.0%) |
| Total | 1,459 (100.0%) | 1,387 (100.0%) |
Physical Housing Characteristics in Clarkston
Housing Structures in Clarkston
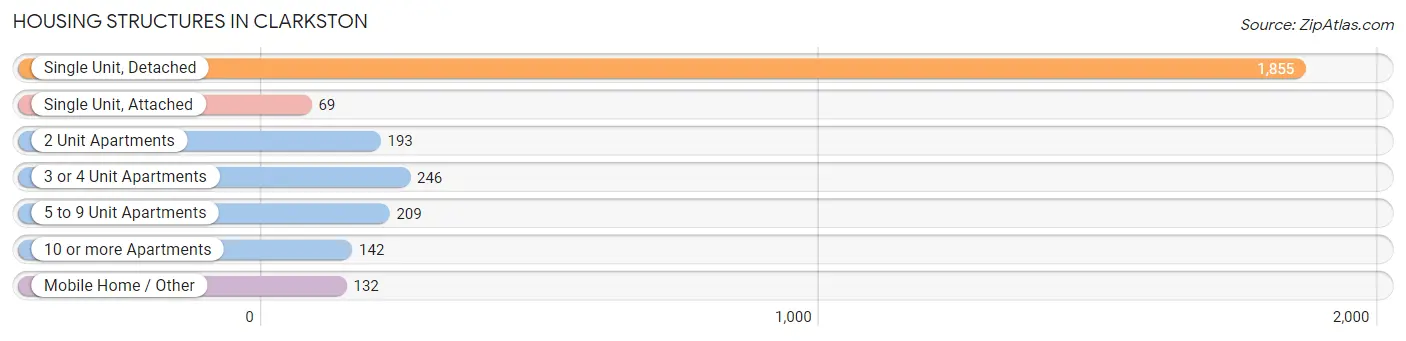
| Structure Type | # Housing Units | % Housing Units |
| Single Unit, Detached | 1,855 | 65.2% |
| Single Unit, Attached | 69 | 2.4% |
| 2 Unit Apartments | 193 | 6.8% |
| 3 or 4 Unit Apartments | 246 | 8.6% |
| 5 to 9 Unit Apartments | 209 | 7.3% |
| 10 or more Apartments | 142 | 5.0% |
| Mobile Home / Other | 132 | 4.6% |
| Total | 2,846 | 100.0% |
Housing Structures by Occupancy in Clarkston
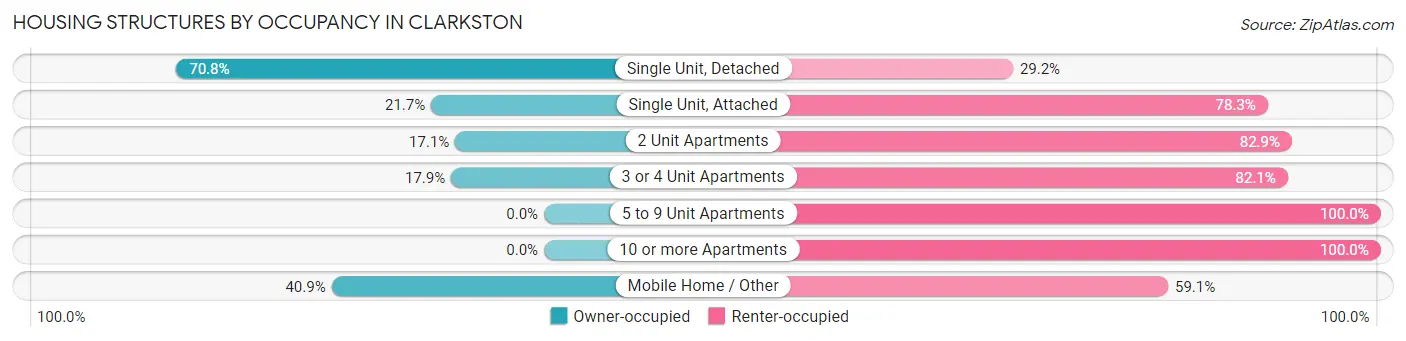
| Structure Type | Owner-occupied | Renter-occupied |
| Single Unit, Detached | 1,313 (70.8%) | 542 (29.2%) |
| Single Unit, Attached | 15 (21.7%) | 54 (78.3%) |
| 2 Unit Apartments | 33 (17.1%) | 160 (82.9%) |
| 3 or 4 Unit Apartments | 44 (17.9%) | 202 (82.1%) |
| 5 to 9 Unit Apartments | 0 (0.0%) | 209 (100.0%) |
| 10 or more Apartments | 0 (0.0%) | 142 (100.0%) |
| Mobile Home / Other | 54 (40.9%) | 78 (59.1%) |
| Total | 1,459 (51.3%) | 1,387 (48.7%) |
Housing Structures by Number of Rooms in Clarkston
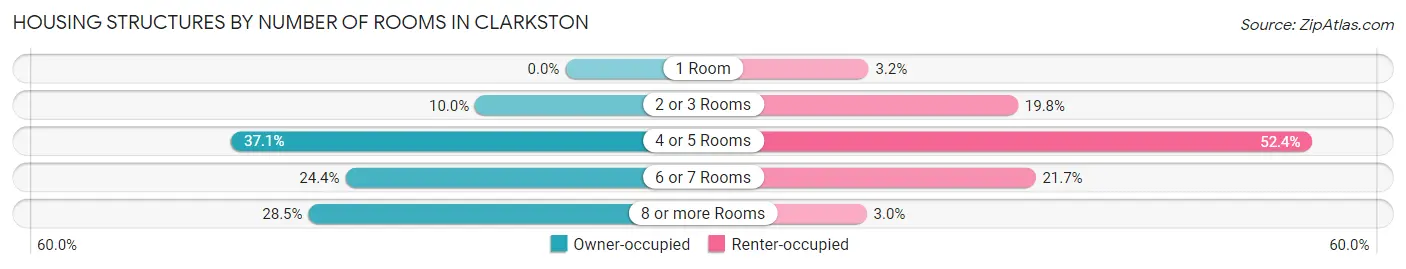
| Number of Rooms | Owner-occupied | Renter-occupied |
| 1 Room | 0 (0.0%) | 44 (3.2%) |
| 2 or 3 Rooms | 146 (10.0%) | 274 (19.8%) |
| 4 or 5 Rooms | 541 (37.1%) | 727 (52.4%) |
| 6 or 7 Rooms | 356 (24.4%) | 301 (21.7%) |
| 8 or more Rooms | 416 (28.5%) | 41 (3.0%) |
| Total | 1,459 (100.0%) | 1,387 (100.0%) |
Housing Structure by Heating Type in Clarkston
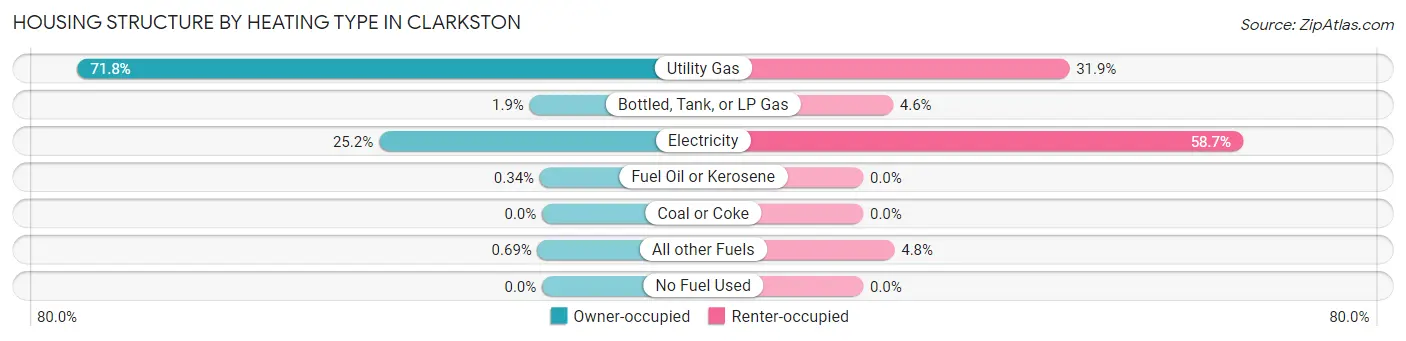
| Heating Type | Owner-occupied | Renter-occupied |
| Utility Gas | 1,048 (71.8%) | 442 (31.9%) |
| Bottled, Tank, or LP Gas | 28 (1.9%) | 64 (4.6%) |
| Electricity | 368 (25.2%) | 814 (58.7%) |
| Fuel Oil or Kerosene | 5 (0.3%) | 0 (0.0%) |
| Coal or Coke | 0 (0.0%) | 0 (0.0%) |
| All other Fuels | 10 (0.7%) | 67 (4.8%) |
| No Fuel Used | 0 (0.0%) | 0 (0.0%) |
| Total | 1,459 (100.0%) | 1,387 (100.0%) |
Household Vehicle Usage in Clarkston
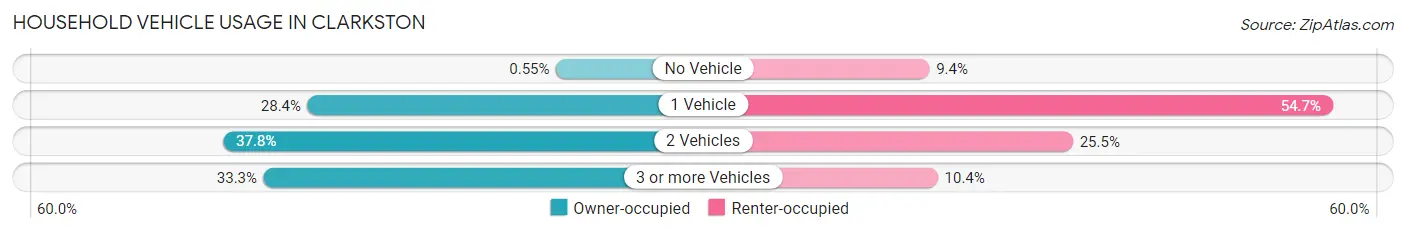
| Vehicles per Household | Owner-occupied | Renter-occupied |
| No Vehicle | 8 (0.5%) | 131 (9.4%) |
| 1 Vehicle | 414 (28.4%) | 758 (54.6%) |
| 2 Vehicles | 551 (37.8%) | 354 (25.5%) |
| 3 or more Vehicles | 486 (33.3%) | 144 (10.4%) |
| Total | 1,459 (100.0%) | 1,387 (100.0%) |
Real Estate & Mortgages in Clarkston
Real Estate and Mortgage Overview in Clarkston
| Characteristic | Without Mortgage | With Mortgage |
| Housing Units | 499 | 960 |
| Median Property Value | $183,000 | $195,300 |
| Median Household Income | $53,750 | $101 |
| Monthly Housing Costs | $409 | $11 |
| Real Estate Taxes | $1,510 | $22 |
Property Value by Mortgage Status in Clarkston
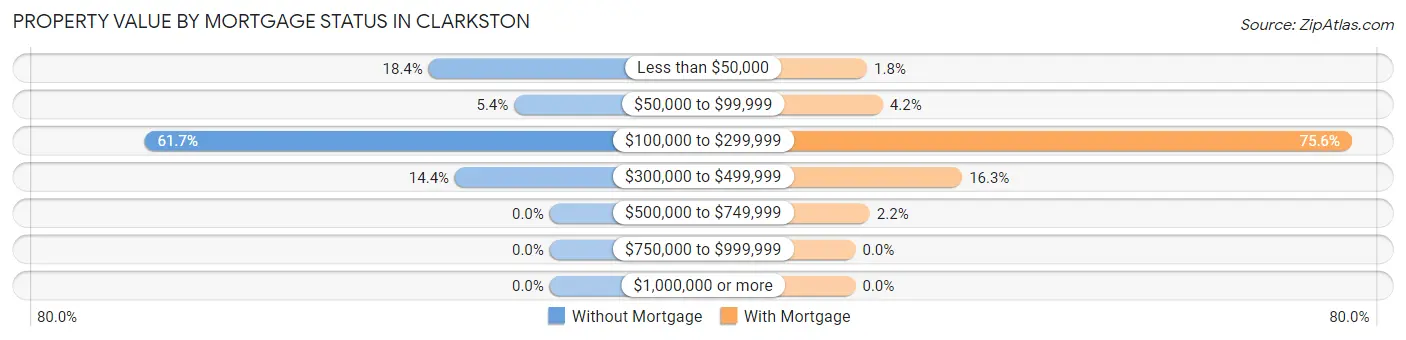
| Property Value | Without Mortgage | With Mortgage |
| Less than $50,000 | 92 (18.4%) | 17 (1.8%) |
| $50,000 to $99,999 | 27 (5.4%) | 40 (4.2%) |
| $100,000 to $299,999 | 308 (61.7%) | 726 (75.6%) |
| $300,000 to $499,999 | 72 (14.4%) | 156 (16.3%) |
| $500,000 to $749,999 | 0 (0.0%) | 21 (2.2%) |
| $750,000 to $999,999 | 0 (0.0%) | 0 (0.0%) |
| $1,000,000 or more | 0 (0.0%) | 0 (0.0%) |
| Total | 499 (100.0%) | 960 (100.0%) |
Household Income by Mortgage Status in Clarkston
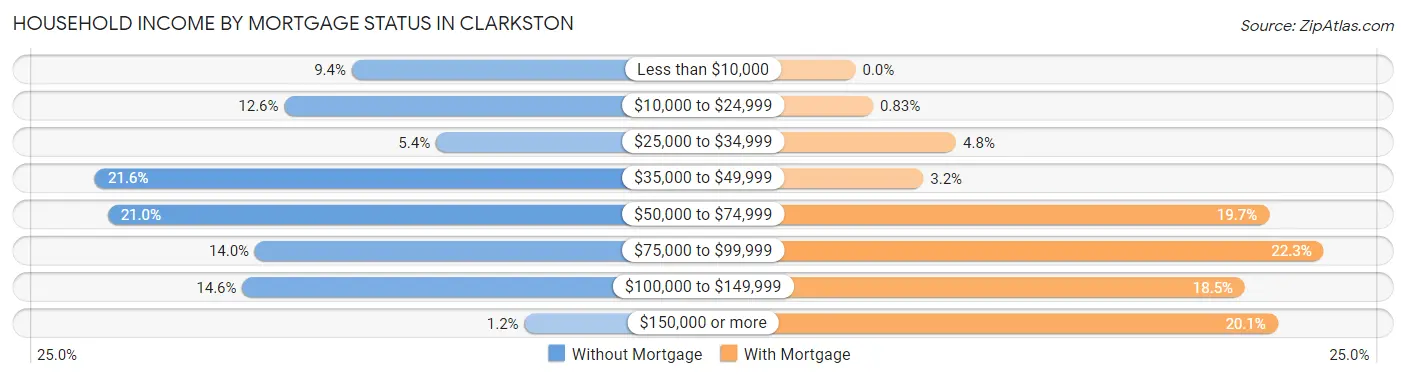
| Household Income | Without Mortgage | With Mortgage |
| Less than $10,000 | 47 (9.4%) | 0 (0.0%) |
| $10,000 to $24,999 | 63 (12.6%) | 8 (0.8%) |
| $25,000 to $34,999 | 27 (5.4%) | 46 (4.8%) |
| $35,000 to $49,999 | 108 (21.6%) | 31 (3.2%) |
| $50,000 to $74,999 | 105 (21.0%) | 189 (19.7%) |
| $75,000 to $99,999 | 70 (14.0%) | 214 (22.3%) |
| $100,000 to $149,999 | 73 (14.6%) | 178 (18.5%) |
| $150,000 or more | 6 (1.2%) | 193 (20.1%) |
| Total | 499 (100.0%) | 960 (100.0%) |
Property Value to Household Income Ratio in Clarkston

| Value-to-Income Ratio | Without Mortgage | With Mortgage |
| Less than 2.0x | 132 (26.5%) | 74,048 (7,713.3%) |
| 2.0x to 2.9x | 165 (33.1%) | 332 (34.6%) |
| 3.0x to 3.9x | 23 (4.6%) | 217 (22.6%) |
| 4.0x or more | 179 (35.9%) | 154 (16.0%) |
| Total | 499 (100.0%) | 960 (100.0%) |
Real Estate Taxes by Mortgage Status in Clarkston
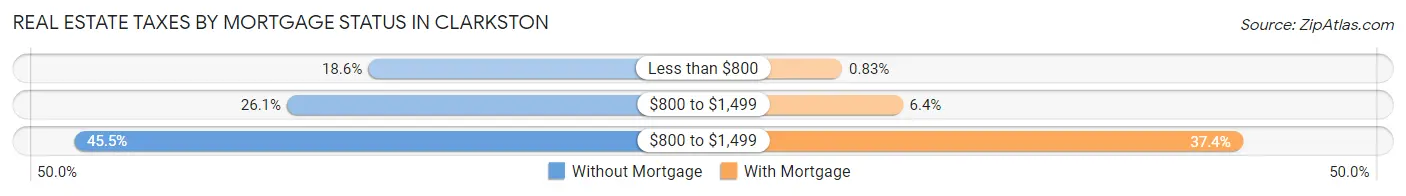
| Property Taxes | Without Mortgage | With Mortgage |
| Less than $800 | 93 (18.6%) | 8 (0.8%) |
| $800 to $1,499 | 130 (26.1%) | 61 (6.4%) |
| $800 to $1,499 | 227 (45.5%) | 359 (37.4%) |
| Total | 499 (100.0%) | 960 (100.0%) |
Health & Disability in Clarkston
Health Insurance Coverage by Age in Clarkston
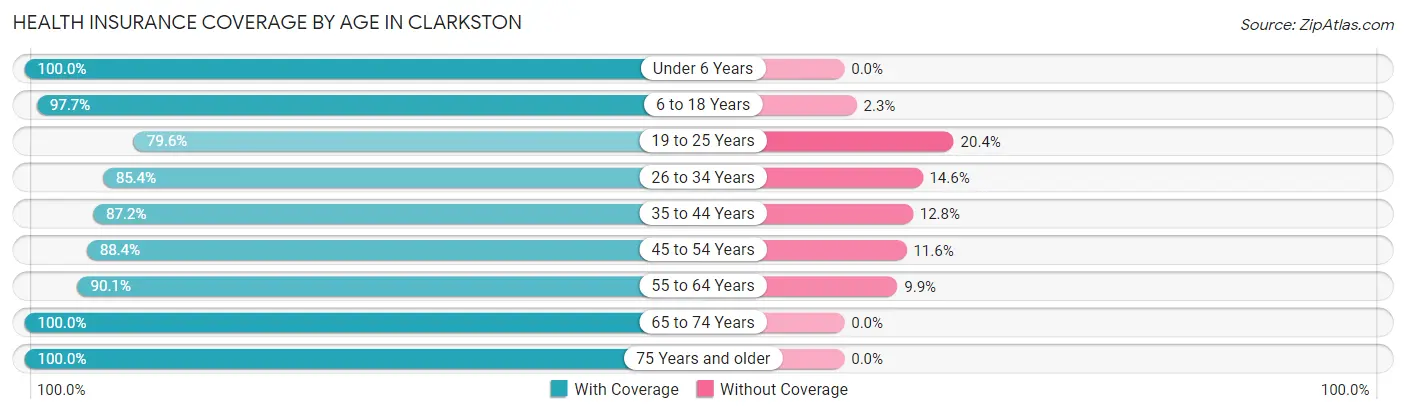
| Age Bracket | With Coverage | Without Coverage |
| Under 6 Years | 763 (100.0%) | 0 (0.0%) |
| 6 to 18 Years | 898 (97.7%) | 21 (2.3%) |
| 19 to 25 Years | 777 (79.6%) | 199 (20.4%) |
| 26 to 34 Years | 668 (85.4%) | 114 (14.6%) |
| 35 to 44 Years | 977 (87.2%) | 143 (12.8%) |
| 45 to 54 Years | 602 (88.4%) | 79 (11.6%) |
| 55 to 64 Years | 765 (90.1%) | 84 (9.9%) |
| 65 to 74 Years | 657 (100.0%) | 0 (0.0%) |
| 75 Years and older | 346 (100.0%) | 0 (0.0%) |
| Total | 6,453 (91.0%) | 640 (9.0%) |
Health Insurance Coverage by Citizenship Status in Clarkston
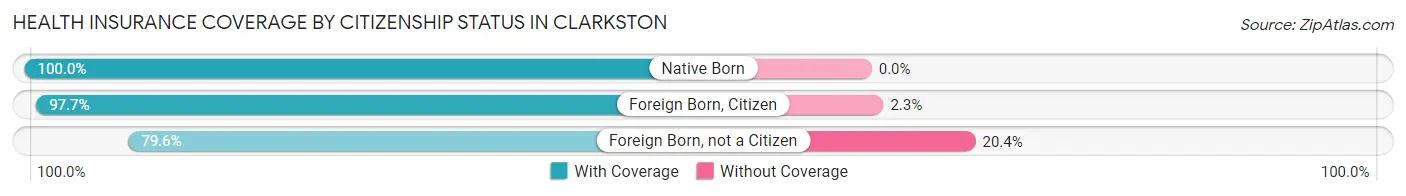
| Citizenship Status | With Coverage | Without Coverage |
| Native Born | 763 (100.0%) | 0 (0.0%) |
| Foreign Born, Citizen | 898 (97.7%) | 21 (2.3%) |
| Foreign Born, not a Citizen | 777 (79.6%) | 199 (20.4%) |
Health Insurance Coverage by Household Income in Clarkston
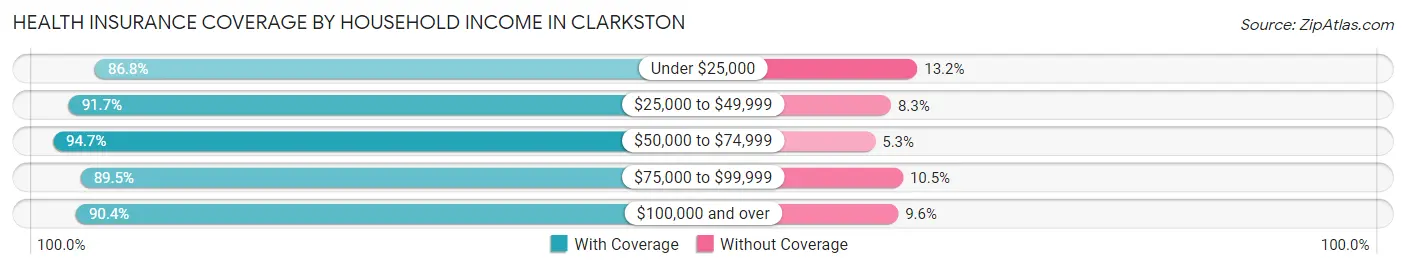
| Household Income | With Coverage | Without Coverage |
| Under $25,000 | 782 (86.8%) | 119 (13.2%) |
| $25,000 to $49,999 | 1,687 (91.7%) | 152 (8.3%) |
| $50,000 to $74,999 | 1,293 (94.7%) | 73 (5.3%) |
| $75,000 to $99,999 | 919 (89.5%) | 108 (10.5%) |
| $100,000 and over | 1,765 (90.4%) | 188 (9.6%) |
Public vs Private Health Insurance Coverage by Age in Clarkston
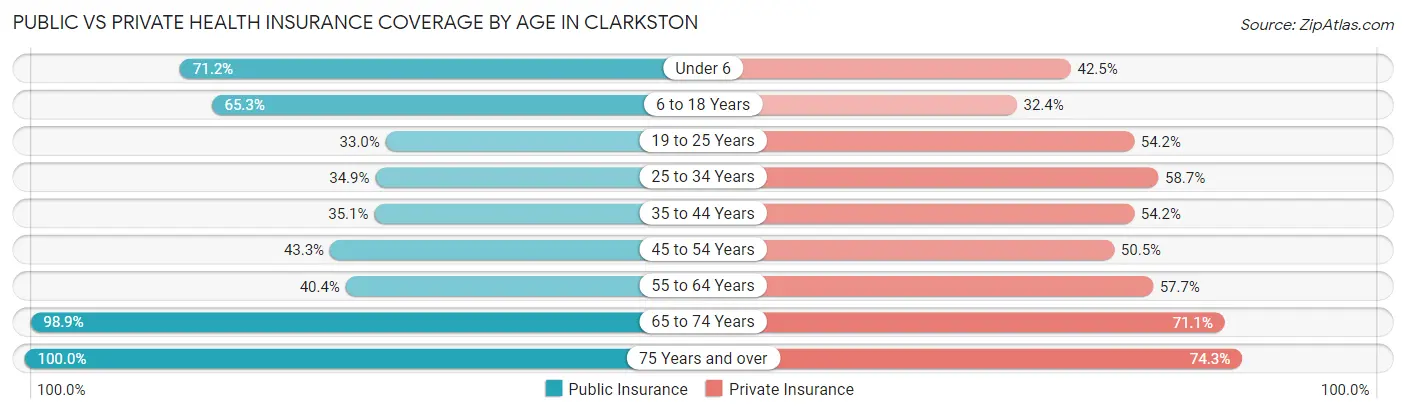
| Age Bracket | Public Insurance | Private Insurance |
| Under 6 | 543 (71.2%) | 324 (42.5%) |
| 6 to 18 Years | 600 (65.3%) | 298 (32.4%) |
| 19 to 25 Years | 322 (33.0%) | 529 (54.2%) |
| 25 to 34 Years | 273 (34.9%) | 459 (58.7%) |
| 35 to 44 Years | 393 (35.1%) | 607 (54.2%) |
| 45 to 54 Years | 295 (43.3%) | 344 (50.5%) |
| 55 to 64 Years | 343 (40.4%) | 490 (57.7%) |
| 65 to 74 Years | 650 (98.9%) | 467 (71.1%) |
| 75 Years and over | 346 (100.0%) | 257 (74.3%) |
| Total | 3,765 (53.1%) | 3,775 (53.2%) |
Disability Status by Sex by Age in Clarkston
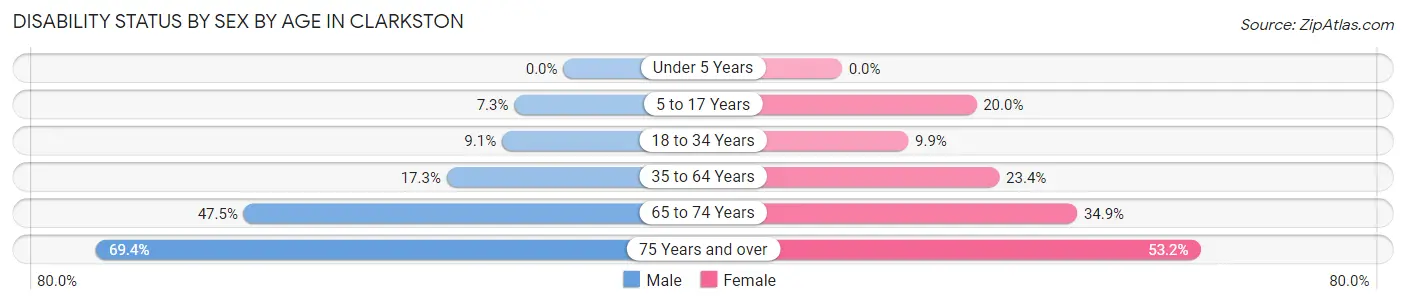
| Age Bracket | Male | Female |
| Under 5 Years | 0 (0.0%) | 0 (0.0%) |
| 5 to 17 Years | 39 (7.3%) | 92 (20.0%) |
| 18 to 34 Years | 98 (9.1%) | 74 (9.9%) |
| 35 to 64 Years | 207 (17.3%) | 340 (23.4%) |
| 65 to 74 Years | 112 (47.5%) | 147 (34.9%) |
| 75 Years and over | 111 (69.4%) | 99 (53.2%) |
Disability Class by Sex by Age in Clarkston
Disability Class: Hearing Difficulty
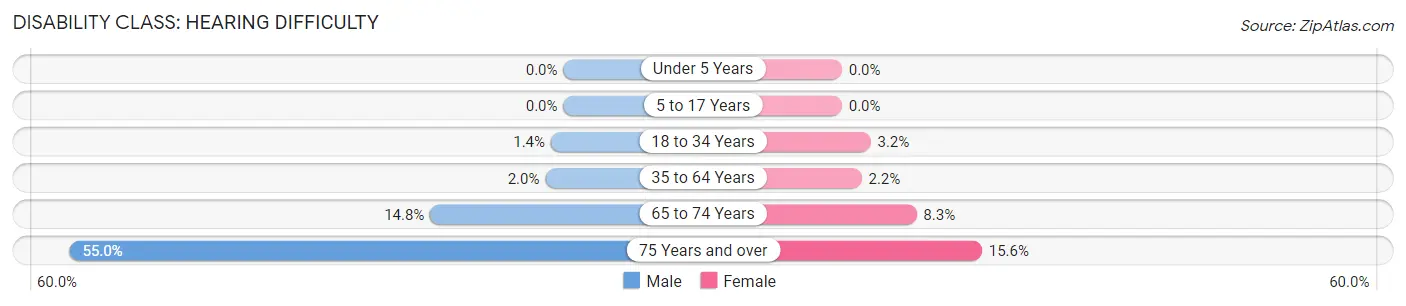
| Age Bracket | Male | Female |
| Under 5 Years | 0 (0.0%) | 0 (0.0%) |
| 5 to 17 Years | 0 (0.0%) | 0 (0.0%) |
| 18 to 34 Years | 15 (1.4%) | 24 (3.2%) |
| 35 to 64 Years | 24 (2.0%) | 32 (2.2%) |
| 65 to 74 Years | 35 (14.8%) | 35 (8.3%) |
| 75 Years and over | 88 (55.0%) | 29 (15.6%) |
Disability Class: Vision Difficulty
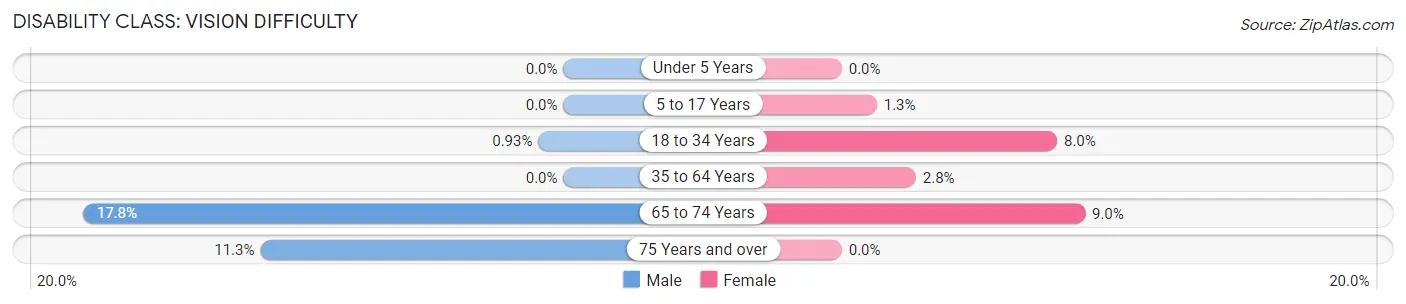
| Age Bracket | Male | Female |
| Under 5 Years | 0 (0.0%) | 0 (0.0%) |
| 5 to 17 Years | 0 (0.0%) | 6 (1.3%) |
| 18 to 34 Years | 10 (0.9%) | 60 (8.0%) |
| 35 to 64 Years | 0 (0.0%) | 40 (2.8%) |
| 65 to 74 Years | 42 (17.8%) | 38 (9.0%) |
| 75 Years and over | 18 (11.3%) | 0 (0.0%) |
Disability Class: Cognitive Difficulty
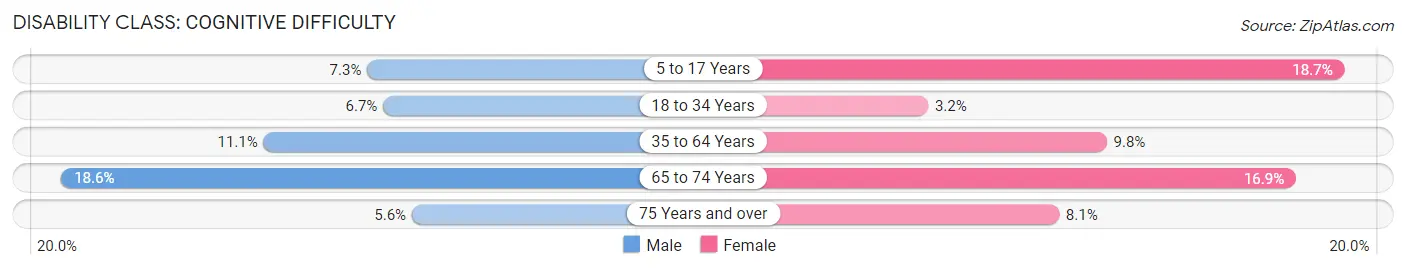
| Age Bracket | Male | Female |
| 5 to 17 Years | 39 (7.3%) | 86 (18.7%) |
| 18 to 34 Years | 72 (6.7%) | 24 (3.2%) |
| 35 to 64 Years | 133 (11.1%) | 143 (9.8%) |
| 65 to 74 Years | 44 (18.6%) | 71 (16.9%) |
| 75 Years and over | 9 (5.6%) | 15 (8.1%) |
Disability Class: Ambulatory Difficulty
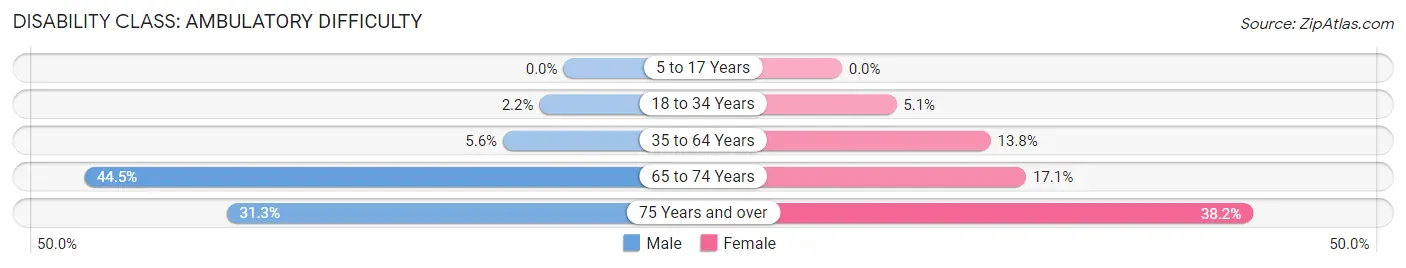
| Age Bracket | Male | Female |
| 5 to 17 Years | 0 (0.0%) | 0 (0.0%) |
| 18 to 34 Years | 24 (2.2%) | 38 (5.1%) |
| 35 to 64 Years | 67 (5.6%) | 201 (13.8%) |
| 65 to 74 Years | 105 (44.5%) | 72 (17.1%) |
| 75 Years and over | 50 (31.2%) | 71 (38.2%) |
Disability Class: Self-Care Difficulty
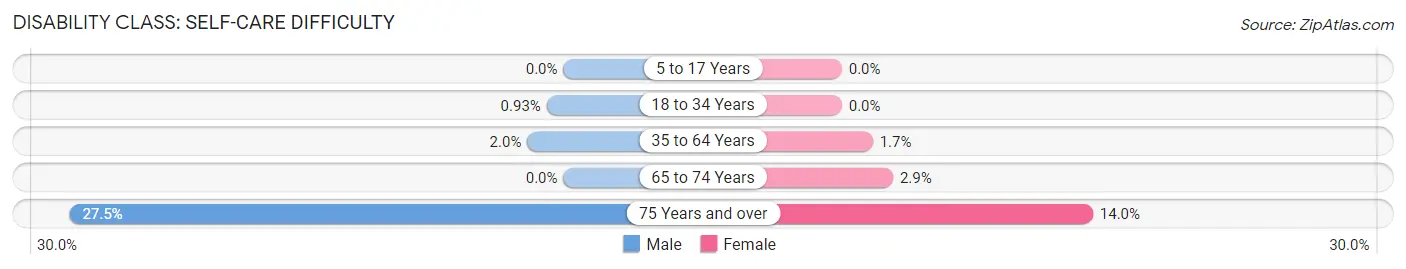
| Age Bracket | Male | Female |
| 5 to 17 Years | 0 (0.0%) | 0 (0.0%) |
| 18 to 34 Years | 10 (0.9%) | 0 (0.0%) |
| 35 to 64 Years | 24 (2.0%) | 25 (1.7%) |
| 65 to 74 Years | 0 (0.0%) | 12 (2.9%) |
| 75 Years and over | 44 (27.5%) | 26 (14.0%) |
Technology Access in Clarkston
Computing Device Access in Clarkston
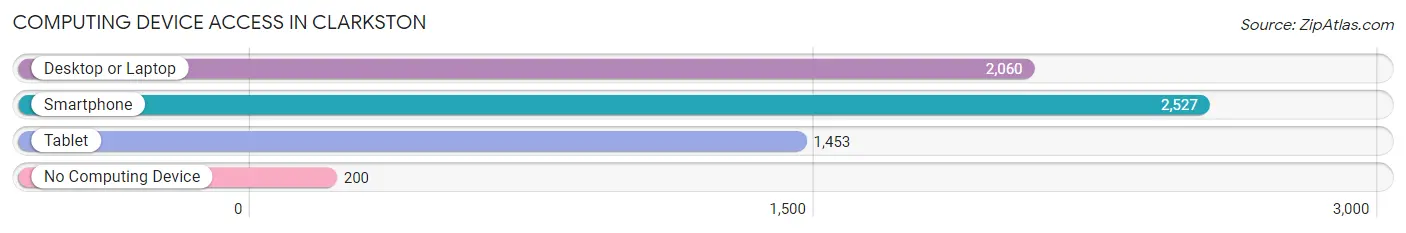
| Device Type | # Households | % Households |
| Desktop or Laptop | 2,060 | 72.4% |
| Smartphone | 2,527 | 88.8% |
| Tablet | 1,453 | 51.0% |
| No Computing Device | 200 | 7.0% |
| Total | 2,846 | 100.0% |
Internet Access in Clarkston
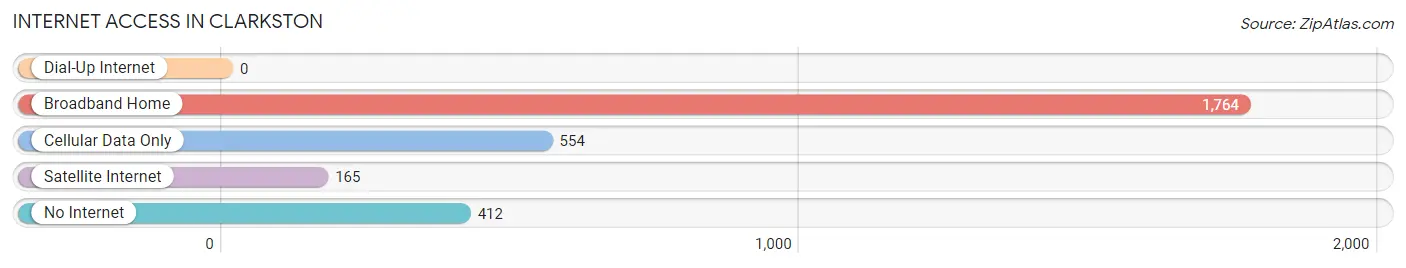
| Internet Type | # Households | % Households |
| Dial-Up Internet | 0 | 0.0% |
| Broadband Home | 1,764 | 62.0% |
| Cellular Data Only | 554 | 19.5% |
| Satellite Internet | 165 | 5.8% |
| No Internet | 412 | 14.5% |
| Total | 2,846 | 100.0% |
Clarkston Summary
Clarkston, Washington is a small city located in the southeastern corner of the state, near the Idaho border. It is part of Asotin County and is the county seat. The city is situated on the Snake River, which forms the border between Washington and Idaho. The city has a population of 7,229 as of the 2010 census, making it the largest city in Asotin County.
History
The area that is now Clarkston was first inhabited by the Nez Perce tribe, who lived in the area for thousands of years before the arrival of European settlers. The first white settlers arrived in the area in the early 1860s, and the town was officially founded in 1871. The town was named after William Clark, one of the leaders of the Lewis and Clark Expedition.
The city was originally a trading post and a stop on the Oregon Trail. It was also a major port on the Snake River, and was an important hub for the transportation of goods and people. The city was incorporated in 1891, and the first mayor was elected in 1892.
Geography
Clarkston is located in the southeastern corner of Washington, near the Idaho border. It is situated on the Snake River, which forms the border between Washington and Idaho. The city is located at an elevation of 745 feet (227 m).
The city has a total area of 4.2 square miles (10.8 km2), of which 4.1 square miles (10.6 km2) is land and 0.1 square miles (0.2 km2) is water. The city is located in a semi-arid climate zone, with hot summers and cold winters.
Economy
The economy of Clarkston is largely based on agriculture and tourism. The city is home to several wineries, and is a popular destination for wine tasting. The city is also home to several manufacturing companies, including a paper mill and a wood products plant.
The city is also home to several retail stores, restaurants, and other businesses. The city is served by the Port of Clarkston, which is a major shipping port for the region.
Demographics
As of the 2010 census, the population of Clarkston was 7,229. The racial makeup of the city was 90.2% White, 0.7% African American, 0.7% Native American, 0.7% Asian, 0.1% Pacific Islander, 5.2% from other races, and 2.3% from two or more races. Hispanic or Latino of any race were 10.2% of the population.
The median income for a household in the city was $35,938, and the median income for a family was $41,944. The per capita income for the city was $17,945. About 14.2% of families and 17.3% of the population were below the poverty line, including 24.2% of those under age 18 and 8.2% of those age 65 or over.
Conclusion
Clarkston, Washington is a small city located in the southeastern corner of the state, near the Idaho border. It is part of Asotin County and is the county seat. The city is situated on the Snake River, which forms the border between Washington and Idaho. The city has a population of 7,229 as of the 2010 census, making it the largest city in Asotin County. The economy of Clarkston is largely based on agriculture and tourism, and the city is home to several wineries, manufacturing companies, retail stores, restaurants, and other businesses. The racial makeup of the city is 90.2% White, 0.7% African American, 0.7% Native American, 0.7% Asian, 0.1% Pacific Islander, 5.2% from other races, and 2.3% from two or more races. The median income for a household in the city was $35,938, and the median income for a family was $41,944.
Common Questions
What is Per Capita Income in Clarkston?
Per Capita income in Clarkston is $28,722.
What is the Median Family Income in Clarkston?
Median Family Income in Clarkston is $66,083.
What is the Median Household income in Clarkston?
Median Household Income in Clarkston is $48,587.
What is Income or Wage Gap in Clarkston?
Income or Wage Gap in Clarkston is 12.9%.
Women in Clarkston earn 87.1 cents for every dollar earned by a man.
What is Inequality or Gini Index in Clarkston?
Inequality or Gini Index in Clarkston is 0.45.
What is the Total Population of Clarkston?
Total Population of Clarkston is 7,222.
What is the Total Male Population of Clarkston?
Total Male Population of Clarkston is 3,629.
What is the Total Female Population of Clarkston?
Total Female Population of Clarkston is 3,593.
What is the Ratio of Males per 100 Females in Clarkston?
There are 101.00 Males per 100 Females in Clarkston.
What is the Ratio of Females per 100 Males in Clarkston?
There are 99.01 Females per 100 Males in Clarkston.
What is the Median Population Age in Clarkston?
Median Population Age in Clarkston is 36.2 Years.
What is the Average Family Size in Clarkston
Average Family Size in Clarkston is 3.3 People.
What is the Average Household Size in Clarkston
Average Household Size in Clarkston is 2.5 People.
How Large is the Labor Force in Clarkston?
There are 3,641 People in the Labor Forcein in Clarkston.
What is the Percentage of People in the Labor Force in Clarkston?
62.9% of People are in the Labor Force in Clarkston.
What is the Unemployment Rate in Clarkston?
Unemployment Rate in Clarkston is 9.9%.