Cities with the Highest Percentage of Native Hawaiian Population in Washington
RELATED REPORTS & OPTIONS
Native Hawaiian
Washington
Compare Cities
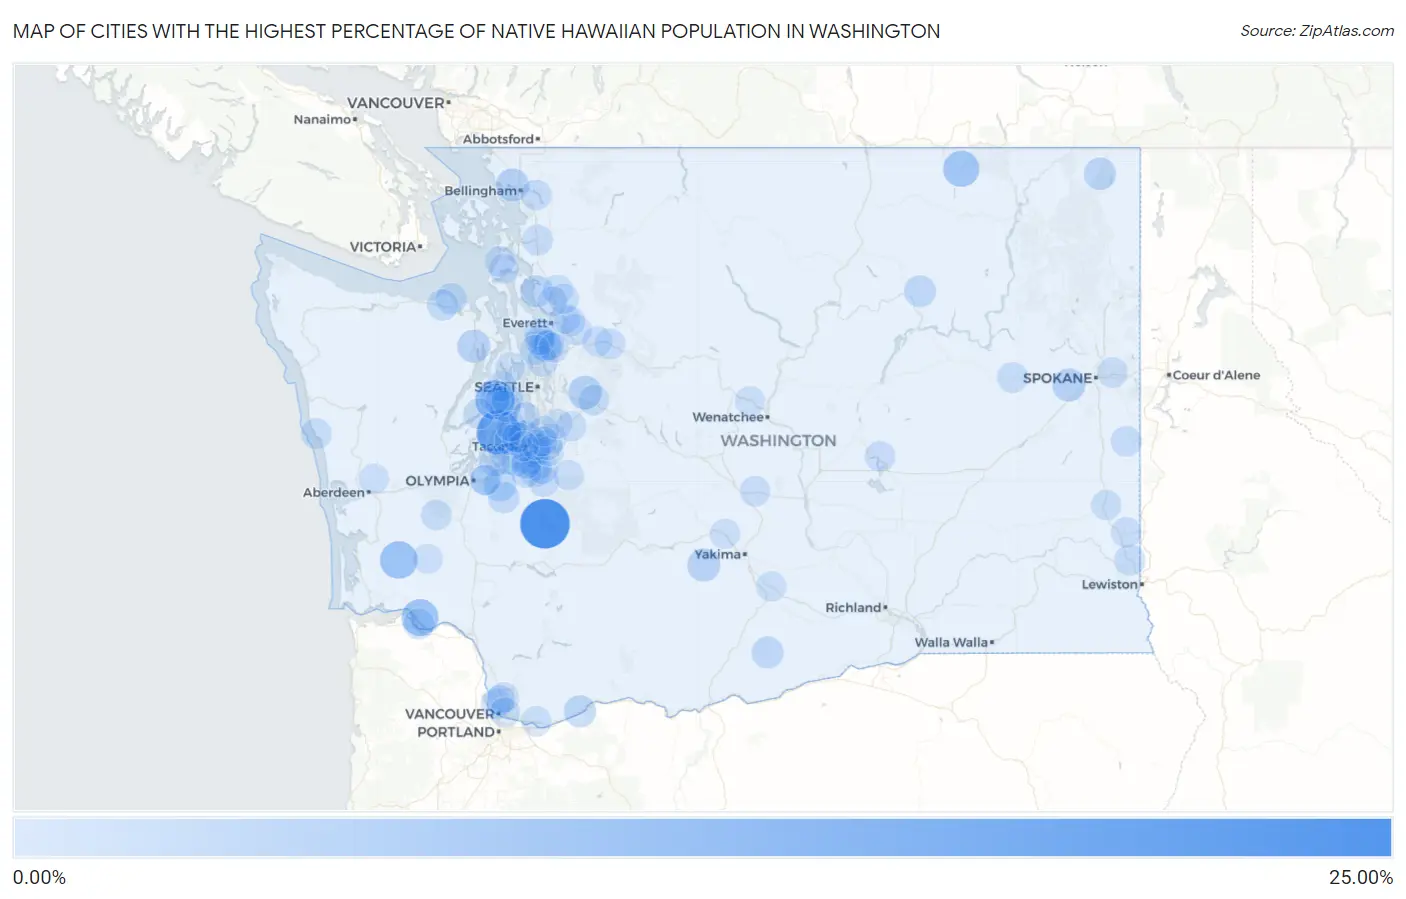
Map of Cities with the Highest Percentage of Native Hawaiian Population in Washington
0.00%
25.00%
Cities with the Highest Percentage of Native Hawaiian Population in Washington
| City | Native Hawaiian | vs State | vs National | |
| 1. | Alder | 23.39% | 0.40%(+23.0)#1 | 0.20%(+23.2)#93 |
| 2. | Raft Island | 16.85% | 0.40%(+16.5)#2 | 0.20%(+16.7)#127 |
| 3. | Gorst | 11.11% | 0.40%(+10.7)#3 | 0.20%(+10.9)#154 |
| 4. | Lebam | 8.93% | 0.40%(+8.53)#4 | 0.20%(+8.73)#168 |
| 5. | Lower Elochoman | 8.09% | 0.40%(+7.69)#5 | 0.20%(+7.89)#176 |
| 6. | Curlew | 7.41% | 0.40%(+7.01)#6 | 0.20%(+7.21)#185 |
| 7. | Fall City | 4.36% | 0.40%(+3.96)#7 | 0.20%(+4.16)#222 |
| 8. | Browns Point | 4.19% | 0.40%(+3.80)#8 | 0.20%(+4.00)#229 |
| 9. | Fairchild Afb | 3.83% | 0.40%(+3.44)#9 | 0.20%(+3.63)#240 |
| 10. | Marietta Alderwood | 3.81% | 0.40%(+3.42)#10 | 0.20%(+3.62)#243 |
| 11. | Quilcene | 3.77% | 0.40%(+3.37)#11 | 0.20%(+3.57)#246 |
| 12. | Tampico | 3.74% | 0.40%(+3.34)#12 | 0.20%(+3.54)#248 |
| 13. | Nisqually Indian Community | 3.04% | 0.40%(+2.64)#13 | 0.20%(+2.84)#281 |
| 14. | Metaline | 2.96% | 0.40%(+2.57)#14 | 0.20%(+2.77)#286 |
| 15. | Warm Beach | 2.88% | 0.40%(+2.49)#15 | 0.20%(+2.69)#289 |
| 16. | North Bonneville | 2.79% | 0.40%(+2.40)#16 | 0.20%(+2.59)#296 |
| 17. | Nespelem | 2.58% | 0.40%(+2.18)#17 | 0.20%(+2.38)#312 |
| 18. | Bickleton | 2.56% | 0.40%(+2.17)#18 | 0.20%(+2.37)#316 |
| 19. | Midland | 2.28% | 0.40%(+1.88)#19 | 0.20%(+2.08)#346 |
| 20. | Parkwood | 2.16% | 0.40%(+1.77)#20 | 0.20%(+1.97)#364 |
| 21. | Frederickson | 2.14% | 0.40%(+1.75)#21 | 0.20%(+1.94)#368 |
| 22. | Yelm | 2.06% | 0.40%(+1.66)#22 | 0.20%(+1.86)#379 |
| 23. | Fairwood Cdp King County | 2.01% | 0.40%(+1.61)#23 | 0.20%(+1.81)#382 |
| 24. | Mukilteo | 1.94% | 0.40%(+1.54)#24 | 0.20%(+1.74)#387 |
| 25. | Steilacoom | 1.92% | 0.40%(+1.52)#25 | 0.20%(+1.72)#388 |
| 26. | Jamestown | 1.84% | 0.40%(+1.44)#26 | 0.20%(+1.64)#396 |
| 27. | North Lynnwood | 1.83% | 0.40%(+1.44)#27 | 0.20%(+1.63)#399 |
| 28. | Larch Way | 1.75% | 0.40%(+1.35)#28 | 0.20%(+1.55)#416 |
| 29. | Bethel | 1.73% | 0.40%(+1.33)#29 | 0.20%(+1.53)#418 |
| 30. | Carlsborg | 1.72% | 0.40%(+1.32)#30 | 0.20%(+1.52)#423 |
| 31. | Fife | 1.52% | 0.40%(+1.12)#31 | 0.20%(+1.32)#469 |
| 32. | Tanglewilde | 1.51% | 0.40%(+1.12)#32 | 0.20%(+1.32)#470 |
| 33. | Puget Island | 1.51% | 0.40%(+1.12)#33 | 0.20%(+1.32)#471 |
| 34. | Colton | 1.47% | 0.40%(+1.07)#34 | 0.20%(+1.27)#482 |
| 35. | Burlington | 1.43% | 0.40%(+1.04)#35 | 0.20%(+1.23)#489 |
| 36. | Summit View | 1.43% | 0.40%(+1.03)#36 | 0.20%(+1.23)#491 |
| 37. | Snoqualmie | 1.37% | 0.40%(+0.970)#37 | 0.20%(+1.17)#509 |
| 38. | Lakewood | 1.35% | 0.40%(+0.952)#38 | 0.20%(+1.15)#513 |
| 39. | Belfair | 1.34% | 0.40%(+0.946)#39 | 0.20%(+1.14)#517 |
| 40. | Vashon | 1.32% | 0.40%(+0.921)#40 | 0.20%(+1.12)#525 |
| 41. | Lake Forest Park | 1.30% | 0.40%(+0.904)#41 | 0.20%(+1.10)#534 |
| 42. | Waller | 1.29% | 0.40%(+0.893)#42 | 0.20%(+1.09)#536 |
| 43. | Oakville | 1.22% | 0.40%(+0.824)#43 | 0.20%(+1.02)#557 |
| 44. | Taholah | 1.22% | 0.40%(+0.819)#44 | 0.20%(+1.02)#560 |
| 45. | Sudden Valley | 1.20% | 0.40%(+0.801)#45 | 0.20%(+0.999)#569 |
| 46. | Tracyton | 1.19% | 0.40%(+0.798)#46 | 0.20%(+0.996)#572 |
| 47. | Latah | 1.19% | 0.40%(+0.795)#47 | 0.20%(+0.993)#573 |
| 48. | Graham | 1.18% | 0.40%(+0.783)#48 | 0.20%(+0.981)#577 |
| 49. | Lake Shore | 1.17% | 0.40%(+0.773)#49 | 0.20%(+0.971)#579 |
| 50. | Davenport | 1.14% | 0.40%(+0.739)#50 | 0.20%(+0.937)#596 |
| 51. | Whidbey Island Station | 1.13% | 0.40%(+0.732)#51 | 0.20%(+0.930)#599 |
| 52. | Three Lakes | 1.12% | 0.40%(+0.724)#52 | 0.20%(+0.922)#602 |
| 53. | Moses Lake North | 1.05% | 0.40%(+0.653)#53 | 0.20%(+0.851)#638 |
| 54. | Spanaway | 1.04% | 0.40%(+0.645)#54 | 0.20%(+0.843)#640 |
| 55. | Millwood | 1.04% | 0.40%(+0.640)#55 | 0.20%(+0.839)#642 |
| 56. | South Hill | 1.03% | 0.40%(+0.636)#56 | 0.20%(+0.834)#645 |
| 57. | Kitsap Lake | 1.02% | 0.40%(+0.627)#57 | 0.20%(+0.825)#651 |
| 58. | Parkland | 1.02% | 0.40%(+0.625)#58 | 0.20%(+0.823)#653 |
| 59. | Pullman | 0.99% | 0.40%(+0.599)#59 | 0.20%(+0.797)#660 |
| 60. | Anderson Island | 0.99% | 0.40%(+0.591)#60 | 0.20%(+0.789)#666 |
| 61. | Gold Bar | 0.98% | 0.40%(+0.588)#61 | 0.20%(+0.786)#669 |
| 62. | Martha Lake | 0.95% | 0.40%(+0.554)#62 | 0.20%(+0.752)#690 |
| 63. | Mount Vista | 0.92% | 0.40%(+0.527)#63 | 0.20%(+0.725)#703 |
| 64. | Sultan | 0.90% | 0.40%(+0.501)#64 | 0.20%(+0.699)#715 |
| 65. | Picnic Point | 0.87% | 0.40%(+0.478)#65 | 0.20%(+0.677)#729 |
| 66. | Kittitas | 0.86% | 0.40%(+0.463)#66 | 0.20%(+0.661)#743 |
| 67. | Wollochet | 0.85% | 0.40%(+0.456)#67 | 0.20%(+0.654)#746 |
| 68. | Arlington | 0.83% | 0.40%(+0.438)#68 | 0.20%(+0.636)#755 |
| 69. | Port Orchard | 0.83% | 0.40%(+0.432)#69 | 0.20%(+0.630)#767 |
| 70. | Fife Heights | 0.83% | 0.40%(+0.431)#70 | 0.20%(+0.629)#768 |
| 71. | Machias | 0.79% | 0.40%(+0.398)#71 | 0.20%(+0.596)#789 |
| 72. | Washougal | 0.79% | 0.40%(+0.395)#72 | 0.20%(+0.593)#797 |
| 73. | Lake Stevens | 0.79% | 0.40%(+0.393)#73 | 0.20%(+0.591)#800 |
| 74. | Ruston | 0.79% | 0.40%(+0.392)#74 | 0.20%(+0.590)#801 |
| 75. | Auburn | 0.79% | 0.40%(+0.390)#75 | 0.20%(+0.588)#803 |
| 76. | Colfax | 0.79% | 0.40%(+0.390)#76 | 0.20%(+0.588)#804 |
| 77. | Sisco Heights | 0.77% | 0.40%(+0.378)#77 | 0.20%(+0.576)#814 |
| 78. | Cashmere | 0.74% | 0.40%(+0.344)#78 | 0.20%(+0.542)#846 |
| 79. | Naches | 0.74% | 0.40%(+0.341)#79 | 0.20%(+0.539)#849 |
| 80. | Aberdeen Gardens | 0.73% | 0.40%(+0.337)#80 | 0.20%(+0.535)#856 |
| 81. | Carbonado | 0.73% | 0.40%(+0.331)#81 | 0.20%(+0.530)#860 |
| 82. | Edmonds | 0.72% | 0.40%(+0.325)#82 | 0.20%(+0.524)#862 |
| 83. | Salmon Creek | 0.72% | 0.40%(+0.323)#83 | 0.20%(+0.521)#866 |
| 84. | Maple Valley | 0.71% | 0.40%(+0.311)#84 | 0.20%(+0.509)#875 |
| 85. | Sumner | 0.70% | 0.40%(+0.303)#85 | 0.20%(+0.501)#881 |
| 86. | Mill Creek East | 0.69% | 0.40%(+0.296)#86 | 0.20%(+0.494)#885 |
| 87. | Pacific | 0.68% | 0.40%(+0.281)#87 | 0.20%(+0.479)#908 |
| 88. | Bremerton | 0.68% | 0.40%(+0.279)#88 | 0.20%(+0.478)#911 |
| 89. | Marysville | 0.65% | 0.40%(+0.259)#89 | 0.20%(+0.457)#938 |
| 90. | Lacey | 0.65% | 0.40%(+0.249)#90 | 0.20%(+0.447)#946 |
| 91. | Vancouver | 0.63% | 0.40%(+0.231)#91 | 0.20%(+0.429)#973 |
| 92. | Suquamish | 0.62% | 0.40%(+0.228)#92 | 0.20%(+0.426)#976 |
| 93. | Lakeland North | 0.62% | 0.40%(+0.226)#93 | 0.20%(+0.424)#979 |
| 94. | Lakeland South | 0.60% | 0.40%(+0.207)#94 | 0.20%(+0.405)#1,014 |
| 95. | Tacoma | 0.60% | 0.40%(+0.204)#95 | 0.20%(+0.403)#1,020 |
| 96. | Pe Ell | 0.58% | 0.40%(+0.189)#96 | 0.20%(+0.387)#1,038 |
| 97. | Kent | 0.58% | 0.40%(+0.186)#97 | 0.20%(+0.384)#1,044 |
| 98. | Oak Harbor | 0.57% | 0.40%(+0.177)#98 | 0.20%(+0.375)#1,051 |
| 99. | Zillah | 0.57% | 0.40%(+0.175)#99 | 0.20%(+0.373)#1,055 |
| 100. | Maplewood | 0.56% | 0.40%(+0.166)#100 | 0.20%(+0.364)#1,072 |
Common Questions
What are the Top 10 Cities with the Highest Percentage of Native Hawaiian Population in Washington?
Top 10 Cities with the Highest Percentage of Native Hawaiian Population in Washington are:
#1
23.39%
#2
16.85%
#3
11.11%
#4
8.93%
#5
8.09%
#6
7.41%
#7
4.36%
#8
4.19%
#9
3.83%
#10
3.81%
What city has the Highest Percentage of Native Hawaiian Population in Washington?
Alder has the Highest Percentage of Native Hawaiian Population in Washington with 23.39%.
What is the Percentage of Native Hawaiian Population in the State of Washington?
Percentage of Native Hawaiian Population in Washington is 0.40%.
What is the Percentage of Native Hawaiian Population in the United States?
Percentage of Native Hawaiian Population in the United States is 0.20%.